Learn how to design a trading system by Accumulation/Distribution (AD)
Mohamed Abdelmaaboud | 2 June, 2022
Introduction
Our series of articles is devoted to learning about the most popular technical indicators in detail and applying them in the form of simple strategies. Trading systems for these strategies are designed using MQL5 to execute these trading systems in the MetaTrader 5 trading platform. In the current article, we will learn about Accumulation/Distribution (AD), a new technical volume-based indicator that can show us another perspective on the instrument. We will cover this indicator through the following topics:
First, we will learn in detail about this new technical indicator and what it measures, as well as how we can use it and calculate it manually to know the main concept behind it. Then, we are going to design a trading system based on it. We will apply this calculation to an example to better grasp the concept. After learning about the AD indicator basics in detail, we will learn how we can use it in simple strategies. Then we will design a blueprint for each mentioned strategy to help us design and create a trading system for them. After designing all blueprints for all mentioned simple strategies, we will get to the most interesting part of this article as we will learn how to create or write our MQL5 code to create a trading system that can be executed in MetaTrader 5 trading platform.
By that time, we will cover the AD indicator in detail by learning how to use it. After that, we will create a trading system for mentioned simple strategies. I advise you to try to apply what you learn by writing mentioned codes by yourself as this will help you deepen your understanding because the main objective of this article (just like of the others in this series) is to give insights to novice programmers about how to code or design trading systems based on the most popular indicators. Also, we will use the MetaQuotes Language (MQL5) to write our codes in MetaEditor built into MetaTrader 5. If you want to know how to install MetaTrader 5 or how to use the MetaEditor, read the Writing MQL5 code in the MetaEditor topic from my previous article.
Disclaimer: All information is provided 'as is' only for educational purposes and is not meant for trading purposes or advice. The information does not guarantee any kind of result. If you choose to use these materials on any of your trading accounts, you will do that at your own risk and you will be the only responsible.
Now, let us go through our topics to step a new mile in our learning journey about trading and MQL5.
AD definition
Here I will talk about the Accumulation/Distribution (AD) indicator in detail and define what it is, what it measures, how we can calculate it and what concept lies behind it. The AD line indicator was developed by Marc Chaikin. It is a volume-based indicator which means that the volume is used in its calculation and it gives us insights into the volume which is an important perspective in the trading in general as it measures the cumulative flow of money into and out of the instrument. Besides, it uses the volume to confirm the trend or to warn of the reversal. If you want to know more about the trend, its types, and how we can identify it, read the trend definition subsection in the previous article.
Just like any cumulative indicator, the AD line is the running total for the Money Flow Volume of each period. This fact becomes very clear during the indicator calculation. Let's see how we can calculate the AD line through the following steps.
There are three steps to calculate the AD line:
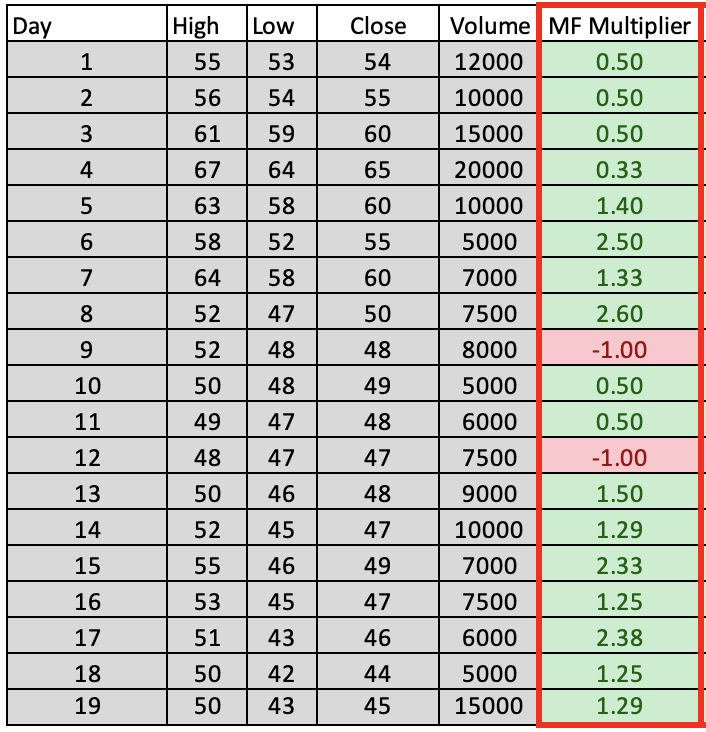
- Calculating the money flow multiplier = ((close-low)-(high-close))/(high-low)
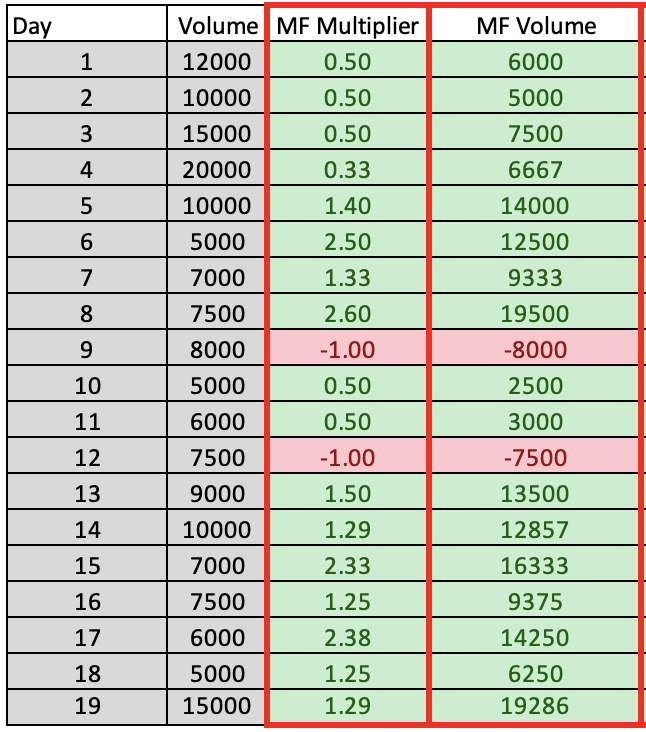
- Calculating the money flow volume = money flow multiplier * period volume
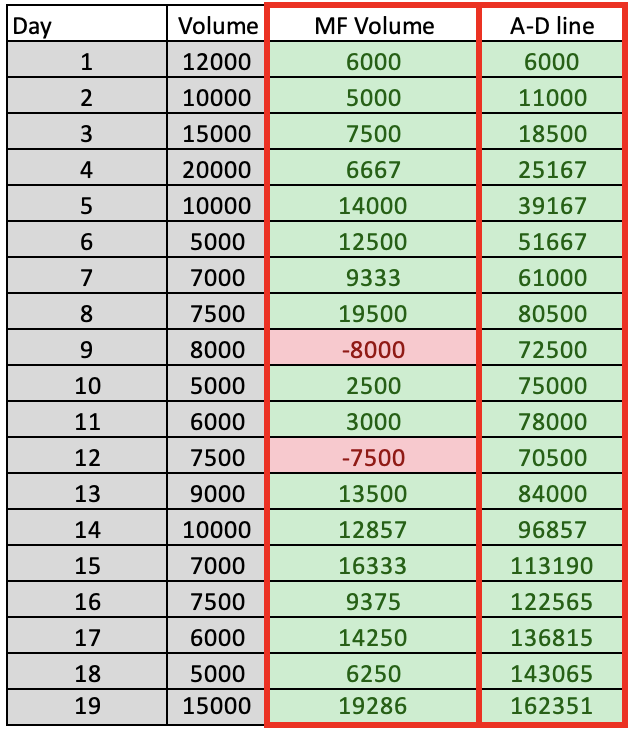
- AD line = previous AD line value + current money flow volume
Now we need to consider an example to apply these steps to calculate the AD line if we have the following data for an instrument:
| Day | High | Low | Close | Volume |
|---|---|---|---|---|
| 1 | 55 | 53 | 54 | 12000 |
| 2 | 56 | 54 | 55 | 10000 |
| 3 | 61 | 59 | 60 | 15000 |
| 4 | 67 | 64 | 65 | 20000 |
| 5 | 63 | 58 | 60 | 10000 |
| 6 | 58 | 52 | 55 | 5000 |
| 7 | 64 | 58 | 60 | 7000 |
| 8 | 52 | 47 | 50 | 7500 |
| 9 | 52 | 48 | 48 | 8000 |
| 10 | 50 | 48 | 49 | 5000 |
| 11 | 49 | 47 | 48 | 6000 |
| 12 | 48 | 47 | 47 | 7500 |
| 13 | 50 | 46 | 48 | 9000 |
| 14 | 52 | 45 | 47 | 10000 |
| 15 | 55 | 46 | 49 | 7000 |
| 16 | 53 | 45 | 47 | 7500 |
| 17 | 51 | 43 | 46 | 6000 |
| 18 | 50 | 42 | 44 | 5000 |
| 19 | 50 | 43 | 45 | 15000 |
Now we need to calculate the AD line based on the previously given data. The calculation will be the same as the following:
First, we will calculate the money flow multiplier = ((close-low)-(high-close))/(high-low), then we will find it the same as in the following figure:
Second, we will calculate the money flow volume = money flow multiplier * period volume, then we can find it the same as the following figure:
Third, we will calculate the AD line = previous AD line value + current money flow volume, then we will find it the same as the following figure:
Now that we have calculated the AD line manually, we do not need to do that, but we did it to understand the concept behind the AD indicator. Currently, If we want to see the AD indicator, all we need to do is choose it among the available indicators in MetaTrader 5 terminal.
First, while opening the MetaTrader 5, click the Insert tab --> Indicators --> Volumes --> Accumulation/Distribution
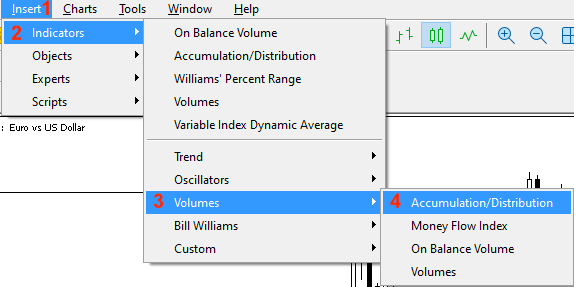
After choosing the indicator, the following window is opened for the AD indicator parameters:
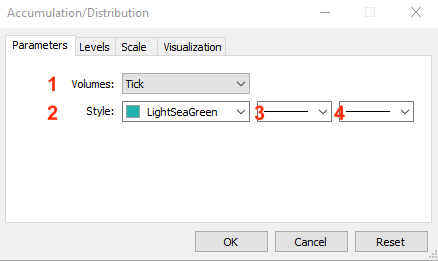
1. Types of volumes: Tick or Real.
2. AD line color.
3. AD line types.
4. AD line thickness.
After determining what you need to use and pressing OK, the following figure will be shown for the AD indicator:
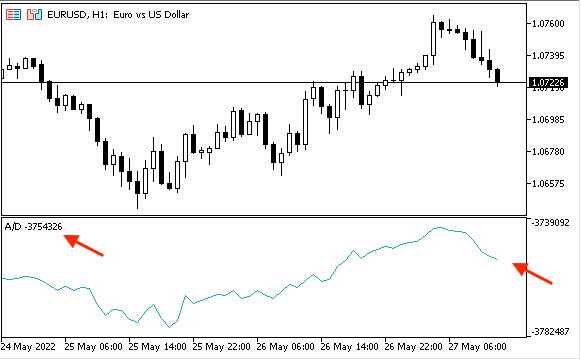
Now, we need to know how we can use the AD indicator.
AD strategy
In this section, we will learn how we can use the AD indicator in our favor to enhance our trading through simple strategies. I hope, you can get more new ideas that can be beneficial for your trading.
You may find that these strategies need to be optimized. This is fine because the main objective here is to share simple strategies that can be helpful to let us understand the basic concept behind the AD indicator and how we can create a trading system for them by means of MQL5. So you have to test every strategy before using it on your real account as it might need to be optimized or edited. Also, you can edit the length of usable periods to be more significant or to be suitable for your trading.
Now, we will see simple strategies that can be used by the AD indicator.
- Strategy one: simple AD movement:
According to this strategy, we need to know the movement of the AD line – if it is rising or declining. We will perform a simple comparison between the current AD value and the previous AD value. If the current AD value is greater than the previous one, the AD line is rising and vice versa. If the current value is less than the previous one, the AD line is declining.
Simply, we can say:
Current AD > Previous AD --> the AD line is rising
Current AD < Previous AD --> the AD line is declining
- Strategy two: simple AD strength:
According to this strategy, we need to know if the current movement of the AD line is strong or weak and we will do that by simple comparison between the current AD value and the maximum or minimum value of the last ten AD values. If the current value is greater than the maximum value of the previous 10 AD values, so the current AD value is strong and vice versa. If the current value is less than the minimum value of the previous 10 AD values, the current AD value is weak.
Simply, it will be the same as the following:
Current AD > Maximum value of the previous 10 AD values --> the AD current value is strong
Current AD < minimum value of the previous 10 AD values --> the AD current value is weak
- Strategy three: simple AD - uptrend:
According to this strategy, we need to know if the current up movement during the uptrend is strong or if there is a bearish divergence in its simple form. The Bearish divergence simply is when we see the price creates a new high but the indicator does not confirm this movement as it moves lower. We will check that by comparing the last two consecutive values of the AD and the last two consecutive values of high for simplicity purpose only but you can edit the period of examining to get more significant insights. So, we need here to benefit from the concept stating that it is better to see the volume going with the trend: during the uptrend, the volume increases with up moves and decreases in case of a correction.
We will compare the current AD value with the previous one and the current high price with the previous high price. If the current AD value is greater than the previous AD value and the current high is greater than the previous high, so, there is a strong up move during the uptrend. Or, if the current AD value is less than the previous AD value and the current high is greater than the previous high, so, there is a bearish divergence.
Simply, it will be the same as the following:
The current AD > the previous AD and the current high > the previous high --> Strong up move during the uptrend
The current AD < the previous AD and the current high > the previous high --> Bearish divergence
- Strategy four: simple AD - downtrend:
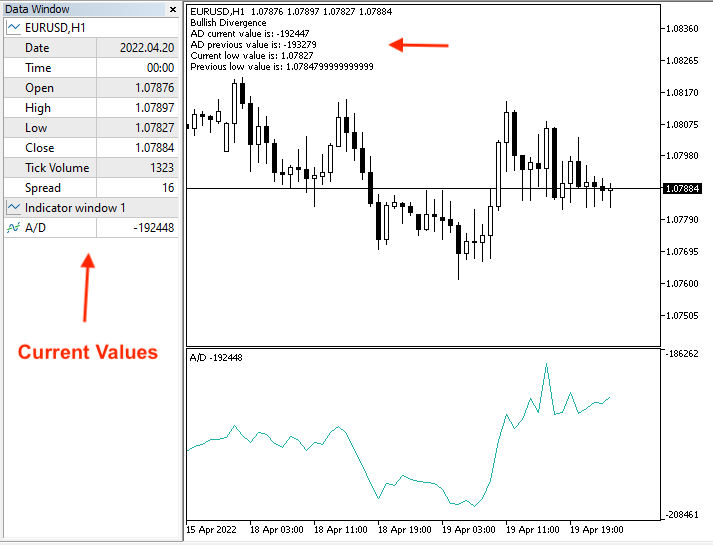
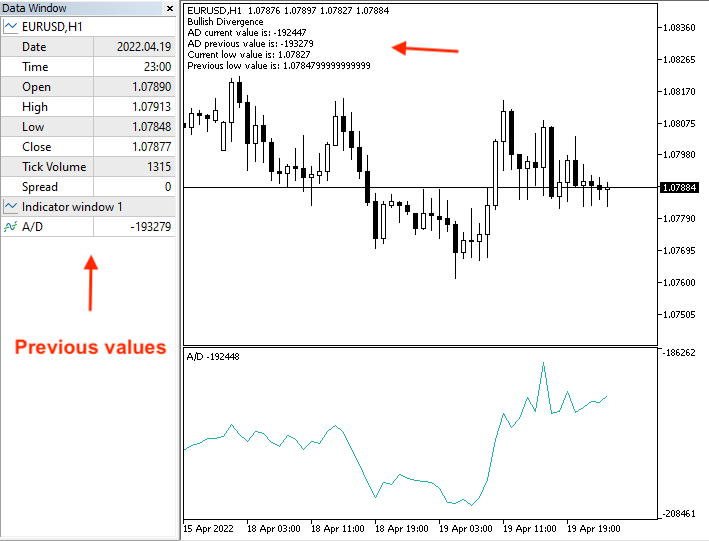
This strategy will be the opposite of the simple AD - uptrend strategy, we need to know if the current down movement during the downtrend is strong or if there is a bullish divergence in its simple form. The bullish divergence is when we see the price creates a new low but the indicator does not confirm this movement and moves higher and we will check that by comparing the last two consecutive values of the AD indicator and the last two consecutive values of low. If the current AD value is less than the previous AD value and the current low is less than the previous low, so, there is a strong down move during the downtrend. Or, if the current AD value is greater than the previous AD value and the current low is less than the previous low, so, there is a bullish divergence.
It will be as simple as the following:
The current AD < the previous AD and the current low < the previous low --> Strong down move during the downtrend
The current AD > the previous AD and the current low < the previous low --> Bullish divergence
AD strategy blueprint
Now, it is time to organize our steps to create our trading system because in this part we will create a step-by-step blueprint for each strategy to help us create our trading system smoothly. I believe that this step is very important in any trading system creation process. So, we will design a blueprint for each strategy to know what we need to do and they are will be the same as the following.
First, we need to design a blueprint for a simple strategy that presents the AD current value as a comment on the chart to be the base of upcoming strategies. We will call it the simple AD and all that we need from this system to do only is to display the current AD value on the chart as a comment and the following is the blueprint for doing that:
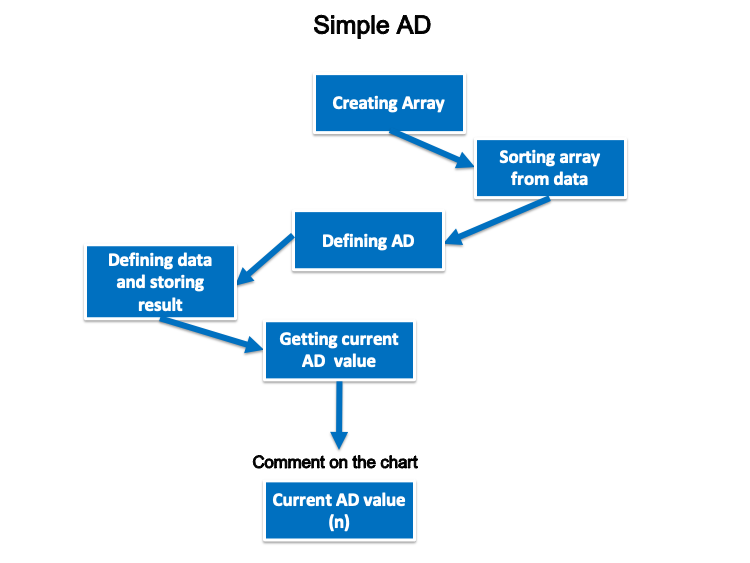
Now, we need to design a blueprint for each mentioned strategy.
- Strategy one: simple AD movement:
For every tick, we need the trading system to check two values of the current AD and the previous one continuously, while it is executed, and decide if the current one is greater than the previous. We need to return a comment on the chart with the rising AD line, AD current value and AD previous value. Each value will be in a separate line. On the other hand, if the current value is less than the previous one, we need to return a comment on the chart with the declining AD line, AD current value and AD previous value. Each value is in a separate line and the following is the blueprint to create this trading system:
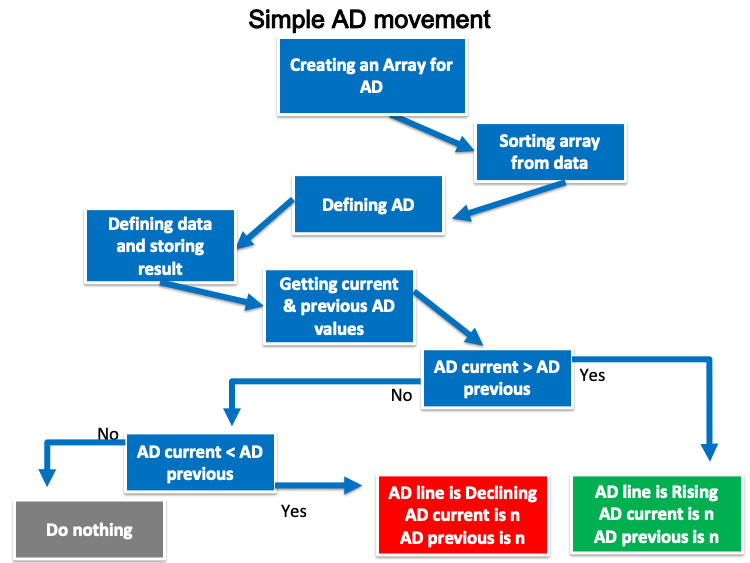
- Strategy two: simple AD strength:
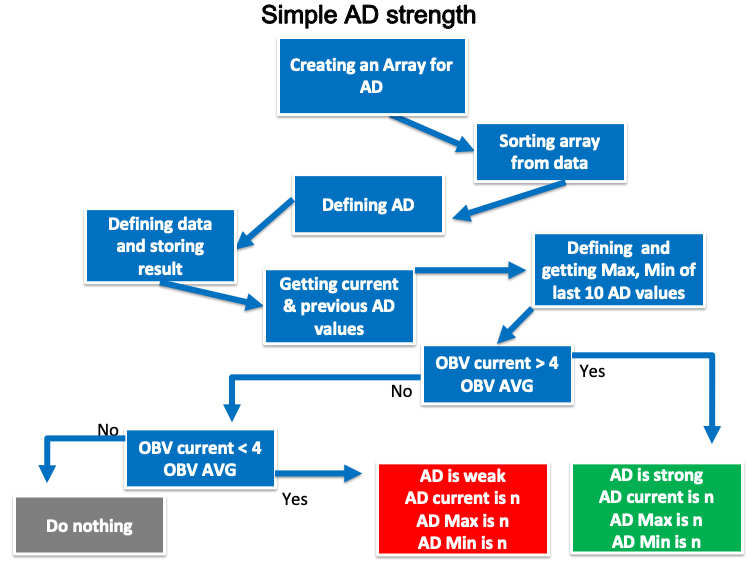
According to this strategy, we need to design a trading system that can check at every tick from three values continuously if it is executed. The three values are the current AD value, the maximum value of the last ten AD values and the minimum value of the last ten AD values. If the current AD value is greater than the maximum value, we need the system to return the appropriate notification, AD current value, AD Max value and AD Min value. Each value is set in a separate line. If the current AD value is below the minimum value, we need the system to return the appropriate notification, AD current value, AD Max value and AD Min value. Each value is set in a separate line.
The following is the blueprint to do that:
- Strategy three: simple AD - uptrend:
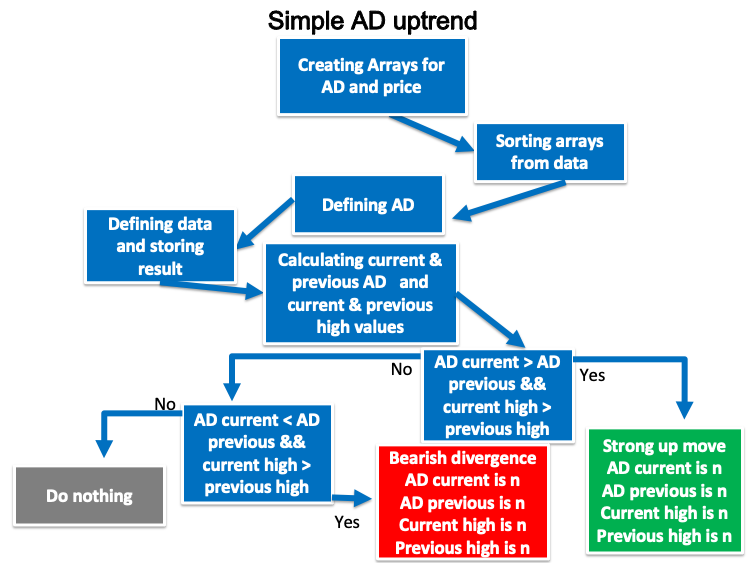
We need to create a trading system for this strategy that can check four values: the current AD, the previous AD, the current high, and the previous high, and perform that at every tick during the uptrend. Then, we need the system to decide, if the current AD is greater than the previous AD and if the current high is greater than the previous high. We need the system to return comment on the chart with a strong up move during the uptrend, AD current, AD previous, current high and previous high. Each value is set in a separate line. Another case we need to flag is if the current AD is less than the previous one and the current high is greater than the previous high. We need the system to return bearish divergence, AD current, AD previous, current and previous highs and each value in a separate line.
The following is the blueprint to create this trading system:
- Strategy four: simple AD - downtrend:
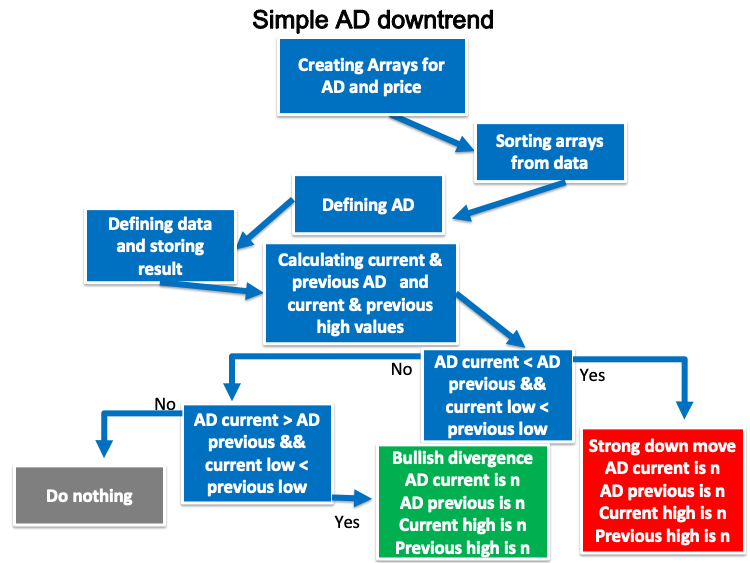
We need to create a trading system for this strategy that can check four values: the current AD, the previous AD, the current low and the previous low, and perform that every tick during the downtrend. Then, we need the system to decide if the current AD is less than the previous AD and if the current low is less than the previous low. We need the system to return comment on the chart with a strong down move during the downtrend, AD current, AD previous, current low and previous low at each value in a separate line. Another case we need to flag is if the current AD is greater than the previous one and the current low is less than the previous low. We need the system to return a comment with bullish divergence, AD current, AD previous, current and previous lows and each value in a separate line.
The following is the blueprint to create this trading system:
AD strategy trading system
In this interesting section, we will learn how to create a trading system after understanding and designing what we need to do. We will start with creating a simple AD system returning only the AD current value to be a base for our strategies. The following is how to code it:
- Creating an array for the AD by using the "double" function to represent the value in a fractional part.
double ADArray[]; - Sorting the array from current data by using the ArraySetAsSeries function.
ArraySetAsSeries(ADArray,true);
- Defining the AD by using the iAD function after creating an integer variable of ADDef. The iAD function returns the handle of the indicator of Accumulation/Distribution and its parameters are (symbol, period and applied volume).
int ADDef=iAD(_Symbol,_Period,VOLUME_TICK);
- Filling the ADArray by using the CopyBuffer function to return the copied data count and its parameters are (indicator handle, buffer num, start time, stop time and buffer).
CopyBuffer(ADDef,0,0,3,ADArray);
- Calculating the AD current value by using the NormalizeDouble function that returns a double type value after creating an integer variable for ADValue.
int ADValue=NormalizeDouble(ADArray[0],5);
- Creating a comment on the chart by using the Comment function.
Comment("AD Value is: ",ADValue);
The following is the full code of the simple AD:
//+------------------------------------------------------------------+
//|                                                    Simple AD.mq5 |
//|                                  Copyright 2022, MetaQuotes Ltd. |
//|                                             https://www.mql5.com |
//+------------------------------------------------------------------+
#property copyright "Copyright 2022, MetaQuotes Ltd."
#property link      "https://www.mql5.com"
#property version   "1.00"
//+------------------------------------------------------------------+
void OnTick()
  {
   //create an array for AD
   double ADArray[];

   //sorting the array from the current data
   ArraySetAsSeries(ADArray,true);

   //defining AD
   int ADDef=iAD(_Symbol,_Period,VOLUME_TICK);

   //filling the ADArray with ADDef
   CopyBuffer(ADDef,0,0,3,ADArray);

   //calculating current AD value
   int ADValue=NormalizeDouble(ADArray[0],5);

   //creating a comment with AD value
   Comment("AD Value is: ",ADValue);
  }
//+------------------------------------------------------------------+
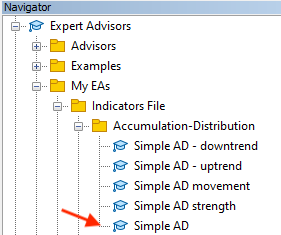
After compiling this code, we can find it appeared in the Navigator window among the Expert Advisors folder:
We can execute it by dragging and dropping the EA on the chart. The following window will appear:
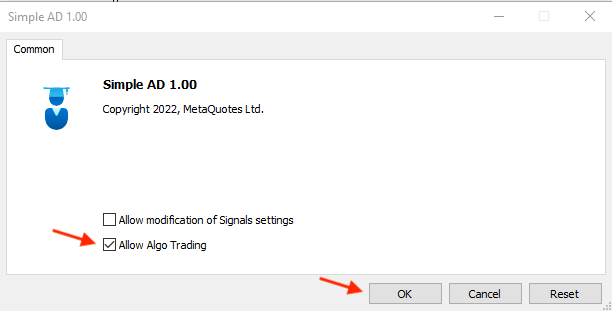
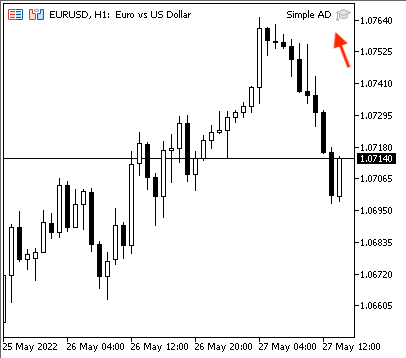
After clicking OK, it will be attached to the chart as shown below:
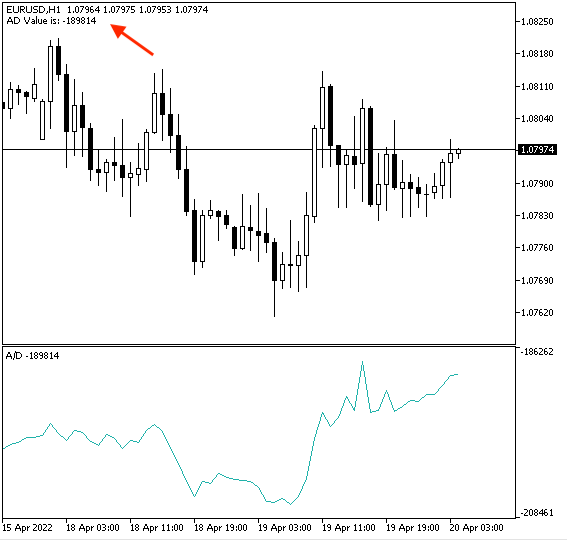
The following is an example of the generated comment according to this EA from testing:
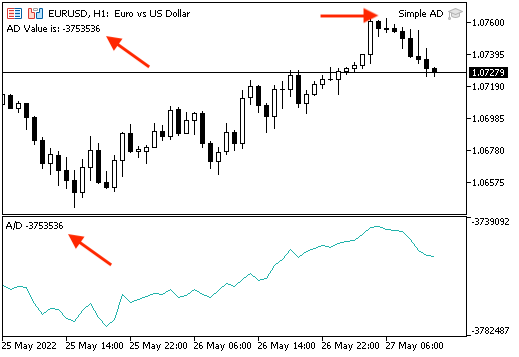
If we need to make sure that the EA will generate the same value as the original MetaTrader 5 indicator, we can insert the indicator and attach the EA simultaneously. We can see that they are the same:
- Strategy one: simple AD movement:
The following is the full code to create an EA that can be executed and generates the desired signals according to this strategy:
//+------------------------------------------------------------------+
//|                                           Simple AD movement.mq5 |
//|                                  Copyright 2022, MetaQuotes Ltd. |
//|                                             https://www.mql5.com |
//+------------------------------------------------------------------+
#property copyright "Copyright 2022, MetaQuotes Ltd."
#property link      "https://www.mql5.com"
#property version   "1.00"
//+------------------------------------------------------------------+
void OnTick()
  {
   //create array for AD
   double ADArray[];

   //sorting array from the current data
   ArraySetAsSeries(ADArray,true);

   //defining AD
   int ADDef=iAD(_Symbol,_Period,VOLUME_TICK);

   //filling the ADArray with ADDef
   CopyBuffer(ADDef,0,0,3,ADArray);

   //calculating current AD and previous values
   int ADCurrrentValue=NormalizeDouble(ADArray[0],5);
   int ADPrevValue=NormalizeDouble(ADArray[1],5);

   //Comparing two values and giving signal
   //Rising AD
   if(ADCurrrentValue>ADPrevValue)
   {
      Comment("AD line is rising","\n","AD current value is: ",ADCurrrentValue,
      "\n","AD previous value is: ",ADPrevValue);
   }

   //Declining AD
   if(ADCurrrentValue<ADPrevValue)
   {
      Comment("AD line is declining","\n","AD current value is: ",ADCurrrentValue,
      "\n","AD previous value is: ",ADPrevValue);
   }
  }
//+------------------------------------------------------------------+
The previous code is different than the base code and the following are differences:
- Calculating two values of current and previous AD:
int ADCurrrentValue=NormalizeDouble(ADArray[0],5);
int ADPrevValue=NormalizeDouble(ADArray[1],5);
- Setting conditions and generated comments according to this strategy:
- Rising AD line:
if(ADCurrrentValue>ADPrevValue)
{
 Comment("AD line is rising","\n","AD current value is: ",ADCurrrentValue,
 "\n","AD previous value is: ",ADPrevValue);
}
- Declining AD line:
if(ADCurrrentValue<ADPrevValue)
{
 Comment("AD line is declining","\n","AD current value is: ",ADCurrrentValue,
 "\n","AD previous value is: ",ADPrevValue);
}
After compiling this code, we can find the EA in the Navigator window:
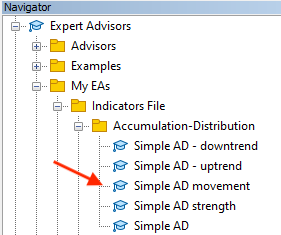
By double-clicking on it, we can find the following window:
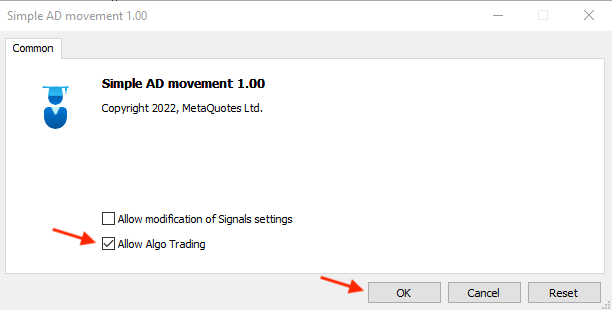
After pressing OK, it will be attached to the chart:
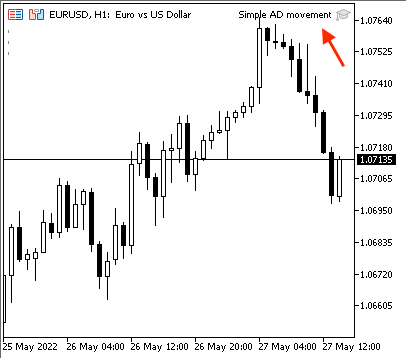
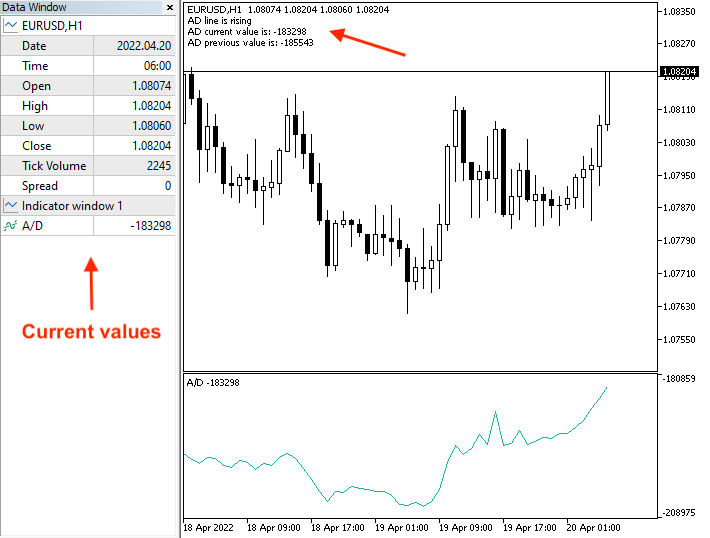
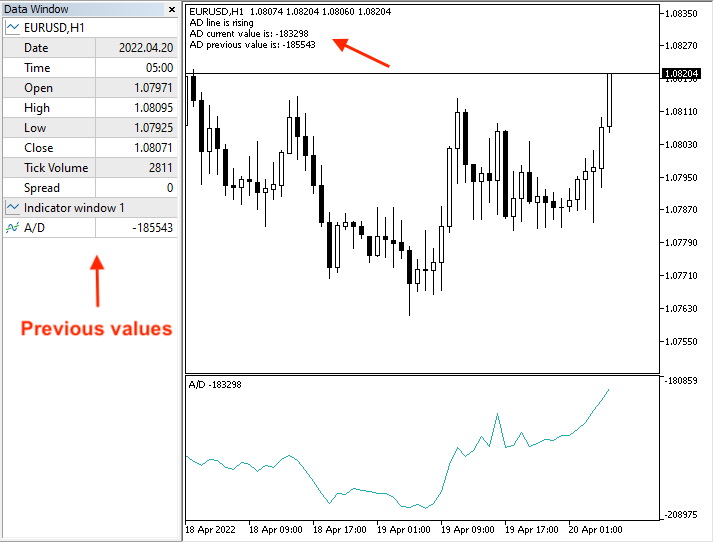
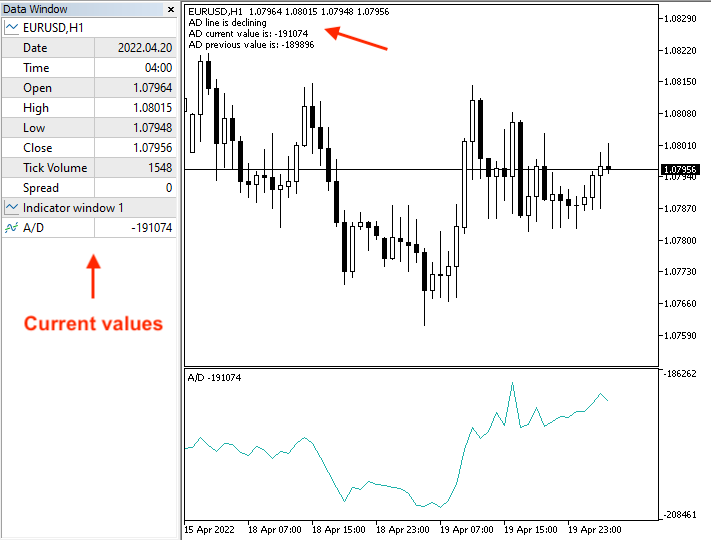
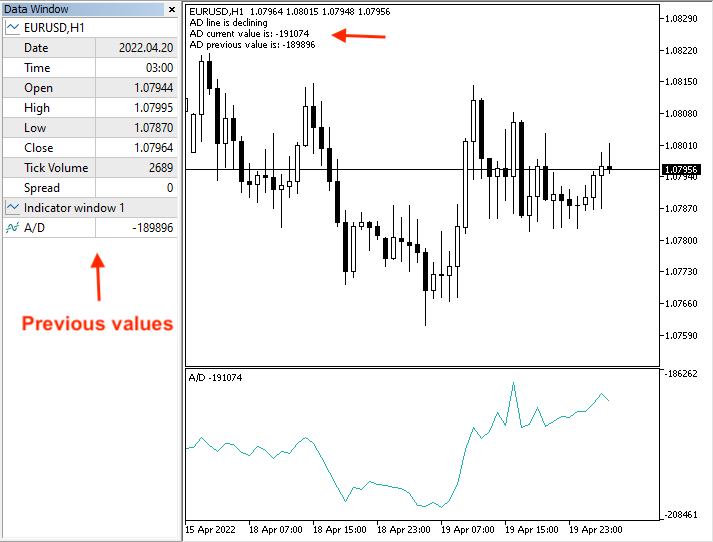
The following is an example of generated signals with presenting data window of current and previous data:
Rising AD line,
Current data:
Previous data:
Declining AD,
Current data:
Previous data:
- Strategy two: simple AD strength:
The following is the full code to create an EA to execute our trading strategy:
//+------------------------------------------------------------------+
//|                                           Simple AD strength.mq5 |
//|                                  Copyright 2022, MetaQuotes Ltd. |
//|                                             https://www.mql5.com |
//+------------------------------------------------------------------+
void OnTick()
  {
   //Create array for AD
   double ADArray[];

   //sorting the array from the current data
   ArraySetAsSeries(ADArray,true);

   //defining AD
   int ADDef=iAD(_Symbol,_Period,VOLUME_TICK);

   //filling the ADArray with ADDef
   CopyBuffer(ADDef,0,0,10,ADArray);

   //calculating current AD and previous values
   int ADCurrrentValue=NormalizeDouble(ADArray[0],5);

   //Defining Max and Min values from the last 10 AD values
   int ADMax =ArrayMaximum(ADArray,1,10);
   int ADMin =ArrayMinimum(ADArray,1,10);

   //Calculating Max and Min values
   int ADMaxValue=ADArray[ADMax];
   int ADMinValue=ADArray[ADMin];

   //Comparing two values and giving signal
   //AD current is strong
   if(ADCurrrentValue>ADMaxValue)
   {
      Comment("AD Current value is strong","\n","AD current value is: ,",ADCurrrentValue,
   "\n","AD Max is: ",ADMaxValue,"\n","AD Min is: ",ADMinValue);
   }

   //AD current is weak
   if(ADCurrrentValue<ADMinValue)
   {
      Comment("AD Current value is weak","\n","AD current value is: ,",ADCurrrentValue,
   "\n","AD Max is: ",ADMaxValue,"\n","AD Min is: ",ADMinValue);
   }
  }
//+------------------------------------------------------------------+
The previous code has many differences in relation to the strategy and what we need the EA to do, and the following are a clarification of these differences:
- Defining AD maximum and minimum values by using the ArrayMaximum and ArrayMinimum functions after creating integer variables of ADMaxValue and ADMinValue. The ArrayMaximum returns an index of a found element with consideration of the array serial and searches for the largest element, while its parameters are the numeric array, index to start and the number of elements to search. The ArrayMinimum is the same as the ArrayMaximum but it searches for the lowest element.
int ADMax =ArrayMaximum(ADArray,1,10);
int ADMin =ArrayMinimum(ADArray,1,10);
- Calculating the ADMaxValue and ADMinValue after creating integer variables for them:
int ADMaxValue=ADArray[ADMax];
int ADMinValue=ADArray[ADMin];
- Setting conditions of the strategy and comments based on each condition,
- Strong AD value:
if(ADCurrrentValue>ADMaxValue)
{
 Comment("AD Current value is strong","\n","AD current value is: ,",ADCurrrentValue,
 "\n","AD Max is: ",ADMaxValue,"\n","AD Min is: ",ADMinValue);
}
- Weak AD value:
if(ADCurrrentValue<ADMinValue)
{
 Comment("AD Current value is weak","\n","AD current value is: ,",ADCurrrentValue,
 "\n","AD Max is: ",ADMaxValue,"\n","AD Min is: ",ADMinValue);
}
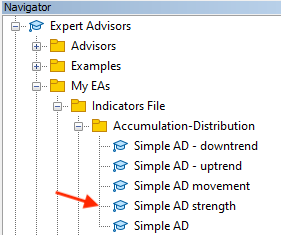
After compiling this code, the EA will be available in the Navigator:
After dragging and dropping it on the chart, its window will appear:
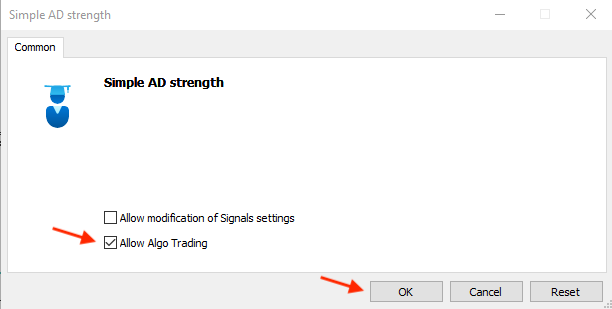
After pressing OK, it will be attached to the chart:
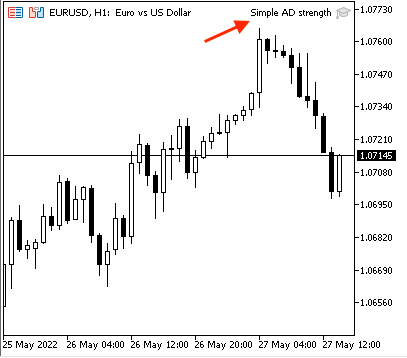
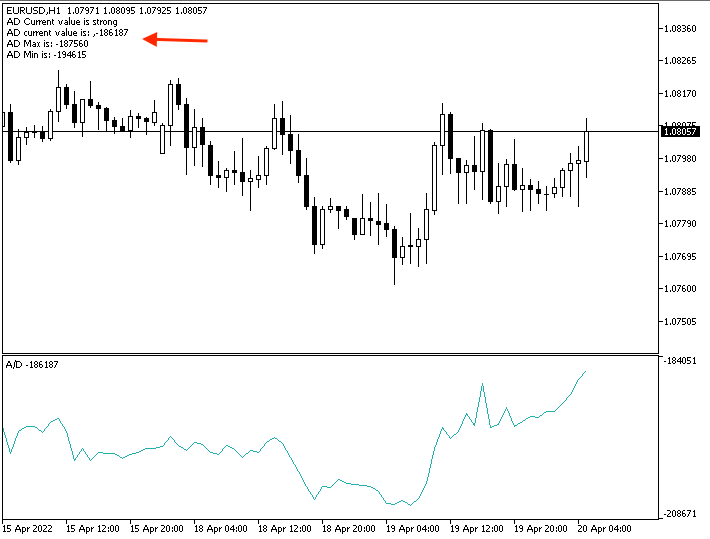
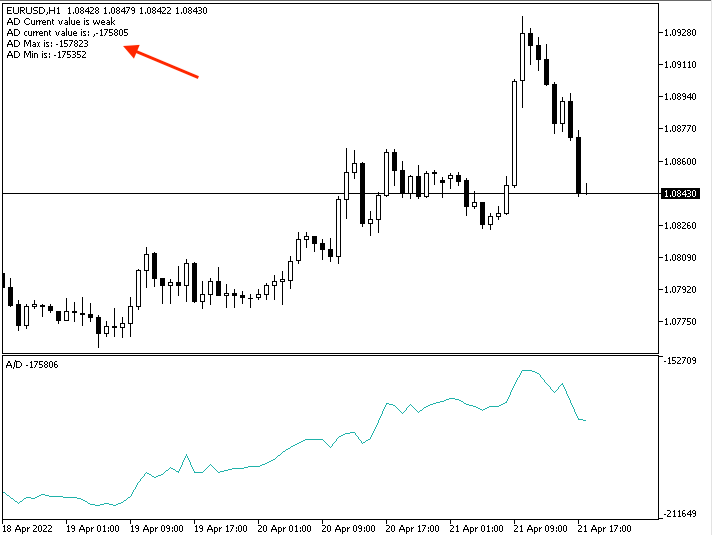
The following is an example from testing generated signals:
Strong AD:
Weak AD:
- Strategy three: simple AD uptrend:
The following is the full code to create a trading system for this strategy:
//+------------------------------------------------------------------+
//|                                          Simple AD - uptrend.mq5 |
//|                                  Copyright 2022, MetaQuotes Ltd. |
//|                                             https://www.mql5.com |
//+------------------------------------------------------------------+
#property copyright "Copyright 2022, MetaQuotes Ltd."
#property link      "https://www.mql5.com"
#property version   "1.00"
//+------------------------------------------------------------------+
void OnTick()
  {
   //Create two arrays for AD and price
   double ADArray[];
   MqlRates PriceArray[];

   //sorting the two arrays
   ArraySetAsSeries(ADArray,true);
   int Data=CopyRates(_Symbol,_Period,0,3,PriceArray);

   //defining AD
   int ADDef=iAD(_Symbol,_Period,VOLUME_TICK);

   //filling the ADArray with ADDef
   CopyBuffer(ADDef,0,0,3,ADArray);

   //calculating current AD and previous values
   int ADCurrrentValue=NormalizeDouble(ADArray[0],5);
   int ADPrevValue=NormalizeDouble(ADArray[1],5);

   //calculating current and previous highs
   double CurrentHighValue=NormalizeDouble(PriceArray[2].high,5);
   double PrevHighValue=NormalizeDouble(PriceArray[1].high,5);

   //Comparing two values and giving signal
   //Strong Up move
   if(ADCurrrentValue > ADPrevValue && CurrentHighValue>PrevHighValue)
   {
      Comment("Strong Up Move During The Uptrend","\n","AD current value is: ",ADCurrrentValue,
      "\n","AD previous value is: ",ADPrevValue,
      "\n","Current high value is: ",CurrentHighValue,
      "\n","Previous high value is: ",PrevHighValue);
   }

   //in case of divergence
   if(ADCurrrentValue < ADPrevValue && CurrentHighValue>PrevHighValue)
   {
      Comment("Bearish Divergence","\n","AD current value is: ",ADCurrrentValue,
      "\n","AD previous value is: ",ADPrevValue,
      "\n","Current low value is: ",CurrentHighValue,
      "\n","Previous low value is: ",PrevHighValue);
   }
  }
//+------------------------------------------------------------------+
Differences in this code:
- Creating two arrays: one for AD by using the 'double' function and another one for the price by using the MqlRates function that stores information about prices.
double ADArray[];
MqlRates PriceArray[];
- Sorting two arrays, one for the AD by using the ArraySetAsSeries function and another one for the price by using the CopyRates function to get historical data of the MqlRates structure after creating an integer variable for Data.
ArraySetAsSeries(ADArray,true);
int Data=CopyRates(_Symbol,_Period,0,3,PriceArray);
- Defining AD, filling the AD array:
int ADDef=iAD(_Symbol,_Period,VOLUME_TICK);

CopyBuffer(ADDef,0,0,3,ADArray);
- Calculating current AD, previous AD, current high and previous high:
int ADCurrrentValue=NormalizeDouble(ADArray[0],5);
int ADPrevValue=NormalizeDouble(ADArray[1],5);

double CurrentHighValue=NormalizeDouble(PriceArray[2].high,5);
double PrevHighValue=NormalizeDouble(PriceArray[1].high,5);
- Setting conditions of the strategy and desired comments:
- Strong up move:
if(ADCurrrentValue > ADPrevValue && CurrentHighValue>PrevHighValue)
{
 Comment("Strong Up Move During The Uptrend","\n","AD current value is: ",ADCurrrentValue,
 "\n","AD previous value is: ",ADPrevValue,
 "\n","Current high value is: ",CurrentHighValue,
 "\n","Previous high value is: ",PrevHighValue);
}
- Bearish divergence:
if(ADCurrrentValue < ADPrevValue && CurrentHighValue>PrevHighValue)
{
 Comment("Bearish Divergence","\n","AD current value is: ",ADCurrrentValue,
 "\n","AD previous value is: ",ADPrevValue,
 "\n","Current low value is: ",CurrentHighValue,
 "\n","Previous low value is: ",PrevHighValue);
}
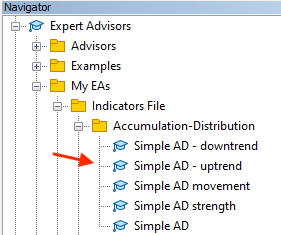
After compiling this code, we can find it in the Navigator window among the Expert Advisors folders:
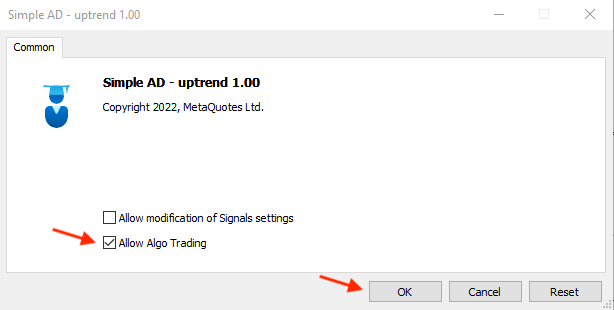
By double-clicking to execute it, its window will appear:
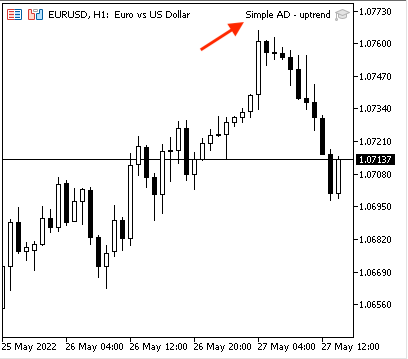
Clicking OK to attach it to the chart:
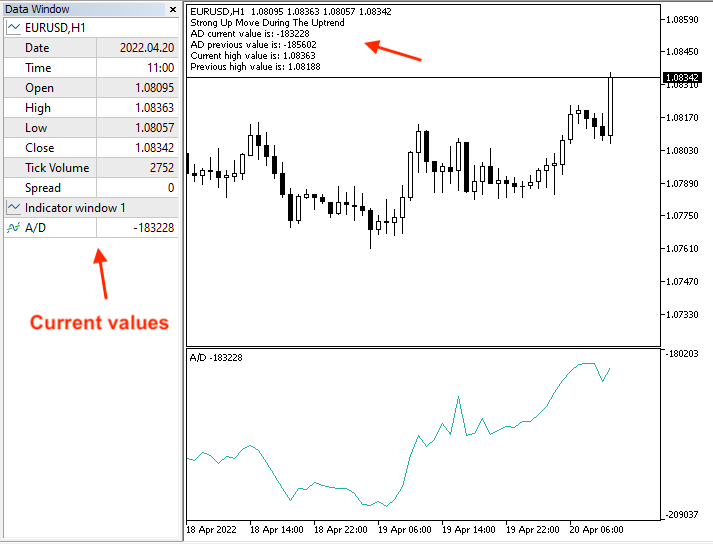
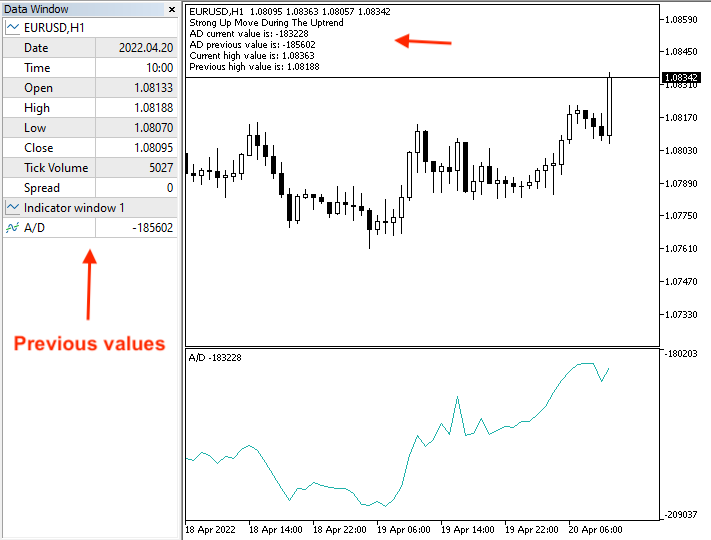
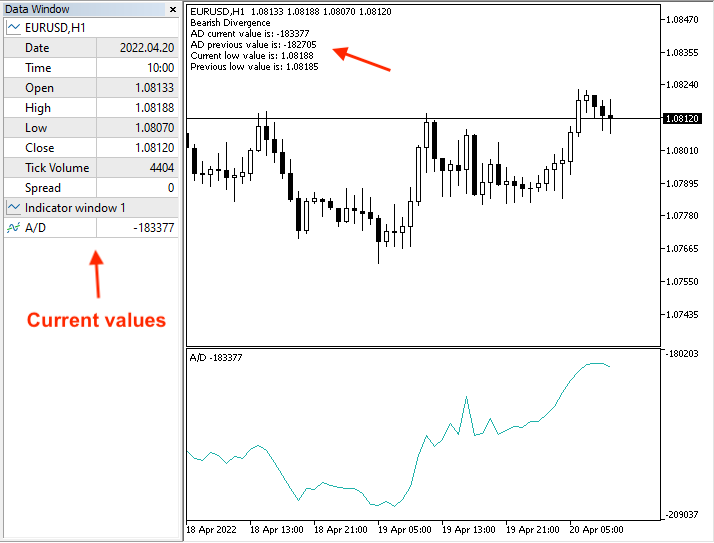
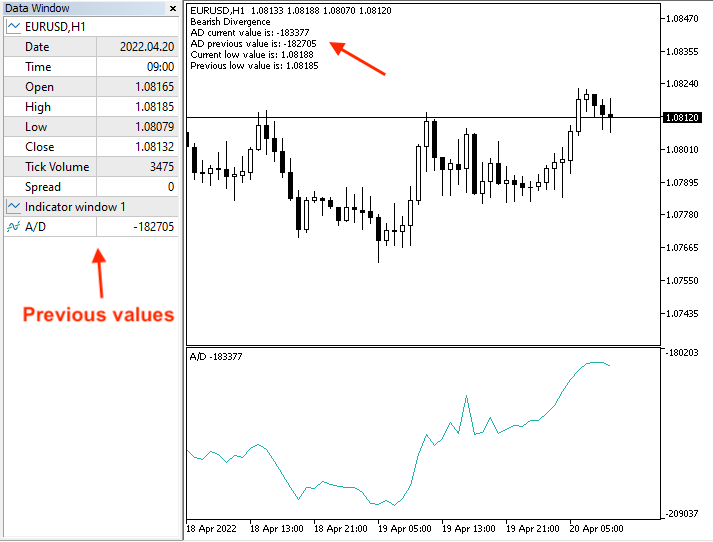
The following is an example of generated signals with a data window of current and previous values:
Strong up move,
Current data:
Previous data:
Bearish divergence,
Current data:
Previous data:
- Strategy four: simple AD - downtrend:
The following is the full code to create a trading system for this strategy:
//+------------------------------------------------------------------+
//|                                        Simple AD - downtrend.mq5 |
//|                                  Copyright 2022, MetaQuotes Ltd. |
//|                                             https://www.mql5.com |
//+------------------------------------------------------------------+
#property copyright "Copyright 2022, MetaQuotes Ltd."
#property link      "https://www.mql5.com"
#property version   "1.00"
//+------------------------------------------------------------------+
void OnTick()
  {
   //creating a string variable for signal
   string signal="";

   //Create two arrays for AD and price
   double ADArray[];
   MqlRates PriceArray[];

   //sorting the two arrays
   ArraySetAsSeries(ADArray,true);
   int Data=CopyRates(_Symbol,_Period,0,3,PriceArray);

   //defining AD
   int ADDef=iAD(_Symbol,_Period,VOLUME_TICK);

   //filling the ADArray with ADDef
   CopyBuffer(ADDef,0,0,3,ADArray);

   //calculating current AD and previous values
   int ADCurrrentValue=NormalizeDouble(ADArray[0],5);
   int ADPrevValue=NormalizeDouble(ADArray[1],5);

   double CurrentLowValue=NormalizeDouble(PriceArray[2].low,5);
   double PrevLowValue=NormalizeDouble(PriceArray[1].low,5);

   //Comparing two values and giving signal
   //Strong down move
   if(ADCurrrentValue < ADPrevValue && CurrentLowValue<PrevLowValue)
   {
      Comment("Strong Down Move During The Downtrend","\n","AD current value is: ",ADCurrrentValue,
      "\n","AD previous value is: ",ADPrevValue,
      "\n","Current low value is: ",CurrentLowValue,
      "\n","Previous low value is: ",PrevLowValue);
   }

   //in case of divergence
   if(ADCurrrentValue > ADPrevValue && CurrentLowValue<PrevLowValue)
   {
      Comment("Bullish Divergence","\n","AD current value is: ",ADCurrrentValue,
      "\n","AD previous value is: ",ADPrevValue,
      "\n","Current low value is: ",CurrentLowValue,
      "\n","Previous low value is: ",PrevLowValue);
   }
  }
//+------------------------------------------------------------------+
The differences in this code are the same:
- Conditions of this strategy and required comments according to this strategy:
- Strong down move:
if(ADCurrrentValue < ADPrevValue && CurrentLowValue<PrevLowValue)
{
 Comment("Strong Down Move During The Downtrend","\n","AD current value is: ",ADCurrrentValue,
 "\n","AD previous value is: ",ADPrevValue,
 "\n","Current low value is: ",CurrentLowValue,
 "\n","Previous low value is: ",PrevLowValue);
}
- Bullish divergence:
if(ADCurrrentValue > ADPrevValue && CurrentLowValue<PrevLowValue)
{
 Comment("Bullish Divergence","\n","AD current value is: ",ADCurrrentValue,
 "\n","AD previous value is: ",ADPrevValue,
 "\n","Current low value is: ",CurrentLowValue,
 "\n","Previous low value is: ",PrevLowValue);
}
After compiling this code, we can find the EA in the Navigator window:
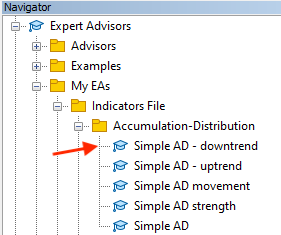
After dragging and dropping it on the chart, its window will appear:
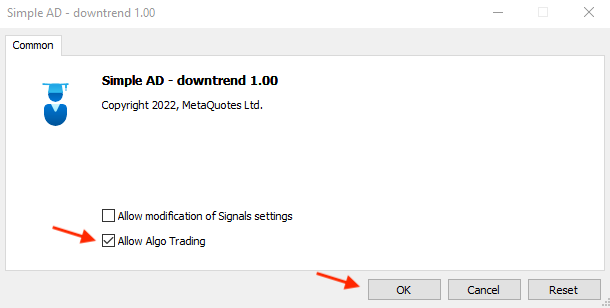
Click OK to attach the EA to the chart:
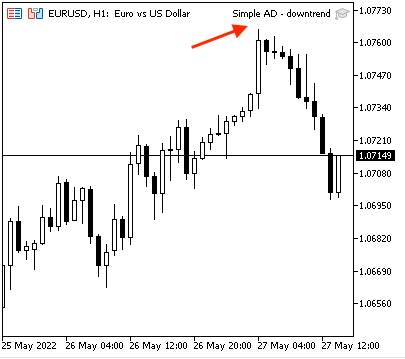
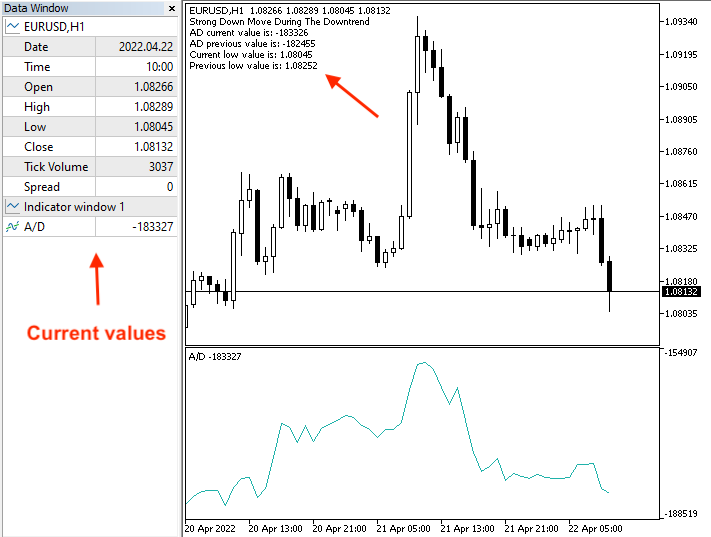
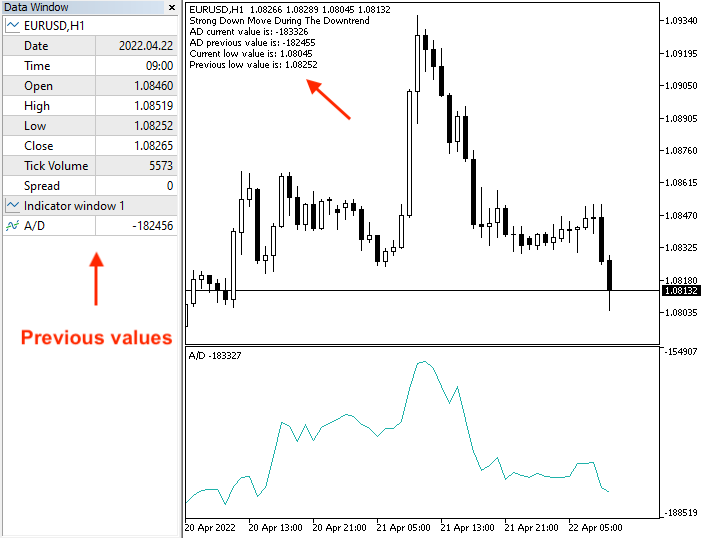
The following is an example of generated signals with data window of the current and previous values according to this strategy,
Strong down move,
Current data:
Previous data:
Bullish divergence,
Current data:
Previous data:
 \
\
Conclusion
In the current article, I have covered the topic of the Accumulation/Distribution (AD) indicator which is one of the volume-based indicators. We learned what is the AD indicator, what it measures and how we can calculate it manually to learn the concept behind it. We found out how we can use the AD indicator in simple strategies. These strategies are: simple AD movement, simple AD strength, simple AD - uptrend, and simple AD - downtrend. Then we designed a blueprint for each strategy to create a trading system for each of them. After that, we learned how to implement a trading system through creating an EA in MQL5 for each strategy to execute them by means of MetaTrader 5 trading platform and saw examples of generated signals for each strategy. The terminal allows us to automate these strategies to generate signals. This is a magnificent feature since it the computer trade for us or at least gives us clear, accurate and quick insights to help us enhance our trading decisions without involving emotions which can be harmful.
It is important to mention again that you must test any strategy before using it on your real account as it may be not useful or suitable for you because there is nothing is suitable for all people or at least you may find that it needs an optimization to get better results. The main objective of this article and others in this series is to learn how to code simple strategies using MQL5 for the most popular technical indicators. I hope, you will apply gained knowledge and try to code by yourself since practice is an important factor of any learning process.
I hope, you have found this article helpful and insightful in regard to the topic or even any related topics. If you want to read more similar articles, you can have a look at my previous articles in this series to learn how to design a simple trading system based on the most popular technical indicators.