The price movement model and its main provisions (Part 1): The simplest model version and its applications
Aleksey Ivanov | 21 July, 2022
Introduction
Up to the present, we have not had any mathematically rigorous price movement theory. Instead, we have had to deal with experience-based assumptions stating that the price moves in a certain way after a certain pattern. Of course, these assumptions have been supported neither by statistics, nor by theory. The article provides the concepts and foundations of the mathematical apparatus of the rigorous theory price movement theory.
Concepts and basic representations of the model
The analytical price movement model is based on 6 main ideas.
1. The financial market is a complex system subject to a wide variety of external factors (important political or economic news, large players entering the market, etc.). Due to the dynamics of affecting factors, the system should be characterized by a time-varying or fundamentally dynamic (non-stationary) state. For the purposes of the current model, we will assume that the current market state is described by the current quotes ![]() , its key instruments
, its key instruments ![]() and their rates
and their rates ![]() . The latter, however, are only approximately estimated from the recent history
. The latter, however, are only approximately estimated from the recent history ![]() , where:
, where:
-
 - the current moment of time,
 -
 - history interval selected to assess the
  quote change velocity.
To collect more or less significant statistics that would allow us to establish the velocities (defined, for example, by the slopes of regression lines) with an insignificant error, we need to increase ![]() , which will create uncertainty of the current moment the calculated parameters refer to. Due to this fact, there is always a fundamental uncertainty in identifying the market status.
, which will create uncertainty of the current moment the calculated parameters refer to. Due to this fact, there is always a fundamental uncertainty in identifying the market status.
Besides, unlike, say, quantum mechanics, we have only one history for each quote and there is no assembly of similar ![]() stories, which could have raised the stats significantly, making the description of the market highly uncertain. It is also clear that all market quotes are interconnected. Therefore,
stories, which could have raised the stats significantly, making the description of the market highly uncertain. It is also clear that all market quotes are interconnected. Therefore, ![]() and
and ![]() describing the market are its generalized coordinates and velocities, i.e. parameters, whose number can be reduced due to their connections.
describing the market are its generalized coordinates and velocities, i.e. parameters, whose number can be reduced due to their connections.
2. Important factors and events do not affect the market directly. There is a huge variety of market participants: central and commercial banks, interbank dealers, currency exchanges, investment funds, brokers, traders, analysts, etc. After receiving information about important events, market participants affect the market status in the context of their understanding of these events, in accordance with the situation that has already developed on the market and, of course, according to their interests.
Generally, the market affects its participants, while participants affect the market. Therefore, the market has numerous sources of feedback. Positive feedback allows small impacts to produce a strong avalanche-like response. On the contrary, negative feedback resists the emergence of such strong responses supporting the market dynamics stability or the inertia of its development.
3. Positive market feedback usually occurs immediately after the market has been affected by strong external random factors causing excitement among its participants. This rapidly changes its state, as well as the values of quotes characterizing it. The intervals ![]() of such changes are very small and non-identifiable at the start of such strong movements. Directions of the movements themselves also cannot be reliably defined based on the nearest history without a delay (by the same
of such changes are very small and non-identifiable at the start of such strong movements. Directions of the movements themselves also cannot be reliably defined based on the nearest history without a delay (by the same ![]() ). To be more precise, they cannot be simulated in the current market theory approximation. Just like physical reality, the market adheres to the Le Chatelier's principle, which states that any impact on the system in the state of equilibrium (in our case, this is a quasi-stable dynamic equilibrium, i.e. passing through close equilibrium states) strengthens processes aimed at counteracting the changes generated by such an impact.
). To be more precise, they cannot be simulated in the current market theory approximation. Just like physical reality, the market adheres to the Le Chatelier's principle, which states that any impact on the system in the state of equilibrium (in our case, this is a quasi-stable dynamic equilibrium, i.e. passing through close equilibrium states) strengthens processes aimed at counteracting the changes generated by such an impact.
Apparently, there are many mechanisms that seek to return the market to its original state, for example, there is a confrontation between “bulls” and “bears”, the desire of banks to keep exchange rates at certain levels, sponsored articles written by analysts backing interests of various groups, etc. All these factors form a negative feedback which starts affecting immediately after strong jumps caused by important events or internal reasons, which will be considered a bit later.
When one of the forces moves the market to a needed level, it "calms down", while the antagonistic force becomes more active. Therefore, such resistance to rapid changes gives rise to quote fluctuations that arise after the market has been taken out of its dynamic equilibrium by some strong third-party or internal (discussed later) influence. Obviously, in accordance with the presence of a whole variety of different mechanisms for returning to the initial state, a whole spectrum of quote fluctuation frequencies will also arise.
Therefore, strong events disturbing the market equilibrium are followed by various quote fluctuations, which gradually fade, since the relevance of the events that caused the movement is lost over time, and an increasing number of market participants gradually shift their activity to other events that occurred later, forming responses to them. Thus, quotes have many modes of ![]() fluctuations, which are characterized by frequencies
fluctuations, which are characterized by frequencies ![]() and attenuation
and attenuation ![]() , as well as the moment of their occurrence
, as well as the moment of their occurrence ![]() .
.
4. The confrontation of opposing forces (such as "bulls" and "bears") that causes quote fluctuations is by no means always fully compensated, and one of these forces often, to one degree or another, prevails over its antagonist, generating an average price drift, or, more precisely, an average statistical drift of the corresponding price fluctuation mode coming along with its ![]() time-based fluctuations. It is this imbalance in the action of the most antagonistic forces that gives rise to the phase velocity
time-based fluctuations. It is this imbalance in the action of the most antagonistic forces that gives rise to the phase velocity ![]() of the appropriate fluctuation mode, which is different for different fluctuation modes and is proportional to the degree of imbalance of the forces generating each mode. Obviously, this phase velocity can take both positive and negative values allowing us to speak about the wave vector
of the appropriate fluctuation mode, which is different for different fluctuation modes and is proportional to the degree of imbalance of the forces generating each mode. Obviously, this phase velocity can take both positive and negative values allowing us to speak about the wave vector ![]() of the appropriate mode
of the appropriate mode ![]() . The presence of frequencies and phase velocities makes it legitimate to consider fluctuation waves that somehow propagate along the price measurement and form a package with their full set for each price. The group velocity of the package will characterize the average movement of the given price.
. The presence of frequencies and phase velocities makes it legitimate to consider fluctuation waves that somehow propagate along the price measurement and form a package with their full set for each price. The group velocity of the package will characterize the average movement of the given price.
5. In the market theory, we, of course, should also take into account that the price at each moment is not a single number. Instead, there are two prices separated by a spread: for buying and selling. For multiple pending orders of a real financial market, they form a market depth, in which each point of the price scale is characterized by the volume of orders placed on it, i.e. we can talk about a certain distribution of trading request probabilities by price measurement.
The market depth expresses the natural balance of supply and demand, and it is this balance that largely determines where the average price will go. After all, if the number of buy limit orders exceeds the number of sell limit ones, the easier it is to sell at a market price (without a slippage), while the average price will go down. Conversely, the more sell volumes exceed buy ones, the easier it is to buy at a market price, while the price will go up, i.e. the price has a tendency to move against the asymmetry of its distribution in the market depth trying to equalize it.
However, due to many other factors affecting the price (apart from the balance of supply and demand, which also has probabilistic nature), its movement is also probabilistic in the sense that it does not clearly determine the future price but instead sets the subsequent distribution of its probabilities, which is characteristic of market prices at all times - past, present and future.
The current prices (supply or demand) that we see on charts are simplified abstract representations of the prices, which in reality are described by much less defined (than price charts) functions. In reality, the price for a particular market participant, which, in fact, is an agreement between a buyer and a seller, can acquire an exact value for this participant only after he has completed a transaction (selling, buying or closing a position by market)
This process has much in common with quantum mechanical reduction of an initially vague state. In our case, this is a price value expanded in the real market (and, moreover, in a dealing center) by an increasing spread, slippage, delays in order execution, which are only visible reflections of the initially distributed price, which in its true form is latent and not displayed on charts. Therefore, the price is objectively described by the probability distribution, and the group of waves, describing the price movement in the form of a model, describes the movement of its distribution.
6. Finally, if we try to exhaustively reveal the ontology of the market functioning, it is possible to track its internal or integral patterns going beyond the scope of all things considered above. Of course, the prices of market instruments are in practice set by market participants introducing subjective elements to the prices. However, the order of price change can be formally described as decomposed into chaotically arising and different in magnitude price jumps. These price jumps, in turn, entail numerous fading waves propagating along the price dimension. This already represents a theoretical model for describing a price movement.
Such modeling becomes possible. Moreover, it becomes more objective due to the presence of a huge number of market participants and their close interconnection in a single system, in which, therefore, statistical patterns of their cumulative action arise. The interaction and actions of individual market participants are in no way characterized by waves in the price dimension. However, in case of the analytical approach, the price waves turn out to be detectable and existing, just like its emergent parameters that formally break away from the activity of the numerous market participants who jointly create them, gaining their own reality.
As a result, such price waves become integral parts of forming the market's own macroscopic dynamics, which does not depend on individual external random influences and the reactions of market participants to them, since it occurs much like statistical patterns. The functioning of such complex non-stationary and unstable systems as the market is described by non-linear equations, which allow multiple (sometimes, sharply different) solutions. Their random change (at the so-called “bifurcation points”) causes re-arrangements expressed in large jumps of the appropriate quotes. In this case, such jumps occur purely to the market's own processes rather than to individual external influences.
Simplest model analytics
So, numerous modes of fading fluctuation waves of a certain symbol quote ![]() caused by different events, which occur at different points in time
caused by different events, which occur at different points in time ![]() and have different strength and genesis, are superimposed on each other giving rise to a complex oscillation
and have different strength and genesis, are superimposed on each other giving rise to a complex oscillation
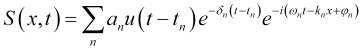 , (1)
, (1)
where
-
 — starting actual amplitude of
  mode oscillation,
 -
 — its fading ratio,
 -
 — mode oscillation frequency,
 -
 — wave vector of its distribution along the
  price scale ,
 -
 — oscillation initial phase,
 - while
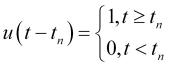 is a single function defining the moment the
  oscillation starts.
Let's introduce the complex amplitude
![]() , (2)
, (2)
which, obviously, is a function decreasing in its absolute value. In this case, the expression for the multimodal oscillation (1) looks simpler
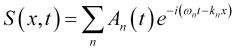 , (3)
, (3)
Considering that the oscillation mode distribution phase velocity is equal to ![]() , the (3) relation looks as follows
, the (3) relation looks as follows
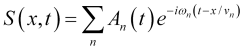 (4)
(4)
Obviously, the price probability density is the square of the modulus of its wave package amplitude (4)
![]() . (5)
. (5)
Note that in the ![]() simplest model provided here, the moments of new strong third-party and internal events, as well as
simplest model provided here, the moments of new strong third-party and internal events, as well as ![]() initial oscillation amplitudes caused by them are considered fundamentally random (although they probably can be predicted with some degree of certainty based on the analysis of the previous quote history). This is why in this model, the interval of predictable market development starts from the last strong event and continues until the next such event.
initial oscillation amplitudes caused by them are considered fundamentally random (although they probably can be predicted with some degree of certainty based on the analysis of the previous quote history). This is why in this model, the interval of predictable market development starts from the last strong event and continues until the next such event.
Let's try to obtain practically useful conclusions while theoretically developing the above model. The group of waves (3) describes the amplitude distribution of the price probability. As shown in p. 5, the price features fundamental uncertainties of both its value and its velocity (p. 1), which is fully consistent with its description by means of the wave package (4), which has uncertainties in time coordinates and frequencies or spatial position and wave vector allowing us to find the uncertainty of its velocity. Let's define relations for the ![]() price and
price and ![]() wave vector uncertanties that arise in this case.
wave vector uncertanties that arise in this case.
The ![]() values of the
values of the ![]() parameter of the multidimensional, in its basic (orthonormal) modes of
parameter of the multidimensional, in its basic (orthonormal) modes of ![]() oscillations, linear oscillating system (oscillations of single modes interfere)
oscillations, linear oscillating system (oscillations of single modes interfere)
![]() (6)
(6)
are found in the standard way for oscillating systems from (characteristic) equations for the proper values of such parameters
![]() , (7)
, (7)
where ![]() are the operators of the corresponding values.
are the operators of the corresponding values.
So, if ![]() describes the price oscillation mode, the price and wave vector operators can be set as
describes the price oscillation mode, the price and wave vector operators can be set as ![]() and
and  , which will satisfy their equations (7). The uncertainty of
 ![]() is defined by its root-mean-square fluctuations
is defined by its root-mean-square fluctuations
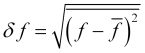 . (8)
. (8)
Since ![]() of the
of the ![]() state probability amplitude and
state probability amplitude and ![]() values of the
values of the ![]() parameter, then the average value of this parameter
parameter, then the average value of this parameter
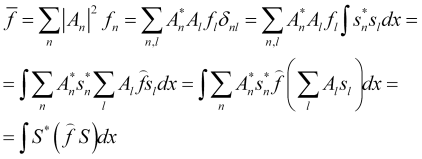 . (9)
. (9)
It is clear that (9) is true under the normalization condition
![]() . (10)
. (10)
Obviously, for any real ![]()
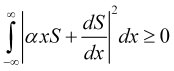 (11)
(11)
Expanding the integrand, we get
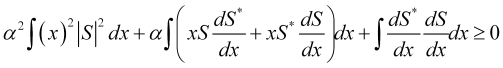 . (12)
The first integral in this expression is the square of the price uncertainty ![]() . The second integral turns out to be a constant due to the normalization of the price probability amplitude
. The second integral turns out to be a constant due to the normalization of the price probability amplitude
 . (13)
The third one expresses the square of the wave number uncertainty
 . (14)
The ratios (12-14) and squared price uncertainty, together, provide the inequality
![]() . (15)
. (15)
The inequality (15) is satisfied in case of any real ![]() , when the discriminant of the corresponding quadratic equation is negative, which gives an expression for the uncertainties of the price and its wave vector. Writing the expression for the discriminant, we obtain the ratio of the price uncertainty and its wave vector
, when the discriminant of the corresponding quadratic equation is negative, which gives an expression for the uncertainties of the price and its wave vector. Writing the expression for the discriminant, we obtain the ratio of the price uncertainty and its wave vector
 . (16)
Minimizes the ratio (16) of the Gaussian modulated sinusoid
 . (17)
The ratio (17) is important for practice since it provides us with the expression for the wavelet function (Morlet wavelet) allowing us to efficiently (or with the least error) decompose the price series for its extrapolation.
Practical applications of the simplest model
Forecasting the price movement using the equation (4) is problematic and unreliable, due to the difficulty of identifying the parameters present in it, the presence of fundamentally irremovable uncertainties in the parameters and, most importantly, due to frequent unpredictable (according to the simplest model) strong random jumps. Fortunately, oscillators are able to sort these large unpredictable jumps and have predictive power. However, they have one extremely significant drawback, which is a lag inherent in all moving averages those oscillators are based on. Therefore, along with direct price forecasting, it might be even more promising to arrange the forecasting of such indicators, which eliminates their lag.
The package of oscillations (4) is sorted by oscillators in order to avoid strong jumps and features the same rapid fading of its spectral components, so the readings of such indicators are best extrapolated by certain, also rapidly decreasing, wavelet functions. For the most adequate decomposition of market processes into a spectrum, we need wavelet functions expressing the characteristic features of these processes, which are revealed from the following.
Generally speaking, the market price always moves in jumps forming its main movement. Find out more details in the blog "True and illusory currency market trends". Price jumps are visually revealed by Probabilities distribution of price indicator.
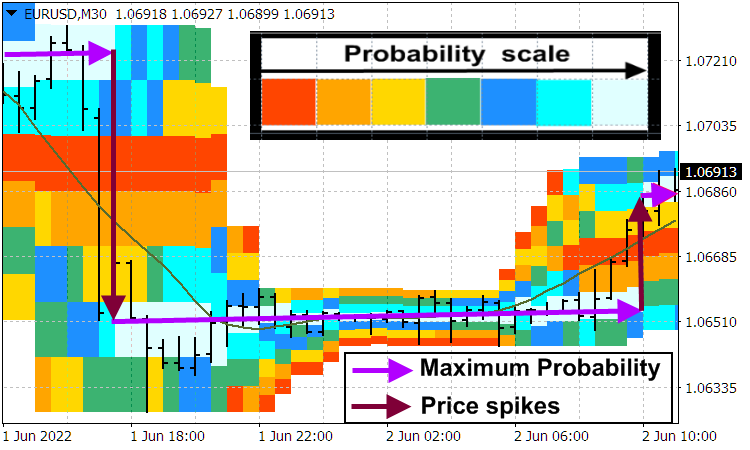
Suppose that the price jumps upwards from the ![]() level up to
level up to ![]() . After the avalanche-like price jump and the beginning of its slowdown, many traders who managed to open on such a trend close their positions, which leads to a sharp rollback in the opposite direction to a new price low
. After the avalanche-like price jump and the beginning of its slowdown, many traders who managed to open on such a trend close their positions, which leads to a sharp rollback in the opposite direction to a new price low ![]() . Then the price fluctuations gradually relax and the average price is established approximately in the
. Then the price fluctuations gradually relax and the average price is established approximately in the ![]() area, which it quickly crosses after its negative surge (rollback). The oscillator sorts the
area, which it quickly crosses after its negative surge (rollback). The oscillator sorts the ![]() jump and reflects the fading price fluctuation with the
jump and reflects the fading price fluctuation with the ![]() initial amplitude near the
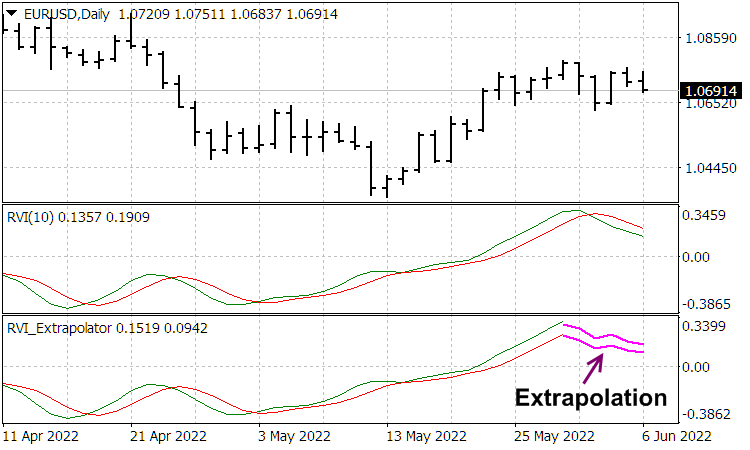
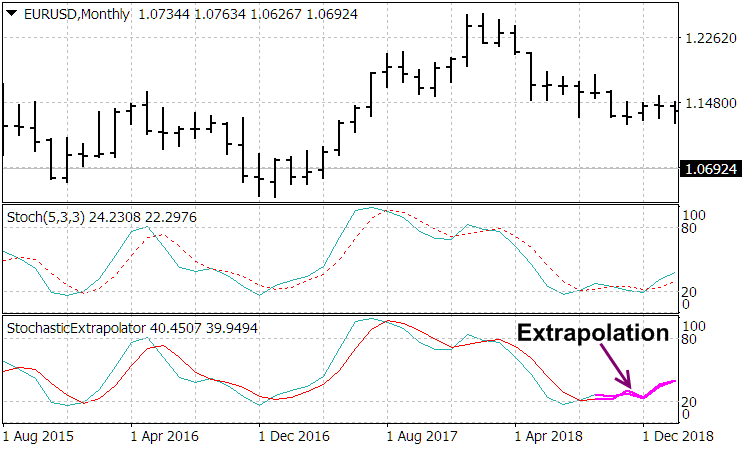
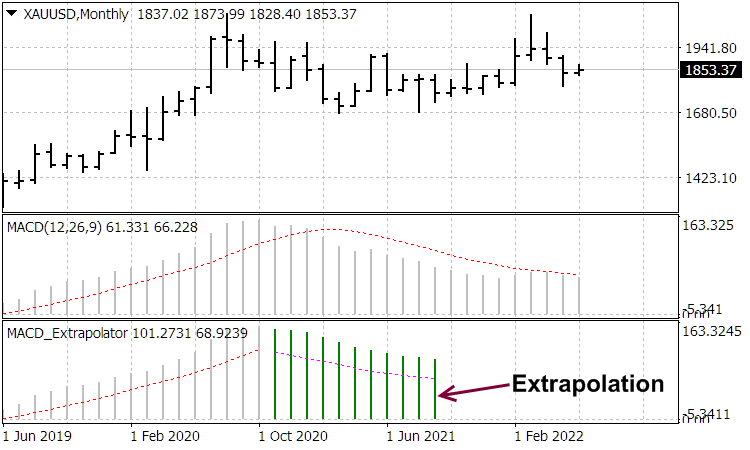
initial amplitude near the ![]() level, with respect to which, at first, a sharp positive surge occurs, and then a negative rebound follows generating an anti-symmetric function consisting of two differently directed sharp peaks. The time constant of the indicator acting as a filter expands such peaks. The pair of such peaks, together with subsequent relaxing price fluctuations, forms anti-symmetric wavelet functions used to conveniently decompose the readings of the appropriate oscillator. The corresponding extrapolator indicators are provided by the author in the "Wavelet extrapolation of oscillator indicators" blog article.
level, with respect to which, at first, a sharp positive surge occurs, and then a negative rebound follows generating an anti-symmetric function consisting of two differently directed sharp peaks. The time constant of the indicator acting as a filter expands such peaks. The pair of such peaks, together with subsequent relaxing price fluctuations, forms anti-symmetric wavelet functions used to conveniently decompose the readings of the appropriate oscillator. The corresponding extrapolator indicators are provided by the author in the "Wavelet extrapolation of oscillator indicators" blog article.
The work of these indicators cab be assessed in the following screenshots
Conclusion
The article provided the basic principles of price formation and market functioning. It was proven that the price may be formed not only by the interaction of market participants but also due to internal emergent wave-like market processes arising due to the huge number of these participants. Besides, the article provides some analytical basics of these emergent processes and comes up with the approach to forecasting them. The next article will provide the mathematical apparatus of optimal trading developed using the analytics.