Learn how to design a trading system by ADX
Mohamed Abdelmaaboud | 29 April, 2022
Introduction
This article will present a new technical trading tool, which is one of the most useful and meaningful tools that can help us to trade better and understand the market movement. Because one of the most useful features of technical indicators is that they can show us what prices can't show and this will be based on the calculation for every indicator, one of these useful indicators is the average directional index (ADX) indicator. We will learn this indicator in detail to understand it well and learn how we can use it simply through a simple strategy because when we learn something deeply we will be able to get more insights and we can use it better.
We will learn that through the following topics:
Through the ADX definition topic, we will discuss in detail what is the average directional index (ADX) indicator and what it measures, and how we can calculate it manually to be able to understand it deeply and to be able to use it profitably. Then after understanding well the indicator and how it works we will learn a simple strategy that can be used in our trading and this will be known after the topic of ADX strategy. And then in the topic of ADX strategy blueprint we will learn how to design a blueprint to help us to write it as a code to design a trading system for this strategy. Then we will learn how to write a trading system using this strategy and this will be through the topic of ADX trading system.
We will use the MetaTrader 5 trading platform and MetaQuotes Language editor that is built-in with MetaTrader 5 and you can download it by the following link: https://www.metatrader5.com/en/download
After downloading and installing the MetaTrader 5, you will find it the same as the following picture for the trading platform:

I advise you to apply everything in this article by yourself as it will develop your skills quickly and it gives you a deep understanding of the topic. Practice is an important key for any development. So, it will be better to try to apply every concept and test it by yourself, because we will learn how to design a trading system using a technical tool and we will do that by MQL5 by writing some codes to create an expert advisor or program to help us to trade well. It will be essential also to have a demo account to test and apply and you can do that if you do not know by opening a demo account through the MetaTrader 5 itself by Pressing the File tab from the MetaTrader 5 terminal --> Open an Account --> you can enter the name of you broker to open this demo account though him or choose MetaQuotes --> Next --> Choose Open a demo account to trade virtual money without risk --> Next --> enter your data and determine the account requirements then tick next to I agree --> Next --> then you will find your demo account credentials --> Finish.
You can now use this account to trade virtually by opening it by clicking on the File tab --> Login to Trade Account --> enter your demo account credentials and press OK.
Disclaimer: All information 'as is' only for educational purposes and is not prepared for trading purposes or advice. all information does not guarantee any kind of result. If you choose to use these materials on any of your trading accounts, you will do that at your own risk and you will be the only responsible.
Now, let us start learning a new tool that can be making a difference in our trading results to be better.
ADX definition
In this part, we will talk about one of the most popular indicators in the technical trading world in detail to know what it is, what it measures, and how we can calculate it to be able to understand it well then we can use it well by the available strategies or even with new ideas around it. This indicator is the average directional index (ADX), it was developed by Welles Wilder and it measures the trend and confirms if there is a trend or not because according to its calculation, it compares the trading range for one period with the trading range for the previous period.
As a result of this comparison, we can find that we have:
- An advance or decline (positive directional movement or negative directional movement).
- No advance or decline.
- Advance and decline.
If there is a positive directional movement, it means that the high of a period exceeded the high of the previous period and its symbol is (+DM).
The following picture shows us how it can be on the chart by the price action:

And vice versa, if there is a negative directional movement, it means that the low of a period exceeded the low of the previous period and its symbol is (-DM).
The following picture shows us how it can be on the chart by the price action:

If we do not have positive directional movement and we do not have negative directional movement, this means that the high did not exceed the previous high and the low did not exceed the previous low.
The following picture shows us how it can be on the chart by the price action:

If we have both Positive directional movement and negative directional movement, it means that the high exceeded the previous high and the low exceeded the previous low.
The following picture shows us how it can be on the chart by the price action:

Let us know how we can calculate it as it will give us more insights. So, the following are the steps to calculate (ADX) and you have to be noted that all values must be absolute:
1- Calculate +DM and -DM:In this step, we need to determine if there is a movement up or down for the current movement compared with the previous. So, we will calculate two things:
- (+DM) refers to positive directional movement if there is an upward movement.
It will be calculated by (+DM = current high - previous high)
- (-DM) refers to negative directional movement if there is a downward movement.
It will be calculated by (-DM = current low - previous low)
So, we will check every calculated period and check if it is +DM, -DM, or anything else.
- If we have +DM, so:
+DM=n
-DM = 0
- If we have -DM, so:
-DM = n
+DM = 0
In some cases, we can find other scenarios where there are no values for (+DM and-DM) or we can find values for both(+DM and-DM), and the following is how we can deal with that:
- If we have no (+DM and-DM), so:
+DM = 0
-DM = 0

- If we have both (+DM and-DM), so, we will compare between +DM and -DM and take consider the biggest value or will be ignored if there are values equal to each other:
+DM>-DM = +DM only will be considered,

2- Calculate the True Range(TR):+DM<-DM = -DM only will be considered
+DM=-DM = both will be ignored


In this step and after calculating DM, we will calculate the (TR) and it will be the largest value from the following:
- The difference between current high and low.
- The difference between the current high and the previous close.
- The difference between the current low and the previous close.
After calculating the first 14 period of calculated (+DM,-DM, and TR), we will use the following formulas to calculate the following values after 14:
4- Calculate 14 period +DI and-DI+DM 15 = (previous +DM - (previous +DM/14)) + current +DM
-DM 15 = (previous -DM - (previous -DM/14)) + current -DM
TR 15 = (previous TR - (previous TR/14)) + current TR
+DI 14 = 100*(+DM14/TR14)
-DI 14 = 100*(-DM14/TR14)
5- Calculate the difference between +DI and -DI
DI 14 Diff = (+DI 14) - (-DI 14)
6- Calculate the sum of +DI and -DI
DI 14 Sum = (+DI 14) + (-DI 14)
7- Calculate DX
DX = 100*((difference between +DI and -DI)/(sum of +DI and -DI))8- Calculate ADX
ADX = average 14 period of DX
By the previous steps we can calculate the ADX and now let us see an example to apply these steps, if we have the following data:
| Day | High | Low | Close |
|---|---|---|---|
| 1 | 110 | 90 | 100 |
| 2 | 140 | 120 | 130 |
| 3 | 160 | 120 | 140 |
| 4 | 150 | 110 | 130 |
| 5 | 140 | 100 | 130 |
| 6 | 150 | 130 | 140 |
| 7 | 170 | 150 | 160 |
| 8 | 180 | 160 | 170 |
| 9 | 170 | 150 | 155 |
| 10 | 170 | 130 | 140 |
| 11 | 180 | 155 | 160 |
| 12 | 190 | 175 | 180 |
| 13 | 220 | 190 | 190 |
| 14 | 230 | 200 | 200 |
| 15 | 215 | 205 | 210 |
| 16 | 200 | 190 | 200 |
| 17 | 195 | 180 | 190 |
| 18 | 195 | 180 | 185 |
| 19 | 210 | 185 | 195 |
| 20 | 220 | 190 | 200 |
| 21 | 233 | 195 | 208 |
| 22 | 246 | 200 | 216 |
| 23 | 258 | 205 | 223 |
| 24 | 271 | 210 | 231 |
| 25 | 283 | 215 | 238 |
| 26 | 296 | 220 | 246 |
| 27 | 308 | 225 | 253 |
| 28 | 321 | 230 | 261 |
| 29 | 333 | 235 | 268 |
| 30 | 346 | 240 | 276 |
Let us calculate the ADX for the previous data:
1- Calculate +DM and -DM:
+DM = current high - previous high
-DM = current low - previous low

2- Calculate the TR:
It will be the largest value from the following:
- The difference between current high and low.
- The difference between the current high and the previous close.
- The difference between the current low and the previous close.
The following picture is for TR after calculating it:

3- Calculate the sum of 14 periods calculated +DM, -DM, and TR:
+DM 14 = Sum +DM 1(day 2: day 15)
-DM 14 = Sum -DM 1(day 2: day 15)
TR 14 = Sum TR (day 2: day 15)

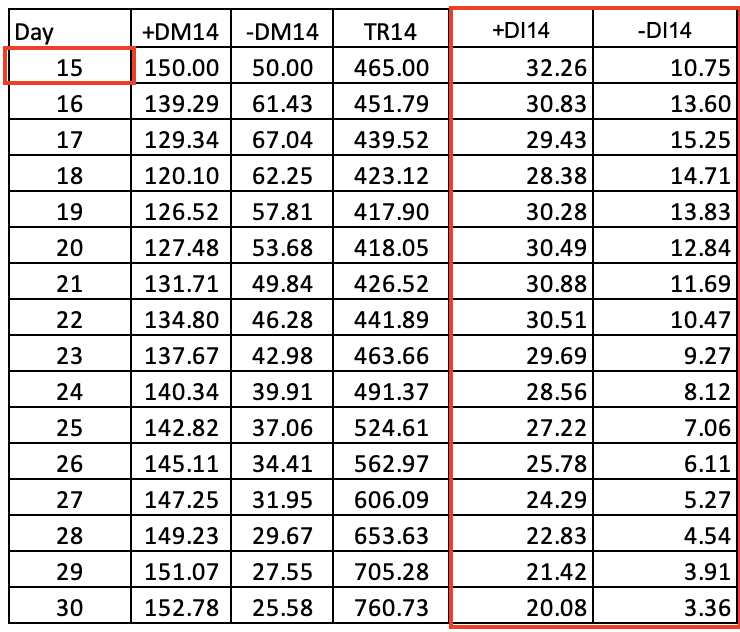
4- calculate 14 period +DI and-DI and the first calculation will be from the 15th day as we need 14 DM to calculate 14 DI:
+DI14 = 100*(+DM14/TR14)
-DI14 = 100*(-DM14/TR14)
5- Calculate the difference between +DI and -DI
DI 14 Diff = (+DI 14) - (-DI 14)
6- Calculate the sum of +DI and -DI
DI 14 Sum = (+DI 14) + (-DI 14)

7- Calculate DX:
DX = 100*((difference between +DI and -DI)/(sum of +DI and -DI))

8- Calculate ADX and the first calculation will be the of 28 as we need more 14 days to calculate ADX:
ADX = average 14 period of DX --> average DI (day 15: day 28)

Now, we calculated the ADX indicator manually but we do not need to do that as it is built-in with the MetaTrader 5, we only learned how to we can calculate it to deepen our understanding of the ADX indicator and how it works. If we need to insert it into the chart all that we need to do is to choose it among the available indicators in the trading terminal, by (Insert --> Indicator --> Trend --> Average Directional Movement Index) and the following is for you to know how we can do that:

After choosing "Average Directional Movement Index" the following window will appear:

- to determine the desired period.
- to determine the color of ADX line.
- to determine the type of ADX line.
- to determine the thickness of ADX line.
- to determine the color of +DI line.
- to determine the type of +DI line.
- to determine the thickness of +DI line.
- to determine the color of -DI line.
- to determine the type of -DI line.
- to determine the thickness of -DI line.
After determining the ADX parameters and press OK, it will be attached to the chart and the following picture is for an example for that:

ADX strategy
In this part, we will see simple strategies that can be used by the ADX indicator and I like to mention here that we only present some simple strategies for the ADX indicator and you have to know that there are many strategies that can be used by the ADX from simple to complicated strategies but through this article, we just mention simple strategies to understand the concept behind the indicator and learn how to design a trading system based on the concept behind it.
Based on the concept behind the calculation of the ADX indicator, it shows if there is a trend or not whatever this kind of trend (up or down), if the ADX curve is moving up, this means that there is a trend and vice versa if the ADX curve is moving down, this means that there is no trend. But first we need to define the trend and it will the same as the following:
Trend definition:
For your info, the price action is very important that it shows us the trend type as the same as we know that we have three types of trends (uptrend, downtrend, and sideways).
Uptrend: It is the market direction or the trend that we can see prices create higher lows and higher highs, prices move up, and buyers control the market in this market movement.
The following picture is the formation of this market direction or trend:

The following picture is an example from the market for the uptrend:

Downtrend: It is the market direction or trend as we can see prices create lower highs and lower lows, prices move down, and sellers control the market in this market movement.
The following is the formation of this market direction or trend form:

The following picture is an example of the downtrend in the market:

Sideways: It is any market direction except Uptrend or downtrend, where there is no clear direction, and there is a balance between buyers and sellers.
The following are some formations of this market direction:


The following is an example of sideways from the market:

After the identification of trends, we will see simple strategies that can be used according to the concept of the ADX.
- Strategy one: Simple ADX System - ADX movement:
The strategy is based on the movement of the ADX curve,
current ADX value > previous ADX value = ADX is rising.
current ADX value < previous ADX value = ADX is falling.
- Strategy two: Simple ADX System - Uptrend:
According to this strategy, during the uptrend,
ADX value > 25 and current ADX value > previous ADX value --> when +DI value > -DI value = buy
- Strategy three: Simple ADX System - Downtrend:
According to this strategy, during the downtrend,
ADX value > 25 and current ADX value > previous ADX value --> when +DI value < -DI value = sell
ADX strategy blueprint
In this part, we will design a blueprint for each strategy to help us to create the trading system, and this blueprint will organize and set what we need the program or the system to do step by step.
- Strategy one: Simple ADX System - ADX movement:
According to this strategy, we need the program every tick to check the current ADX value and the previous ADX value and then decide if the current ADX value is greater than the previous ADX value or not, if the current ADX is greater than the previous value then we need the system to appear a comment on the chart with "ADX is rising", "ADX Value is (n)" in a new line, and "ADX Value last is (n)" in another new line. If the current ADX value is less than the previous ADX then we need the system to appear a comment on the chart with "ADX is falling" If the current ADX is equal to the previous we need the system to do nothing.
The following picture is a blueprint for this strategy:

- Strategy two: Simple ADX System - Uptrend:
According to this strategy we need the system to check every tick the current ADX value, previous ADX value, +DI value, and -DI value then we need it to decide if the current ADX value is greater than 25 and the previous ADX value or not. If it is not greater than both we need the system to do nothing, If it is greater than both of them then we need the system to check +DI and -DI, If +DI is greater than -DI or not, If +DI is greater than -DI, we need the system to comment with a buy signal, ADX Value is (n), ADX Value last is (n), +DI Value is (n), and -DI Value is (n) or if +DI is not greater than -DI we need the system to do nothing.
The following picture is for a blueprint for this strategy:

- Strategy three: Simple ADX System - Downtrend:
According to this strategy we need the system to check every tick the current ADX value, previous ADX value, +DI value, and -DI value then we need it to decide if the current ADX value is less than 25 and the previous ADX value or not. If it is not less than both we need the system to do nothing, If it is less than both of them then we need the system to check +DI and -DI, If +DI is less than -DI or not, If +DI is less than -DI, we need the system to comment with a sell signal, ADX Value is (n), ADX Value last is (n), +DI Value is (n), and -DI Value is (n) or if +DI is not less than -DI we need the system to do nothing.
The following picture is for a blueprint for this strategy:

ADX trading system
In this most interesting part, we will know how to create a trading system for these mentioned simple strategies to use them in the MetaTrader 5 trading terminal and we will use the built-in MetaQuotes Language Editor (MQL5) to write the code of this trading system and to open this MetaQuotes Language Editor while opening the MetaTrader 5 trading terminal, you can press F4 to open it or click on Tools tab from the MetaTrader 5 --> then select MetaQuotes Language Editor.
The following picture is to show how to do that:

Or you can press on IDE button:

After that the following window for MetaQuotes Language Editor will be opened:

Then we will open a new file to create our trading system by clicking on "New":

Then the following window will be opened:

The following are options for the kind of the new file:
- Expert Advisor: EA is a program in the terminal to automate trading processes according to predetermined conditions.
- Custom Indicator: this is a program code to help us read the chart for improving trading decisions.
- Script: is a program that can perform one task one time only after execution.
Now, we will choose to create an Expert Advisor EA file to create our trading system.
First, we will create a program that can appear as a comment on the chart with the current ADX value and the following are the steps to do that:
- Create a price array and we will use the "double" function that is represent values with a fractional part:
double PriceArray[]; - Sort this created price array from the current data and we will use the "ArraySetAsSeries" function, it returns true on success or false on failure (bool). Its required parameters are:
array[] by reference, and flag
ArraySetAsSeries(PriceArray,true);
- Identifying the ADX indicator and we will use the "iADX" function, it returns the handle of the ADX technical indicator and its parameters are:
symbol as a string, period for the time frame, and period for the ADX period and they will be the same as the following:
- _Symbol: for the current symbol
- _Period: for the current timeframe
- 14: for the period
int ADXDef = iADX(_Symbol,_Period,14);
- Filling data according to created ADX indicator and we will use the "CopyBuffer" function, which returns the copied data count or returns -1 in case of an error. Its parameters are:
indicator handle, buffer_num of indicator buffer number, start_time (start date and time), stop_time (end date and time), and buffer[] (target array).
CopyBuffer(ADXDef,0,0,3,PriceArray);
- Getting the value of ADX, after creating a variable for "ADXValue" with the "double" function then we will use the function "NormalizeDouble" and it returns a double type value with preset accuracy, its parameters are:
value as a double (normalized number) and digits as an integer (number of digits after the decimal point)
double ADXValue=NormalizeDouble(PriceArray[0],2);
- Appearing a comment with the current ADX value and we will use the "comment" function and its parameters are:
Any values and we separate by commas between them and when we need to appear some of them in a new line, we will use a line break symbol "\n"
Comment("ADX Value is ", ADXValue);
If you want to see the full code of this program you can see it through the following:
//+------------------------------------------------------------------+
//|                                            Simple ADX System.mq5 |
//|                                  Copyright 2022, MetaQuotes Ltd. |
//|                                             https://www.mql5.com |
//+------------------------------------------------------------------+
#property copyright "Copyright 2022, MetaQuotes Ltd."
#property link      "https://www.mql5.com"
#property version   "1.00"
//+------------------------------------------------------------------+
void OnTick()
  {
//creating an array for prices
   double PriceArray[];

//sort price array from current data
   ArraySetAsSeries(PriceArray,true);

//identify ADX
   int ADXDef = iADX(_Symbol,_Period,14);

//Filling data according to created ADX
   CopyBuffer(ADXDef,0,0,3,PriceArray);

//Getting value of current data
   double ADXValue=NormalizeDouble(PriceArray[0],2);

//Comment with ADX value
   Comment("ADX Value is ", ADXValue);
  }
//+------------------------------------------------------------------+
After writing this program we can see this program file in the navigator window of the MetaTrader 5 trading terminal and the following is to show that:

After double click on the file or dragging and dropping it on the chart, the following window will appear:

After ticking next to "Allow Algo Trading" and pressing OK button, the file will be attached to the chart:

Then, the result according to this trading system will appear and the following picture is an example of that:

Now, we created what helps to appear the value of the current ADX value, then we need to add something that will help us to design our trading system we need to code a program that helps to appear other values of ADX indicator (+DI value, and -DI value) and the following is for how to do that:
- Creating price array for each value (ADX value, +DI, and -DI) and creating variables for them by using the "double" function:
- ADXArray: for ADX value
- PDIArray: for +DI value
- NDIArray: for -DI value
double ADXArray[];
double PDIArray[];
double NDIArray[];
- Sorting every price array for each value from current data by using the "ArraySetAsSeries" function:
ArraySetAsSeries(ADXArray,true);
ArraySetAsSeries(PDIArray,true);
ArraySetAsSeries(NDIArray,true);
- Identifying the ADX indicator by using the "iADX" function:
int ADXDef = iADX(_Symbol,_Period,14);
- Filling data according to identified ADX by using the "CopyBuffer" function:
CopyBuffer(ADXDef,0,0,3,ADXArray);
CopyBuffer(ADXDef,1,0,3,PDIArray);
CopyBuffer(ADXDef,2,0,3,NDIArray);
- Getting values of current data, after creating variables for each value by using the "double" function, we will use the "NormalizeDouble: function:
double ADXValue=NormalizeDouble(ADXArray[0],2);
double PDIValue=NormalizeDouble(PDIArray[0],2);
double NDIValue=NormalizeDouble(NDIArray[0],2);
- Appearing comments with each value in a new line by using the "comment" function:
Comment("ADX Value is ", ADXValue,"\n""+DI Value is ",
PDIValue,"\n""-DI Value is ", NDIValue);
The following is the full code for this expert advisor:
//+------------------------------------------------------------------+
//|                                  Simple ADX System - 3 lines.mq5 |
//|                                  Copyright 2022, MetaQuotes Ltd. |
//|                                             https://www.mql5.com |
//+------------------------------------------------------------------+
#property copyright "Copyright 2022, MetaQuotes Ltd."
#property link      "https://www.mql5.com"
#property version   "1.00"
//+------------------------------------------------------------------+
void OnTick()
  {
   //creating an array for prices
   double ADXArray[];
   double PDIArray[];
   double NDIArray[];

   //sort price array from current data
   ArraySetAsSeries(ADXArray,true);
   ArraySetAsSeries(PDIArray,true);
   ArraySetAsSeries(NDIArray,true);

   //identify ADX
   int ADXDef = iADX(_Symbol,_Period,14);


   //Filling data according to created ADX
   CopyBuffer(ADXDef,0,0,3,ADXArray);
   CopyBuffer(ADXDef,1,0,3,PDIArray);
   CopyBuffer(ADXDef,2,0,3,NDIArray);

   //Getting value of current data
   double ADXValue=NormalizeDouble(ADXArray[0],2);
   double PDIValue=NormalizeDouble(PDIArray[0],2);
   double NDIValue=NormalizeDouble(NDIArray[0],2);

   //Comment with ADX value
   Comment("ADX Value is ", ADXValue,"\n""+DI Value is ",
   PDIValue,"\n""-DI Value is ", NDIValue);
  }
//+------------------------------------------------------------------+
After writing this program we can find its file in the Navigator window:

After double-clicking on the file or dragging and dropping it on the chart the following window will appear:

After ticking next to "Allow Algo Trading" and pressing OK, the program will be attached to the chart:

After that, values will appear on the chart as per this expert advisor:

Now, we will create our trading system for our mentioned strategies (ADX movement, Uptrend, and Downtrend).
- Strategy one: Simple ADX System - ADX movement:
Current ADX value > previous ADX value = ADX is rising.
Current ADX value < previous ADX value = ADX is falling.
The following is to write the code of the program or expert advisor that can do that:
- Creating price array for ADX values (current, previous):
- ADXArray0: for the current ADX value.
- ADXArray1: for the previous ADX value.
double ADXArray0[];
double ADXArray1[];
- Sorting price array from the current data:
ArraySetAsSeries(ADXArray0,true);
ArraySetAsSeries(ADXArray1,true);
- Identifying the ADX:
int ADXDef = iADX(_Symbol,_Period,14);
- Filling data according to the ADX:
CopyBuffer(ADXDef,0,0,3,ADXArray0);
CopyBuffer(ADXDef,0,0,2,ADXArray1);
- Getting values after creating variables for them:
double ADXValue=NormalizeDouble(ADXArray0[0],2);
double ADXValuelast=NormalizeDouble(ADXArray1[1],2);
- Setting conditions of ADX movement according to the ADX value:
if (ADXValue>ADXValuelast)
      {
       Comment("ADX is rising","\n""ADX Value is ", ADXValue,"\n""ADX Value last is ",
   ADXValuelast);
      }

if (ADXValue<ADXValuelast)
     {
      Comment("ADX is falling","\n""ADX Value is ", ADXValue,"\n""ADX Value last is ",
   ADXValuelast);
      }
The following is the full code for this strategy to create the expert advisor:
//+------------------------------------------------------------------+
//|                             Simple ADX System - ADX Movement.mq5 |
//|                                  Copyright 2022, MetaQuotes Ltd. |
//|                                             https://www.mql5.com |
//+------------------------------------------------------------------+
#property copyright "Copyright 2022, MetaQuotes Ltd."
#property link      "https://www.mql5.com"
#property version   "1.00"
//+------------------------------------------------------------------+
void OnTick()
  {
   //creating an array for prices
   double ADXArray0[];
   double ADXArray1[];

   //sort price array from current data
   ArraySetAsSeries(ADXArray0,true);
   ArraySetAsSeries(ADXArray1,true);

   //identify ADX
   int ADXDef = iADX(_Symbol,_Period,14);

   //Filling data according to created ADX
   CopyBuffer(ADXDef,0,0,3,ADXArray0);
   CopyBuffer(ADXDef,0,0,2,ADXArray1);

   //Getting value of current data
   double ADXValue=NormalizeDouble(ADXArray0[0],2);
   double ADXValuelast=NormalizeDouble(ADXArray1[1],2);

   //ADX movement signal
   if (ADXValue>ADXValuelast)
      {
         Comment("ADX is rising","\n""ADX Value is ", ADXValue,"\n""ADX Value last is ",
   ADXValuelast);
      }

   if (ADXValue<ADXValuelast)
     {
         Comment("ADX is falling","\n""ADX Value is ", ADXValue,"\n""ADX Value last is ",
   ADXValuelast);
      }
  }
//+------------------------------------------------------------------+
After creating this expert advisor, we can find it in the Navigator window:

After double-clicking or dragging and dropping it on the chart, the following window will appear:

After ticking next to "Allow Algo Trading" and pressing the OK button, the EA will be attached to the chart:

After that it can perform according to its conditions and the following are examples of results from testing:
- When the ADX is rising, we can see the expert advisor appear values as comments like the same as the following picture:

- When the ADX is falling, we can see the expert advisor appear values as comments like the same as the following picture:

- Strategy two: Simple ADX System - Uptrend:
ADX value > 25 and current ADX value > previous ADX value --> when +DI value > -DI value = buy
The following is for how to create an expert advisor to execute this strategy:
- Creating a variable for the "signal" with an empty assignment because it will be calculated after that, we will use the "string" function:
string signal="";
- Creating arrays for current ADX value, previous ADX value, +DI value, and -DI value:
- ADXArray0: for current ADX value
- ADXArray1: for previous ADX value
- PDIArray: for +DI value
- NDIArray: for -DI value
double ADXArray0[];
double ADXArray1[];
double PDIArray[];
double NDIArray[];
- Sorting price arrays from current data:
ArraySetAsSeries(ADXArray0,true);
ArraySetAsSeries(ADXArray1,true);
ArraySetAsSeries(PDIArray,true);
ArraySetAsSeries(NDIArray,true);
- Identifying the ADX indicator:
int ADXDef = iADX(_Symbol,_Period,14);
- Filling data according to the created ADX:
CopyBuffer(ADXDef,0,0,3,ADXArray0);
CopyBuffer(ADXDef,0,0,2,ADXArray1);
CopyBuffer(ADXDef,1,0,3,PDIArray);
CopyBuffer(ADXDef,2,0,3,NDIArray);
- Getting values of the current data:
double ADXValue=NormalizeDouble(ADXArray0[0],2);
double ADXValueLast=NormalizeDouble(ADXArray1[1],2);
double PDIValue=NormalizeDouble(PDIArray[0],2);
double NDIValue=NormalizeDouble(NDIArray[0],2);
- Setting conditions of the uptrend strategy:
if (ADXValue>25&&ADXValue>ADXValueLast)
   if(PDIValue>NDIValue)
   {
    signal = "BUY";
   }
- Comment with the buy signal and values and each one in a new line:
Comment("Simple ADX System - Signal is ",signal,"\n""ADX Value is ", ADXValue,
"\n""ADX Value Last is ", ADXValueLast, "\n""+DI Value is ", PDIValue,
"\n""-DI Value is ", NDIValue);
The following is the full code for this strategy to create the expert advisor:
//+------------------------------------------------------------------+
//|                     Simple ADX System - Uptrend - Buy Signal.mq5 |
//|                                  Copyright 2022, MetaQuotes Ltd. |
//|                                             https://www.mql5.com |
//+------------------------------------------------------------------+
#property copyright "Copyright 2022, MetaQuotes Ltd."
#property link      "https://www.mql5.com"
#property version   "1.00"
//+------------------------------------------------------------------+

void OnTick()
  {

   // creating a variable for signal
   string signal="";

   //creating an array for prices
   double ADXArray0[];
   double ADXArray1[];
   double PDIArray[];
   double NDIArray[];

   //identify ADX, positive DI, negative DI
   int ADXDef = iADX(_Symbol,_Period,14);


   //sort price array from current data
   ArraySetAsSeries(ADXArray0,true);
   ArraySetAsSeries(ADXArray1,true);
   ArraySetAsSeries(PDIArray,true);
   ArraySetAsSeries(NDIArray,true);

   //Filling data according to created ADX
   CopyBuffer(ADXDef,0,0,3,ADXArray0);
   CopyBuffer(ADXDef,0,0,2,ADXArray1);
   CopyBuffer(ADXDef,1,0,3,PDIArray);
   CopyBuffer(ADXDef,2,0,3,NDIArray);

   //Getting value of current data
   double ADXValue=NormalizeDouble(ADXArray0[0],2);
   double ADXValueLast=NormalizeDouble(ADXArray1[1],2);
   double PDIValue=NormalizeDouble(PDIArray[0],2);
   double NDIValue=NormalizeDouble(NDIArray[0],2);

   //Comment with Buy signal according to Buy Strategy
    if (ADXValue>25&&ADXValue>ADXValueLast)
      if(PDIValue>NDIValue)
      {
         signal = "BUY";
      }

   Comment("Simple ADX System - Signal is ",signal,"\n""ADX Value is ", ADXValue,
   "\n""ADX Value Last is ", ADXValueLast, "\n""+DI Value is ", PDIValue,
   "\n""-DI Value is ", NDIValue);
  }
//+------------------------------------------------------------------+
After that we can find the expert advisor in the Navigator window:

After double-clicking or dragging and dropping it on the chart, the following window will appear,

After ticking next to "Allow Algo Trading" and pressing the OK button, the expert advisor will be attached,

After that we can find signals that appear according to the strategy:
- The buy signal.
- New line with current ADX value.
- New line with previous ADX value.
- New line with +DI value.
- New line with -DI value.

- Strategy three: Simple ADX System - Downtrend:
ADX value > 25 and current ADX value > previous ADX value --> when +DI value < -DI value = sell
The following is how to create an expert advisor that will execute this strategy:
//+------------------------------------------------------------------+
//|                Simple ADX System - Downtrend - Sell Strategy.mq5 |
//|                                  Copyright 2022, MetaQuotes Ltd. |
//|                                             https://www.mql5.com |
//+------------------------------------------------------------------+
#property copyright "Copyright 2022, MetaQuotes Ltd."
#property link      "https://www.mql5.com"
#property version   "1.00"
//+------------------------------------------------------------------+
void OnTick()
  {

   // creating a variable for signal
   string signal="";

   //creating an array for prices
   double ADXArray0[];
   double ADXArray1[];
   double PDIArray[];
   double NDIArray[];

   //identify ADX, positive DI, negative DI
   int ADXDef = iADX(_Symbol,_Period,14);


   //sort price array from current data
   ArraySetAsSeries(ADXArray0,true);
   ArraySetAsSeries(ADXArray1,true);
   ArraySetAsSeries(PDIArray,true);
   ArraySetAsSeries(NDIArray,true);

   //Filling data according to created ADX
   CopyBuffer(ADXDef,0,0,3,ADXArray0);
   CopyBuffer(ADXDef,0,0,2,ADXArray1);
   CopyBuffer(ADXDef,1,0,3,PDIArray);
   CopyBuffer(ADXDef,2,0,3,NDIArray);

   //Getting value of current data
   double ADXValue=NormalizeDouble(ADXArray0[0],2);
   double ADXValueLast=NormalizeDouble(ADXArray1[1],2);
   double PDIValue=NormalizeDouble(PDIArray[0],2);
   double NDIValue=NormalizeDouble(NDIArray[0],2);

   //Comment with Buy signal according to Buy Strategy
    if (ADXValue>25&&ADXValue>ADXValueLast)
      if(PDIValue<NDIValue)
      {
         signal = "SELL";
      }

   Comment("Simple ADX System - Signal is ",signal,"\n""ADX Value is ", ADXValue,
   "\n""ADX Value Last is ", ADXValueLast, "\n""+DI Value is ", PDIValue,
   "\n""-DI Value is ", NDIValue);
  }
//+------------------------------------------------------------------+
They are the same steps of the uptrend strategy with the following differences:
- Conditions of downtrend strategy:
    if (ADXValue>25&&ADXValue>ADXValueLast)
      if(PDIValue<NDIValue)
      {
         signal = "SELL";
      }
- Comment by the signal:
   Comment("Simple ADX System - Signal is ",signal,"\n""ADX Value is ", ADXValue,
   "\n""ADX Value Last is ", ADXValueLast, "\n""+DI Value is ", PDIValue,
   "\n""-DI Value is ", NDIValue);
After writing the code of this strategy, we can find the file of the expert advisor in the Navigator window:

After double-clicking or dragging and dropping the file on the chart, the following window will appear:

After ticking next to "Allow Algo Trading" and pressing the OK button, the expert advisor will be attached to the chart and the following picture shows an example of it:

Then we can find signals that appear according to the downtrend strategy:
- Sell signal.
- New line with current ADX value.
- New line with previous ADX value.
- New line with +DI value.
- New line with -DI value.
The following picture is an example of the signal generated according to this strategy from testing:

Conclusion
Now and after mentioned topics of this article, it is supposed that you knew one of the popular and useful indicators that is the ADX indicator in detail and how to design a trading system using it as we knew what is the ADX, what it measures, how we calculate it manually. We knew simple strategies based on the ADX indicator, during the uptrend, and downtrend, then we designed a blueprint for these strategies to help us to design the trading system step by step to understand what we need to inform the program to do exactly. We knew how to design a trading system to work automatically based on these ADX strategies and we knew how to write the code for these trading strategies by MQL5 (MetaQuotes Language).
The ADX indicator has many strategies that can be used for trading from simple to complicated strategies but here we mentioned only some simple strategies to learn the basic concept of the indicator and the basic concept of the article and the main objective is to learn trading strategies based on the technical approach and design a trading system for them by MQL5 to be used in the MetaTrader 5 trading platform.
What I need also to mention here that we have a lot of useful tools and strategies that can be used for our trading. These tools can be used individually or we can combine what are valid to be combined to get better results and this is one of the most useful features of the technical analysis as it has many tools based on different concepts that they can enhance our trading decisions and this will return better results from trading. I recommend reading my previous articles about other popular indicators that can be used by some simple strategies and how to design a simple trading system based on these strategies by MQL5 to use by the MetaTrader 5. So, our mission is to learn these concepts and tools and see what is suitable for our trading style and plan as you can find many strategies that may be useful for someone but it does not for another and every person must have a trading plan based on his trading strategy and we can know that by testing every new strategy or tool to confirm if it will be useful and profitable or not before using them on real accounts.
Programming can be very useful in this stage because of many reasons, it helps us to do that easily, smoothly, and accurately. Once we find a profitable strategy we can also design a trading system for it to allow the computer to work for us automatically according to the conditions of the designed program. This will make us avoid harmful emotions that can be involved in our trading process also, so, programming helps us to trade with discipline which is one of the most important keys to trading successfully. So, it is good to learn programming and MQL5 as they can be helpful to achieve these goals.
I hope that you found this article useful for your trading even if it opened your eyes to new ideas and gave you insights into the topic of the article or any related topic to help you to improve your trading results to get better results continuously because this is the main objective from our trading is to get good results and achieve profits consistency and I hope that this article contributes helping to achieve this valuable goal.