Making charts more interesting: Adding a background
Daniel Jose | 27 April, 2022
Introduction
Many workstations contain some representative image which shows something about the user. These images make the working environment more beautiful and inspiring, as people always try to choose the vest and most beautiful images to use as wallpaper. But when we open the trading platform, we see that it is somehow boring. All we have is the graphical representation of numerical data.
You can look at images and photos for quite a long period without getting tired, but observing a price chart even for a few minutes can be very tiring. So, let's make it so that we can watch and analyze the chart, while the image in the background motivates us and reminds us of something good.
Planning
First of all, we need to determine one thing that will define how the entire project will work: whether we want to change the chart background from time to time, or we are going to use one image throughout the entire lifetime of the program, with the same image used for all charts? I like to place different images on different charts. For example, something that represents the type of the asset I am trading or something that hints at what I should be looking into in this asset. Therefore, the resulting compiled file will not have any internal image, and thus we will be able to select any desired image later.
Now there is another thing to define: Where should our images be located? MetaTrader 5 has a directory structure that we should use to access things. The directory tree cannot be used outside of this framework. Knowing how to use this structure is paramount if we want to access images later. Since we plan to organize the storage and maintain it over time, we will create a folder in the FILES directory and name it WALLPAPERS. Thus we will be accessing images without leaving the tree, the root of which is the MQL5 directory.
But why not put the files in the IMAGES folder? In this case, we would have to navigate through the tree, which would be an unnecessary task that complicates the logic of the program. But since we strive for maximum simplicity, we will use what MetaTrader 5 offers us. So, the structure will look as follows:
After that we will add images as shown below, i.e. we will separate logo images from general background images. This organization keeps things in order, as there can be a lot of different images used as logos, if we are working with multiple assets.
This is a simple and efficient solution: add as many images as you need without interfering with the program operation. Now, please pay attention to an important detail. The images are in the BITMAP format. They should be in 24 or 32 bit type because these formats are easy to read: MetaTrader 5 can read these formats by default so I left it that way. Of course, it is also possible to use other types, if you can program the reading routine so that in the end you have a BITMAP image. However, I believe that it is easier to use an image editor and convert an image to the 24-bit or 32-bit standard than to create a separate reading function. Files in the LOGOS folder follow the same principles, but with some exceptions, which we will see shortly.
Now that we have defined the rules, let's proceed to coding. The code follows the principles of Object Oriented Programming (OOP), so you can easily port it to a script or indicator if you want, or even isolate it if needed.
Step by Step
The code starts with some definitions:
//+------------------------------------------------------------------+
enum eType {IMAGEM, LOGO, COR};
//+------------------------------------------------------------------+
input char     user01 = 30;               //Transparency ( 0 a 100 )
input string   user02 = "WallPaper_01";   //File name
input eType    user03 = IMAGEM;           //Chart background type
//+------------------------------------------------------------------+
Here we indicate what we are going to do. The eType enumeration indicates what the background graphics will be: IMAGE, LOGO or Color. The USER02 entry specifies the name of the file that will be used as a background, provided that IMAGE type is selected in USER03. USER01 indicates the level of transparency of the background image, as in some cases it can interfere with data visualization on the chart. So we use transparency to minimize this effect. The transparency value can be from 0% to 100%: the higher the value, the more transparent the image.
The following functions should be added to your program:
| Function | Parameters | Where to declare a function | Result |
|---|---|---|---|
| Init(string szName, char cView) | File name and desired transparency level | As the first function in OnInit code | Loads the specified BITMAP file and renders it with the specified transparency |
| Init(string szName) | Only the file is required | As the first function in OnInit code | Loads the specified BITMAP file without any transparency |
| Resize(void) | No parameters required | In OnChartEvent code; in the CHARTEVENT_CHART_CHANGE event | Resizing the image on the chart appropriately |
So, let's see how to use these functions in the main code, starting with the class initialization shown below. Note that the user in this case can specify the level of transparency. For the value to be correct, we should subtract it from 100.
int OnInit()
  {
   if(user03 != COR)
      WallPaper.Init(user03 == IMAGE ? "WallPapers\\" + user02 : "WallPapers\\Logos\\" + _Symbol, (char)(100 - user01));
   return INIT_SUCCEEDED;
  }
Note that if we use the COLOR mode, the image will not appear. But pay attention to the triple operator. When we select an image, the program will point to the WALLPAPER directory in the FILES tree. When it is LOGO, it will also point to the relevant location, but note that the filename for the logo must match the symbol name, otherwise an error will be generated. This is all in case of continuous series. But if you use an asset with an expiration date, it will be necessary to add a small function to separate the part of the name that distinguishes the current series from the expired one. The problem can be solved by simply renaming the image so that it reflects the current name. For those who use cross orders, it may be interesting to set up a separate symbol name adjustment routine.
The next function to pay attention to is the following:
void OnChartEvent(const int id, const long &lparam, const double &dparam, const string &sparam)
  {
   if(id == CHARTEVENT_CHART_CHANGE)
      WallPaper.Resize();
  }
All codes are very short, as I don't like to complicate things as it makes it difficult to improve or change the system. Also, try to make it your rule. The above function will guarantee that any change in chart sizes will call the function that will resize the image to always provide a nice look and to have the image fully rendered.
Our class code has the following features:
| Function | Parameters | Result |
|---|---|---|
| MsgError(const eErr err, int fp) | Error type and file descriptor | Closes the file and shows the corresponding error message. |
| MsgError(const eErr err) | Error type | Shows the corresponding error message |
| LoadBitmap(const string szFileName, uint &data[], int &width, int &height) | File name and data pointers | Loads the required file and returns its data in the data[] format, as well as its dimensions in pixels. |
| ~C_WallPaper() | No parameters required | Provides closing of the object class |
| Init(const string szName, const char cView) | File name and transparency level | Correctly initialize the entire class |
| Init(const string szName) | File name | Correctly initialize the entire class |
| Destroy(void) | No parameters required | Ends the class appropriately |
| Resize(void) | No parameters required | Correctly resizes the image |
To avoid complete chaos in the code, I concentrated error processing in one function which is shown below. The only thing it does is send a message to the user if something goes wrong. This makes things easier since in the case of translating to another language, all you need to do is change the messages in a single routine and not try to find every message used.
   bool              MsgError(const eErr err, int fp = 0)
     {
      string sz0;
      switch(err)
        {
         case FILE_NOT_FOUND  :
            sz0 = "File not found";
            break;
         case FAILED_READ     :
            sz0 = "Reading error";
            break;
         case FAILED_ALLOC    :
            sz0 = "Memory error";
            break;
         case FAILED_CREATE   :
            sz0 = "Error creating an internal resource";
            break;
        };
      MessageBox(sz0, "WARNING", MB_OK);
      if(fp > 0)
         FileClose(fp);
      return false;
     }
The below function reads the file and loads it into memory. The only information we need is the file name, while the function will fill the rest of the data. In the end you will get the dimensions of the image and the image itself, but in the BITMAP format. It is important to note this because although there are several formats, the result always ends with BITMAP; only the way it is compressed is what differs one format from another.
   bool              LoadBitmap(const string szFileName, uint &data[], int &width, int &height)
     {
      struct BitmapHeader
        {
         ushort      type;
         uint        size;
         uint        reserv;
         uint        offbits;
         uint        imgSSize;
         uint        imgWidth;
         uint        imgHeight;
         ushort      imgPlanes;
         ushort      imgBitCount;
         uint        imgCompression;
         uint        imgSizeImage;
         uint        imgXPelsPerMeter;
         uint        imgYPelsPerMeter;
         uint        imgClrUsed;
         uint        imgClrImportant;
        } Header;
      int fp;
      bool noAlpha, noFlip;
      uint imgSize;

      if((fp = FileOpen(szFileName + ".bmp", FILE_READ | FILE_BIN)) == INVALID_HANDLE)
         return MsgError(FILE_NOT_FOUND);
      if(FileReadStruct(fp, Header) != sizeof(Header))
         return MsgError(FAILED_READ, fp);
      width = (int)Header.imgWidth;
      height = (int)Header.imgHeight;
      if(noFlip = (height < 0))
         height = -height;
      if(Header.imgBitCount == 32)
        {
         uint tmp[];
         noAlpha = true;
         imgSize = FileReadArray(fp, data);
         if(!noFlip)
            for(int c0 = 0; c0 < height / 2; c0++)
              {
               ArrayCopy(tmp, data, 0, width * c0, width);
               ArrayCopy(data, data, width * c0, width * (height - c0 - 1), width);
               ArrayCopy(data, tmp, width * (height - c0 - 1), 0, width);
              }
         for(uint c0 = 0; (c0 < imgSize && noAlpha); c0++)
            if(uchar(data[c0] >> 24) != 0)
               noAlpha = false;
         if(noAlpha)
            for(uint c0 = 0; c0 < imgSize; c0++)
               data[c0] |= 0xFF000000;
        }
      else
        {
         int byteWidth;
         uchar tmp[];
         byteWidth = width * 3;
         byteWidth = (byteWidth + 3) & ~3;
         if(ArrayResize(data, width * height) != -1)
            for(int c0 = 0; c0 < height; c0++)
              {
               if(FileReadArray(fp, tmp, 0, byteWidth) != byteWidth)
                  return MsgError(FAILED_READ, fp);
               else
                  for(int j = 0, k = 0, p = width * (height - c0 - 1); j < width; j++, k+=3, p++)
                     data[p] = 0xFF000000 | (tmp[k+2] << 16) | (tmp[k + 1] << 8) | tmp[k];
              }
        }
      FileClose(fp);
      return true;
     }
Look at the following code line:
if((fp = FileOpen(szFileName + ".bmp", FILE_READ | FILE_BIN)) == INVALID_HANDLE)
Please note that the file extension is specified at this point, i.e. we don't specify it at the moment when we indicate what the image will be, because if we specify the extension, we will get a "file not found" error. The rest of the function is quite simple: first it reads the header of the file and checks if it is a 32 bit or 24 bit BITMAP; then it reads the image accordingly, since 32 bit images have a slightly different internal structure than 24 bit ones.
The next function initializes all data for our bitmap image which will be displayed on the screen. Please note that during this function we convert this bitmap file into a program resource. It is necessary because later we will link this resource to an object, and it is precisely this object that will be displayed on the screen not as an object but as a resource. It seems hard to understand why we're doing it this way. But this step allows us to create multiple resources of the same type and then to associate them with a single object that will be used to display something. If we added a single certain resource to the program, we would define it as an internal resource and compiled the file. In this case it would be impossible to change the resource without recompiling the source code. However, by creating a dynamic resource, it is possible to specify which resource to use.
   bool              Init(const string szName, const char cView = 100, const int iSub = 0)
     {
      double dValue = ((cView > 100 ? 100 : (cView < 0 ? 0 : cView)) * 2.55) / 255.0;
      m_Id = ChartID();
      if(!LoadBitmap(szName, m_BMP, m_MemWidthBMP, m_MemHeightBMP))
         return false;
      Destroy();
      m_Height = m_MemHeightBMP;
      m_Width = m_MemWidthBMP;
      if(ArrayResize(m_Pixels, (m_MemSizeArr = m_Height * m_Width)) < 0)
         return MsgError(FAILED_ALLOC);
      m_szRcName = "::" + szName + (string)(GetTickCount64() + MathRand());
      if(!ResourceCreate(m_szRcName, m_Pixels, m_Width, m_Height, 0, 0, 0, COLOR_FORMAT_ARGB_NORMALIZE))
         return MsgError(FAILED_CREATE);
      if(!ObjectCreate(m_Id, (m_szObjName = szName), OBJ_BITMAP_LABEL, iSub, 0, 0))
         return MsgError(FAILED_CREATE);
      ObjectSetInteger(m_Id, m_szObjName, OBJPROP_XDISTANCE, 0);
      ObjectSetInteger(m_Id, m_szObjName, OBJPROP_YDISTANCE, 0);
      ObjectSetString(m_Id, m_szObjName, OBJPROP_BMPFILE, m_szRcName);
      ObjectSetInteger(m_Id, m_szObjName, OBJPROP_BACK, true);
      for(uint i = 0; i < m_MemSizeArr; i++)
         m_BMP[i] = (uchar(double(m_BMP[i] >> 24) * dValue) << 24) | m_BMP[i] & 0x00FFFFFF;
      return true;
     }
This is all very nice and apparently practical, but the object itself is not capable of changing the resource. It means that it is not possible to change the way a resource will work or be presented simply by linking it to an object. This sometimes complicates things a bit, since most of the time we have to code the way the resource should be modified inside the object.
Until this point, an image could be rendered using the following code:
      if(ResourceCreate(m_szRcName, m_Pixels, m_Width, m_Height, 0, 0, 0, COLOR_FORMAT_ARGB_NORMALIZE))
         ChartRedraw();
But using this code will not guarantee that the image will be presented as expected, except for the fact that it has the exact dimensions of the chart. I advise you to use high-definition images. Large images are represented better, making calculation easier and this saving time on processing which can be crucial in certain scenarios. But even so we still have the problem of the image not being correctly presented as the object will not change the resource so that it fits the object's specifications. So, we have to do something to enable correct modeling of the resource so that it can be presented using the object. The math related to the image ranges from the simplest calculations, to very complicated things. But since processing time is crucial for us as it is using the price chart, we can't afford doing excessive calculations. Things should as simple and fast as possible. Due to this, we can use images larger than the chart, as the only calculation required would be reducing the size. Let's see how this will work.
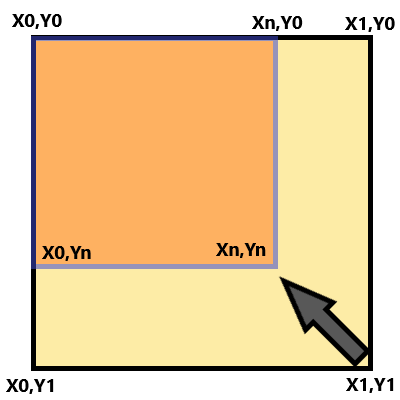
The mathematical relationships used on the above chart can be obtained as follows:
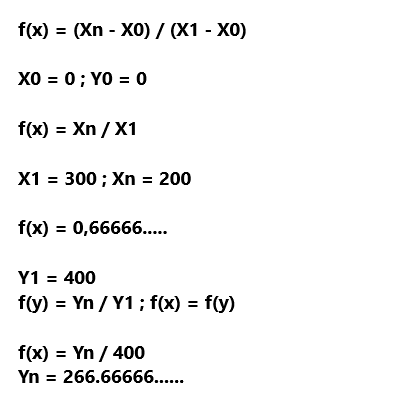
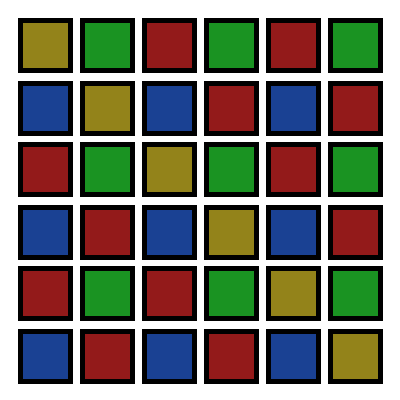
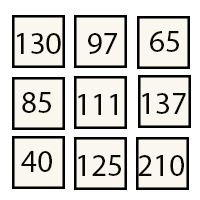
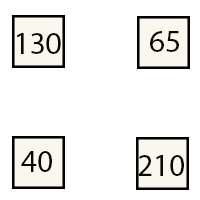
Note that here f(x) = f(y) which preserves the image ratio. This is also known as the "aspect ratio", meaning the image changes completely. But what if f(y) did not depend on f(x), what would happen to our image? Well, it would be changing disproportionately, thus taking any shape. Although we have no problem when reducing the size, this is not true for increasing: if the f(x) > 1.0 or f(y) > 1.0, we will get an image zoom, which is where problems start. The first problem appears in the image below:
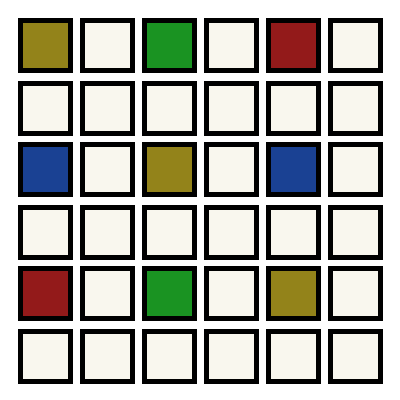
This happens because of the effect which can be seen in the figure below. Note that the white spaces represent empty areas which appear in the image when it grows through the zoom in effect. This will always happen when f(x) or f(y) is greater than one, i.e. when we follow the red arrow. In the figure below, f(x) = f(y) = 2.0, i.e. we enlarge the image by 2x.

There are several ways to solve this problem, one of them is the interpolation that should happen when an empty block is found. At this moment, we should do factorization and calculate the intermediate color between the used one to produce a smoothing effect and to fill in empty points. But there is a problem connected with computations. Even if the interpolation is done quickly, this may not be a suitable solution for MetaTrader 5 charts featuring real-time data. Even if the resizing is done a few times during the entire time that the chart is on screen (because in most cases the chart size will be smaller than the image, in which case f(x) and f(y) will be equal to or less than 1.0, and interpolation has no effect) but if you think about using an image sized 1920 x 1080 (FULL HD) on the same sized screen, the interpolation con considerably increase processing time with no benefit to the final result.
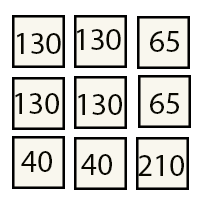
Let's see below how the interpolation calculation will be done on an image that will double its size. Obviously it will be very fast, but don't forget this should be done in a 32-bit color scheme, or ARGB, where we have 4 bytes of 8 bits for calculation. The GPU has functions that allow do these calculations quickly but accessing these functions through OpenCL may not give any practical benefit, since we will have a delay in data input and output from the GPU. Due to this there can be no advantage from the speed of calculations performed by the GPU.


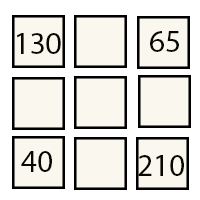


With that in mind, I think that a slightly worse image quality due to the smoothing effect is not a big deal, since in most cases f(x) or f(y) will not be higher than 2, only when using a FULL HD image on a 4k screen. In this scenario, smoothing will be minimal and can hardly be seen. Therefore, instead of interpolating points, I prefer to drag a point to the next one, quickly filling in empty values, thereby reducing computational costs to a minimum. The way it is done is shown below. Since we simply copy the data, we can process all 32 bits in one step, and it will be as fast as what would be delivered by a graphics processing system.


Thus, here is the function enabling quick resizing of the image.
void Resize(void)
{
        m_Height =(uint) ChartGetInteger(m_Id, CHART_HEIGHT_IN_PIXELS);
        m_Width = (uint) ChartGetInteger(m_Id, CHART_WIDTH_IN_PIXELS);
        double fx = (m_Width * 1.0) / m_MemWidthBMP;
        double fy = (m_Height * 1.0) / m_MemHeightBMP;
        uint pyi, pyf, pxi, pxf, tmp;

        ArrayResize(m_Pixels, m_Height * m_Width);
        ArrayInitialize(m_Pixels, 0x00FFFFFF);
        for (uint cy = 0, y = 0; cy < m_MemHeightBMP; cy++, y += m_MemWidthBMP)
        {
                pyf = (uint)(fy * cy) * m_Width;
                tmp = pyi = (uint)(fy * (cy - 1)) * m_Width;
                for (uint x = 0; x < m_MemWidthBMP; x++)
                {
                        pxf = (uint)(fx * x);
                        pxi = (uint)(fx * (x - 1));
                        m_Pixels[pxf + pyf] = m_BMP[x + y];
                        for (pxi++; pxi < pxf; pxi++) m_Pixels[pxi + pyf] = m_BMP[x + y];
                }
                for (pyi += m_Width; pyi < pyf; pyi += m_Width) for (uint x = 0; x < m_Width; x++) m_Pixels[x + pyi] = m_Pixels[x + tmp];
        }
        if (ResourceCreate(m_szRcName, m_Pixels, m_Width, m_Height, 0, 0, 0, COLOR_FORMAT_ARGB_NORMALIZE))
                ChartRedraw();
}
The function has a nested loop, the inner loop will execute the function f(x), the external loop - f(y). When executing f(x), we can have empty areas - this is fixed in the following line:
for (pxi++; pxi < pxf; pxi++) m_Pixels[pxi + pyf] = m_BMP[x + y];
If a difference occurs between X values, the above line will fix it by copying the last value of the image. As a consequence, we will have aliasing, but the computational cost in these cases will be minimal, since this fragment will have an internal loop running for the minimum time in case it is executed (which will not always be the case). If you want to interpolate data without this aliasing effect, just change this line to create the calculations explained above.
Once the whole line has been calculated, check f(y) to avoid empty areas if f(y) is greater than 1. This is done in the following line:
for (pyi += m_Width; pyi < pyf; pyi += m_Width) for (uint x = 0; x < m_Width; x++) m_Pixels[x + pyi] = m_Pixels[x + tmp];
Again, this will lead to aliasing, but this can be fixed in the same way as changing the code in the previous line. We add the width value of the new image because we are copying a line which has already been handled by the loop responsible for handling f(x) of the new image. If this were done using any other value, the image would be distorted in a strange way.
Conclusion
I hope this idea will make your charts more fun and enjoyable to look at for hours and hours, because when the background image becomes tiring, you can simply choose another one, without having to recompile anything. Simply choose the new image you want to be displayed as your chart background.
One last detail to be mentioned here: if you care using the background image placing class in an EA, it must be the first thing to be declared in the INIT routine. This will prevent the background image from overlapping other graphical objects created by the EA.
Enjoy the final result responsibly, as now you will delve even deeper into chart analysis...