LiteFinance / Profil

The online ECN broker LiteFinance (ex. LiteForex) has been providing its clients access to Tier 1 liquidity in the currency, commodity, and stock market since 2005. All major currency pairs and cross rates, oil, precious metals, stock indexes, blue chips, and the largest set of cryptocurrency pairs can be traded at LiteFinance (ex. LiteForex).
Freunde
381
Anfragen
Ausgehend

LiteFinance
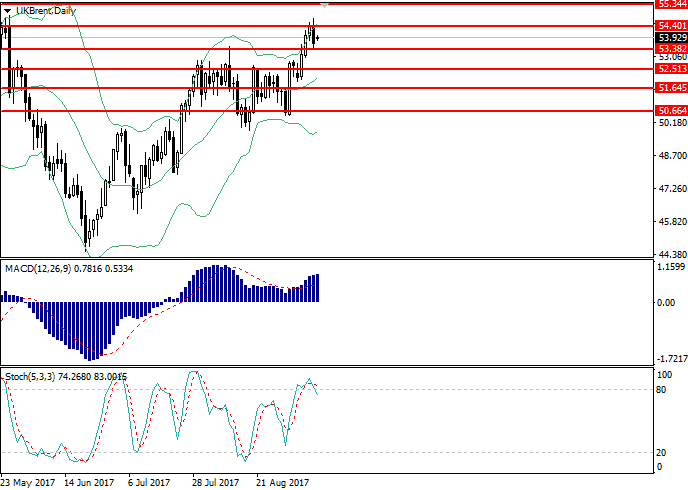
Brent Crude Oil: general review
Current trend
Last Friday the price of Brent oil reduced after the announcement of intermediary results of assessment of the damage caused by Harvey storm. The launch of operation of refineries in the Gulf of Mexico reduced the investors' concerns about a serious crisis in the US oil industry. The market reacted to this news by fixing profits in long positions which put additional pressure on the trading instrument. Moreover, according to EAI information, weekly reserves of crude oil in the USA increased by 4.6 mln barrels. At the same time gas prices have dropped, as the majority of the Americans decided to limit the use of personal cars due to Irma storm.
No important macroeconomic data able to have considerably impact on the dynamics of the trading instrument are due today. Tomorrow attention should be paid to the release of the API report on oil stocks in the USA.
Support and resistance
On D1 chart the pair is trading in the upper part of Bollinger Bands. The indicator is directed to the side, and the price range is widening, indicating the continuation of the current trend. MACD histogram is in positive zone, keeping the signal for the opening of long positions. Stochastic has left the overbought zone and formed a strong sell signal.
Support levels: 50.65, 51.65, 52.50, 53.40.
Resistance levels: 54.40, 55.35, 56.30.
Trading tips
Long positions may be opened at the current price with targets at 54.80, 55.30 and stop-loss at 53.20. The period of implementation is 1-3 days.
Short positions may be opened from the level of 53.35 with targets at 52.45 and stop-loss at 53.60. The period of implementation is 1-3 days.
Brent Crude Oil: общий обзор
Текущая динамика
В прошлую пятницу цена нефти Brent снизилась после оглашения промежуточных результатов оценки урона от урагана «Харви». Постепенный запуск нефтеперерабатывающих заводов в Мексиканском заливе смягчил опасения инвесторов относительно серьёзного кризиса в нефтяной промышленности США. Рынок отреагировал на эту новость фиксацией прибыли по длинным позициям, что оказало дополнительное давление на торговый инструмент. Кроме того, согласно информации EAI, недельные запасы сырой нефти в США выросли на 4,6 миллиона баррелей. В то же время цены на бензин упали, так как большое количество американцев решили ограничить использование автотранспорта в связи с угрозой от урагана «Ирма».
Сегодня не ожидается выхода значимых макроэкономических данных, способных оказать сильное влияние на динамику торгового инструмента. Завтра необходимо обратить внимание на публикацию отчёта API по запасам нефти в США.
Уровни поддержки и сопротивления
На дневном графике инструмент торгуется в верхней части полос Боллинджера. Индикатор направлен вбок, тогда как ценовой диапазон расширяется, указывая на продолжение текущего тренда. Гистограмма MACD находится в положительной зоне, сохраняя сигнал на открытие длинных позиций. Стохастик вышел из области перекупленности, сформировав сильный сигнал на продажу.
Уровни поддержки: 50.65, 51.65, 52.50, 53.40.
Уровни сопротивления: 54.40, 55.35, 56.30.
Торговые сценарии
Открывать длинные позиции можно по текущей цене с целями 54.80, 55.30 и стоп-лоссом на уровне 53.20. Срок реализации составляет 1-3 дня.
Открывать короткие позиции можно от уровня 53.35 с целью 52.45 и стоп-лоссом на уровне 53.60. Срок реализации составляет 1-3 дня.
LiteFinance
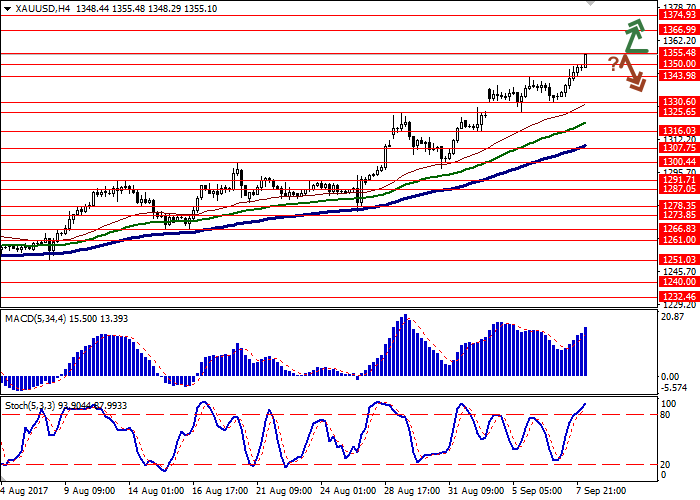
XAU/USD: gold is updating record-setting maximums
Current trend
Gold prices have updated 1-year record-setting maximums after the release of disappointing data on the dynamics of jobless claims in the USA and after ECB kept the interest rate on the previous level.
A report published yesterday showed the growth of initial jobless claims from 235K to 298K, while the analysts expected them to grow only to 241K. The number of repeated claims reduced more than expected: from 1.945 mln to 1.940 mln against the outlook of growth to 1.950 mln.
ECB press conference was neutral. The head of the regulator Mario Draghi pointed out that economic growth forecasts in the region remained unchanged and inflation expectations had not changed as well.
Support and resistance
Bollinger Bands in D1 chart demonstrate stable increase. The price range is actively widening. MACD indicator is growing preserving a stable buy signal (the histogram is above the signal line). Stochastic has reached maximum values and reversed horizontally.
Resistance levels: 1355.48, 1366.99, 1374.93.
Support levels: 1350.00, 1343.98, 1330.60, 1325.65.
Trading tips
Long positions may be opened from the level of 1355.48 with target at 1374.93 and stop-loss at 1340.00. The period of implementation is 1-2 days.
Short positions may be opened from the levels of 1350.00, 1343.98 with targets at 1316.03 and stop-loss at 1365.00. The period of implementation is 2-3 days.
XAU/USD: золото обновляет рекордные максимумы
Текущая динамика
Цены на золото обновили рекордные максимумы за год после выхода разочаровывающих данных по динамике заявок на пособие по безработице в США, а также после сохранения ЕЦБ процентной ставки на прежних уровнях.
Отчёт, опубликованный накануне, отразил рост числа первичных заявок на пособие по безработице с 235 тысяч до 298 тысяч, тогда как аналитики ожидали роста лишь до 241 тысяч. При этом число вторичных заявок сократилось сильнее прогнозов: с 1,945 миллиона до 1,940 миллиона, при прогнозе о росте до 1,950 миллиона.
Пресс-конференция ЕЦБ оказалась нейтральной. Глава регулятора Марио Драги отметил, что прогнозы по экономическому росту в регионе остались прежними, равно как не изменились и ожидания по инфляции.
Уровни поддержки и сопротивления
Полосы Боллинджера на графике D1 демонстрируют уверенный рост. Ценовой диапазон активно расширяется. Индикатор MACD растёт, сохраняя прочный сигнал на покупку (гистограмма располагается выше сигнальной линии). Стохастик достиг максимальных значений и развернулся в горизонтальную плоскость.
Уровни сопротивления: 1355.48, 1366.99, 1374.93.
Уровни поддержки: 1350.00, 1343.98, 1330.60, 1325.65.
Торговые сценарии
Длинные позиции можно открывать от уровня 1355.48 с целью 1374.93 и стоп-лоссом 1340.00. Срок реализации составляет 1-2 дня.
Короткие позиции можно открывать от уровней 1350.00, 1343.98 с целью в районе 1316.03 и стоп-лоссом 1365.00. Срок реализации составляет 2-3 дня.
LiteFinance
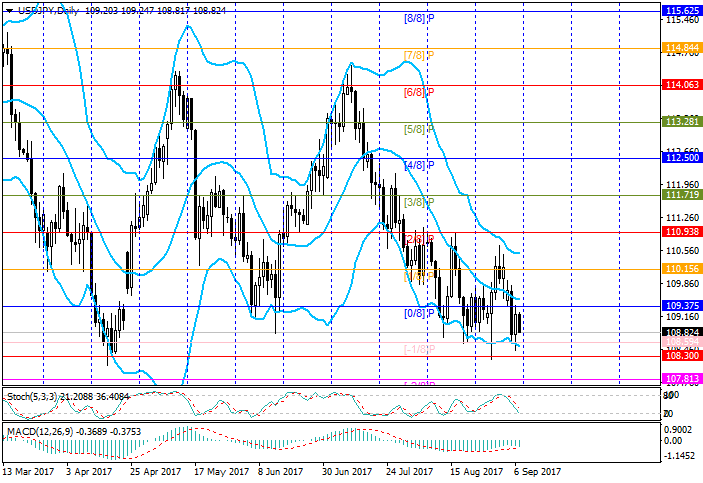
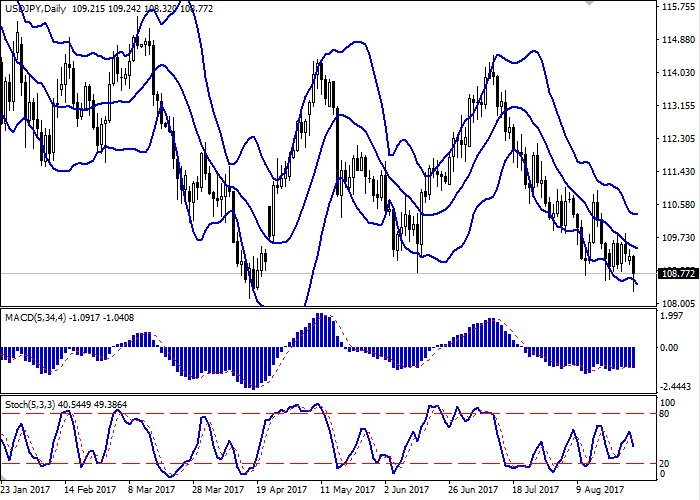
LiteForex USD/JPY: Murrey analysis
On the D1 chart the price is around the level of 109.37 [0/8] (main support) — 108.59 [-1/8] (extreme support). The zone seems quite strong as the pair has been testing it in vain since April. Currently the price is approaching the cyclical line near which it may reverse upwards. In this case the growth of the price may continue through a number of levels (110.15 [1/8] and 110.93 [2/8]) to the lower border of horizontal channel 111.71 [3/8] (bottom of the channel). The continuation of the fall is possible if the price consolidates below 108.59 [-1/8]. In this case the pair may decrease to 107.81 [-2/8] (final resistance) and 106.25 [2/8] (for W1 chart). Technical indicators show the possibility of the fall but in limited scope. Stochastic is directed downwards but has approached the oversold area. MACD histogram shows indicators of bearish divergence, the occurrence of which will open the way to purchases.
Support and resistance
Support levels: 108.59 [-1/8] (extreme support), 107.81 [-2/8] (final support), 106.25 [2/8] (rotation and reversal in W1).
Resistance levels: 109.37 [0/8] (main support), 110.15 [1/8] (stop, reversal), 110.93 [2/8] (rotation, reversal), 111.71 [3/8] (bottom of the channel).
Trading tips
In the current situation buy positions may be opened at the level above109.37 or in case of a turn around 108.59 with targets at 110.15, 110.98, 111.71 and stop-losses at 109.00 and 108.30. Short positions can be opened if the price consolidates below 108.59 with targets at 107.81, 106.25 and stop-loss at 109.00.
LiteFinance
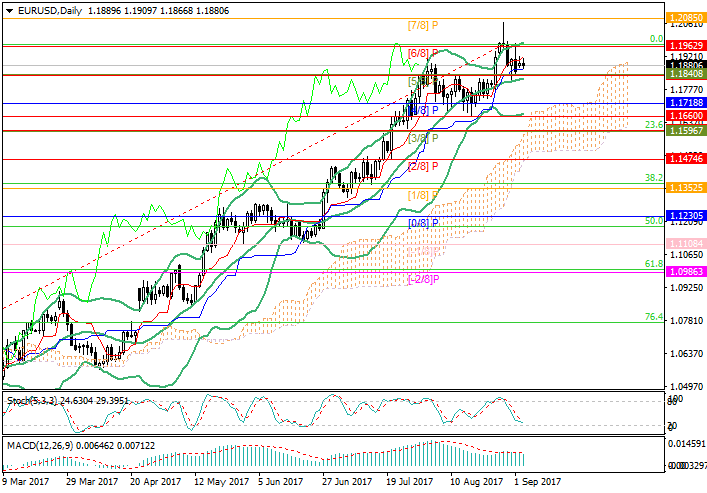
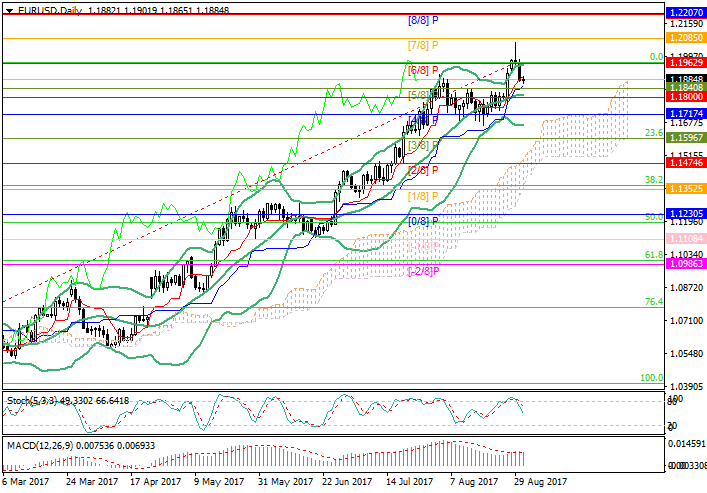
EUR/USD: the market is waiting for comments from FOMC members
Current trend
The pair started the week with growth to 1.1920 after North Korea carried out nuclear missiles testing, and the USA replied with tough rhetoric. However, by now the price has corrected to 1.1880 (middle line of Bollinger Bands at H4).
Today the most important part of the releases is traditional financial statistics. Services PMIs of Germany and Eurozone for August failed to show material changes or cause considerable market reaction. The indicator for Germany grew from 53.4 to 53.5 points, and for Eurozone reduced from 54.9 to 54.7 points. The statistics on the volume of retail sales in Eurozone was mixed.
In the USA attention should be paid to statements by the Fed's members Lael Brainard and Neel Kashkari that are especially important in view of the upcoming September meeting of the Fed.
Support and resistance
Technically, the pair is trading within the upper Bollinger Band between 1.1840 (Murrey level [5/8]) and 1.1962 (Murrey level [6/8]) and may continue moving in it as the investors are not likely to take risks before the ECB meeting scheduled for Thursday. In case of breakdown of the level of 1.1840 and the middle line of Bollinger Bands the fall may continue to 1.1720 (Murrey level [4/8]) and 1.1660 (lower line of Bollinger Bands). Otherwise the price may go up to the upper border of the range at 1.1962and in case of its breakout go further to 1.2085 (Murrey level [7/8]). Indicator show decrease: Stochastic is directed downwards, and MACD histogram is reducing in the positive zone.
Support levels: 1.1840, 1.1800, 1.1720, 1.1660.
Resistance levels: 1.1962, 1.2085, 1.2200.
Trading tips
In the current situation short positions should be opened below the level of 1.1840 and the middle line of Bollinger Bands with targets at 1.1720, 1.1660 and stop-loss at 1.1880.
Long positions should be opened above 1.1900 or in case of reversal at 1.1840 with targets at 1.1962, 1.2085 and stop-loss at 1.1870 and 1.1800.
EUR/USD: рынок ждет комментариев членов FOMC
Текущая динамика
Пара начала неделю ростом к 1.1920 после проведения ядерных испытаний КНДР и жесткой ответной риторики США. Однако в настоящее время цена скорректировалась к 1.1880 (средняя линия полос Боллинджера для H4).
Сегодня на первый план выходит традиционная финансовая статистика. Августовские индексы деловой активности в сфере услуг Германии и еврозоны не показали существенных изменении и не вызвали значительной реакции рынка. Показатель для Германии увеличился с 53,4 до 53,5 пункта, а для еврозоны уменьшился с 54,9 до 54,7 пункта. Статистика по объёму розничных продаж в еврозоне также была смешанной.
В США сегодня стоит обратить внимание на выступления членов ФРС Лаэль Брейнард и Нила Кашкари, которые особенно важны в свете приближающегося сентябрьского заседания ФРС.
Уровни поддержки и сопротивления
Технически пара торгуется в рамках верхней полосы Боллинджера 1.1840 (уровень Мюррея [5/8]) – 1.1962 (уровень Мюррея [6/8]) и может продолжить движение в её рамках, поскольку инвесторы не будут рисковать перед заседанием ЕЦБ, которой должно состояться в четверг. При пробое вниз отметки 1.1840 и средней линии полос Боллинджера возможно продолжение снижения цены к отметкам 1.1720 (уровень Мюррея [4/8]) и 1.1660 (нижняя линия полос Боллинджера). В противном случае цена может подняться к верхней границе диапазона 1.1962, а при её пробое пойти выше, к уровню 1.2085 (уровень Мюррея [7/8]). Индикаторы пока говорят о снижении: Стохастик направлен вниз, гистограмма MACD уменьшается в положительной зоне.
Уровни поддержки: 1.1840, 1.1800, 1.1720, 1.1660.
Уровни сопротивления: 1.1962, 1.2085, 1.2200.
Торговые сценарии
В текущих условиях короткие позиции стоит открывать ниже отметки 1.1840 и средней линии полос Боллинджера с целями 1.1720, 1.1660 и стоп-лоссом 1.1880.
Длинные позиции стоит открывать выше отметки 1.1900 или при развороте у отметки 1.1840 с целями 1.1962, 1.2085 и защитными приказами 1.1870 и 1.1800.
LiteFinance
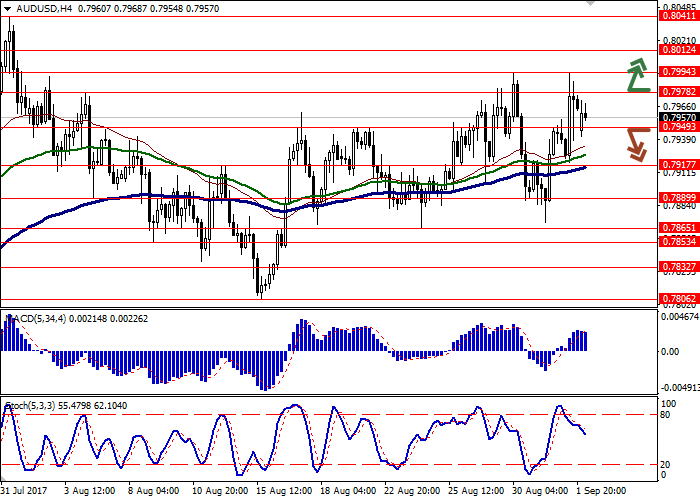
AUD/USD: the pair is showing minor growth
Current trend
AUD is growing during the morning session on September 4 after the update of a local maximum dated back to August 30 in the end of the previous week. The instrument is supported by the weakness of the US currency that is experiencing pressure again due to the tightening of the geopolitical situation around North Korea.
Macroeconomic statistics released in Australia on Monday has mixed influence on the pair. TD Securities inflation data in August showed growth by 0.1% MoM and 2.6% YoY which practically meets the data for the previous period. The indicator of income from main activities of companies in Q2 2017 dropped by 4.5% in quarterly terms after earlier growth by 6.0%. Investors expected it to dectease by 4.0% on the quarterly basis.
Trading activity on Monday will be reduced as the US markets will be closed on Monday due to the Labor Day. Investors will focus on the release of RBA minutes on Tuesday, September 5, at 06:30 (GMT+2).
Support and resistance
Bollinger Bands in D1 chart demonstrate slight growth. The price range remains quite unchanged and quite limited. MACD histogram is slightly growing keeping a weak buy signal (and remaining above the signal line). Stochastic is growing, approaching the border of the overbought zone once again.
Resistance levels: 0.7978, 0.7994, 0.8012, 0.8041.
Support levels: 0.7949, 0.7917, 0.7889, 0.7865.
Trading tips
Long positions may be opened after the outbreak of the levels 0.7978 or 0.7994 with targets at 0.8040, 0.8060 and top-loss at 0.7950. The period of implementation is 2-3 days.
Alternatively, short positions may be opened after breaking down the level of 0.7949 with target at 0.7889 and stop-loss at 0.7978. The period of implementation is 2-3 days.
AUD/USD: пара показывает неуверенный рост
Текущая динамика
Австралийский доллар торгуется с повышением в ходе утренней сессии 4 сентября после обновления локального максимума от 30 августа в конце минувшей недели. Поддержку инструменту оказывает слабость американской валюты, которая вновь находится под давлением из-за обострения геополитической обстановки вокруг КНДР.
Макроэкономическая статистика, опубликованная в Австралии в понедельник, оказывает смешанное влияние на пару. Данные по инфляции от TD Securities в августе показали рост на 0,1% в месячном и 2,6% в годовом выражении, что практически совпадает с данными за прошлый период. В свою очередь, показатель прибыли от основной деятельности компаний во 2-м квартале текущего года упал на 4,5% в квартальном исчислении после роста на 6,0% ранее. Инвесторы ожидали снижения на 4,0% в квартальном исчислении.
Активность торгов в понедельник будет оставаться пониженной, поскольку рынки США в понедельник закрыты по случаю празднования Дня труда. Инвесторы сконцентрируются на публикации протоколов заседания РБА во вторник, 5 сентября, в 06:30 (GMT+2).
Уровни поддержки и сопротивления
Полосы Боллинджера на графике D1 демонстрируют незначительный рост. Ценовой диапазон практически не изменяется и остается довольно ограниченным. Индикатор MACD показывает неуверенный рост, сохраняя слабый сигнал на покупку (гистограмма располагается выше сигнальной линии). Стохастик растёт, вновь приближаясь к границе области перекупленности.
Уровни сопротивления: 0.7978, 0.7994, 0.8012, 0.8041.
Уровни поддержки: 0.7949, 0.7917, 0.7889, 0.7865.
Торговые сценарии
Длинные позиции можно открывать после пробоя уровней 0.7978 или 0.7994 с целями 0.8040, 0.8060 и стоп-лоссом 0.7950. Срок реализации составляет 2-3 дня.
Альтернативой могут стать короткие позиции, которые можно открывать после пробоя уровня 0.7949 с целью 0.7889 и стоп-лоссом 0.7978. Срок реализации составляет 2-3 дня.
LiteFinance
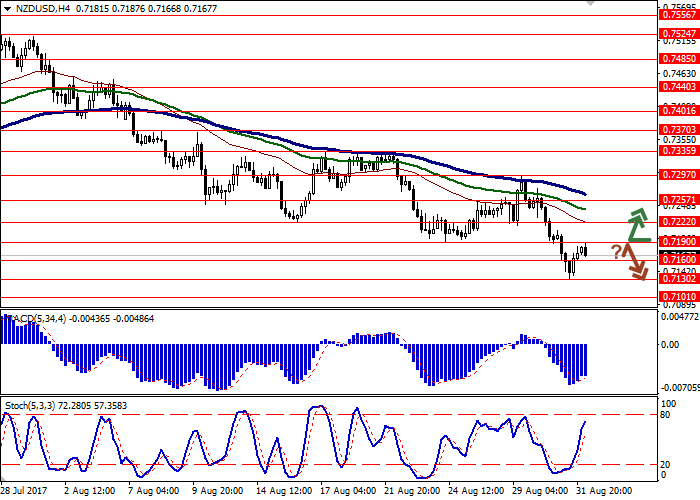
NZD/USD: New Zealand dollar under pressure
Current trend
NZD reduced considerably against the US currency during trading on Thursday, August 31, marking a new local minimum since June 6. However, with the release of uncertain macroeconomic statistics from the USA the investor's sentiment has changed, and the instrument managed to regain the majority of lost positions by the closing of the daily session.
The reason for negative NZD dynamics was weak statistics from New Zealand. Namely, business optimism index by RBNZ dropped from 19.4 to 18.3 points in August. During the morning session on September 1 the pair received moderate support from Chinese data. Manufacturing PMI Caixin grew from 51.1 to 51.6 points in August against the forecast of reduction to 50.9 points. Other activities remain low as the market is waiting for the US labor market report for August.
Support and resistance
Bollinger Bands in D1 chart demonstrate decrease. The price range is moderately widening. MACD still preserves a stable downward trend. Stochastic is reducing but is located close to the border with the oversold area.
Resistance levels: 0.7190, 0.7222, 0.7257, 0.7297, 0.7335.
Support levels: 0.7160, 0.7130, 0.7101.
Trading tips
A reversal near the level of 0.7190 with further breakdown of 0.7160 may indicate the continuation of sales. In this case the target of the "bears" may be located around 0.7100. The period of implementation is 2 days.
Long positions may be opened from the level of 0.7190 with targets at 0.7257 or 0.7297 and stop-loss at 0.7130. The period of implementation is 2-3 days.
NZD/USD: новозеландский доллар под давлением
Текущая динамика
Новозеландский доллар значительно снизился против американской валюты на торгах в четверг, 31 августа, отметив новый локальный минимум с 6 июня. Однако с публикацией неоднозначной макроэкономической статистики из США настроения инвесторов изменились, и инструмент сумел отыграть большую часть потерь к моменту закрытия дневной сессии.
Поводом к появлению негативной динамики по NZD стала слабая статистика из Новой Зеландии. В частности, индекс деловой оптимизма от РБНЗ в августе упал с 19.4 до 18.3 пунктов. В ходе утренней сессии 1 сентября умеренную поддержку паре оказывают данные из Китая. Индекс PMI Caixin в производственном секторе в августе вырос с 51.1 до 51.6 пунктов при прогнозе о снижении до 50.9 пунктов. В остальном активность остается низкой ввиду ожидания отчёта по рынку труда США за август.
Уровни поддержки и сопротивления
Полосы Боллинджера на дневном графике демонстрируют снижение. Ценовой диапазон умеренно расширяется. Индикатор MACD всё ещё сохраняет прочный нисходящий тренд. Стохастик снижается, но располагается в непосредственной близости от границы области перепроданности.
Уровни сопротивления: 0.7190, 0.7222, 0.7257, 0.7297, 0.7335.
Уровни поддержки: 0.7160, 0.7130, 0.7101.
Торговые сценарии
Открывать длинные позиции можно от уровня 0.7190 с целями 0.7257 или 0.7297 и стоп-лоссом 0.7130. Срок реализации составляет 2-3 дня.
Разворот вблизи отметки 0.7190 с последующим пробоем уровня 0.7160 вниз может стать сигналом к продолжению продаж. Целью «медведей» в этом случае могут стать отметки в районе 0.7100. Срок реализации составляет 2 дня.
LiteFinance
LiteForex EUR/USD: the correction can end
Current trend
On Wednesday the pair was correcting and now has reached the level of 1.1865.
The US currency growth is due to relative reduction of tense on the Korean peninsula and to positive economic data publication. The new North Korea missile launch didn’t lead to military USA response, moreover, Secretary of Defense James Mattis noted that the diplomatic possibilities of the conflict resolution are not exhausted, which resulted in outflow of investors from shelter assets. In addition, the USD was supported by preliminary USA GDP data (in the second quarter its growth exceeded the expectations and reached the level of 0.3%) and August ADP Non-Farm Employment Change data (instead of expected fall the indicator grew from 201K to 237K).
At the moment the falling of the pair slowed, and it’s trading around 1.1890–1.1870. Investors are waiting for the EU Consumer Price Index publication, which is very important before the ECB meeting next week. The index is expected to grow from 1.3% to 1.4%, which can lead to the reversal of the price and the beginning of the new growth of EUR.
Support and resistance
Technically the pair is tending to the middle line of Bollinger Bands at the level of 1.1800, and after breakdown can go lower, to the area of 1.1720 (Murray [4/8]) and 1.1600 (Murray [3/8], Fibonacci correction 23.6%). The downward movement will develop in case of negative reaction of the market to the EU inflation data. The indicators confirm the possibility: Stochastic has reversed downwards, MACD histogram is decreasing in the positive zone.
The upward trend will develop after the price is set above the level of 1.1960 (Murray [6/8]). In this case it can grow to the area of 1.2085 (Murray [7/8]) and 1.2200 (Murray [8/8]).
Support levels: 1.1840, 1.1800, 1.1720, 1.1600.
Resistance levels: 1.1960, 1.2085, 1.2200.
Trading tips
Short positions can be opened below the level of 1.1840 with the targets at 1.1800, 1.1720, 1.1600 and stop loss at 1.1880.
Long positions can be opened above the level of 1.1960 or after the reversal near the level of 1.1800 with the targets at 1.2085, 1.2200 and stop loss 1.1920 and 1.1770.
LiteFinance
USD/CAD: the pair is trading in the flat
Current trend
Investors failed to determine the direction of trading in the pair USD/CAD on Tuesday, August 29, and the instrument closed around zero and showed active, but mixed dynamics of trading during the day.
Canadian dollar showed weak reaction to the Tuesday release of Canadian macroeconomic statistics. Thus, the index of prices for raw materials dropped by 0.6% MoM after a fall by 3.6% last month. Manufacturing prices index dropped by 1.5% in July on a monthly bas after a fall by 1.1% in June. The real dynamics of the indicator was much worse than expected.
On Wednesday, August 30, investors will focus their attention on macroeconomic statistics from the USA. Thus, the publication of detailed assessment of the US GDP in Q2 2017 is expected at 15:30 (GMT+2).
Support and resistance
Bollinger Bands in D1 chart demonstrate a gradual decrease. The price range is slightly narrowing in the lower part. MACD histogram is slightly growing keeping a weak buy signal (and remaining above the signal line).
Stochastic is showing slightly more stable dynamics and is located in the middle of its area.
Resistance levels: 1.2548, 1.2597, 1.2617, 1.2654, 1.2689.
Support levels: 1.2500, 1.2464, 1.2439, 1.2412.
Trading tips
Long positions may be opened from the level of 1.2500 with targets at 1.2548 or 1.2597 and stop-loss at 1.2464. The period of implementation is 2-3 days.
Breaking down the level of 1.2500 may be a signal to corrective sales with target around 1.2439 and stop-loss at 1.2548. The period of implementation is 2 days.
USD/CAD: пара торгуется во флэте
Текущая динамика
Инвесторы не сумели определиться с направлением торгов по паре USD/CAD во вторник, 29 августа, в результате чего инструмент закрылся около нуля, а в течение дня показывал активную, но смешанную динамику торгов.
Канадский доллар слабо отреагировал на публикацию во вторник макроэкономической статистики из Канады. Так, индекс цен на сырьё в июле снизился на 0,6% в месячном исчислении после падения на 3,6% в прошлом месяце. В свою очередь, индекс цен на промышленную продукцию в июле упал на 1,5% в месячном исчислении после снижения на 1,1% в июне. Реальная динамика показателя оказалась значительно хуже прогнозов.
В среду, 30 августа, в фокусе внимания инвесторов окажется макроэкономическая статистика из США. Так, в 15:30 (GMT+2) ожидается публикация уточненных оценок по ВВП США за 2-й квартал текущего года.
Уровни поддержки и сопротивления
Полосы Боллинджера на дневном графике демонстрируют умеренное снижение. Ценовой диапазон незначительно сужается снизу. Индикатор MACD незначительно растёт, сохраняя слабый сигнал на покупку (гистограмма располагается выше сигнальной линии).
Стохастик показывает несколько более уверенную динамику, находясь примерно в центре своей рабочей области.
Уровни сопротивления: 1.2548, 1.2597, 1.2617, 1.2654, 1.2689.
Уровни поддержки: 1.2500, 1.2464, 1.2439, 1.2412.
Торговые сценарии
Длинные позиции можно открывать от уровня 1.2500 с целями 1.2548 или 1.2597 и стоп-лоссом 1.2464. Срок реализации составляет 2-3 дня.
Пробой отметки 1.2500 вниз может стать сигналом к коррекционным продажам с целью в районе 1.2439 и стоп-лоссом 1.2548. Срок реализации составляет 2 дня.
LiteFinance
USD/JPY: USD remains under pressure
Current trend
US currency has been under pressure against the Japanese yen during the morning session on August 29 and has already updated local minimums since mid-April. The growth of "bearish" activities in the instrument was explained by yet another growth of demand for safe haven assets after the announcement about the launch of a missile from North Korea directed at Japan.
By now USD managed to partially regain its positions. Among other factors, corrective growth was supported by uncertain data from Japan. For example, household expenses in July dropped unexpectedly by 0.2% YoY after growth by 2.3% in the previous month. Analysts predicted growth by 0.7% YoY.
On Wednesday the market will be waiting for the release of information on Japanese retail sales in July as well as specified data on US GDP in Q2 2017.
Support and resistance
Bollinger Bands in D1 chart continue to gradually decrease. The price range is widening reacting to increased activity in the course of the morning session on August 29. MACD is restoring the "bearish" signal (being located below the signal line) after a brief attempt to grow. Stochastic is showing similar dynamics having reversed downwards in the center of its area.
Resistance levels: 109.11, 109.41, 109.82, 110.23.
Support levels: 108.58, 108.32, 108.00.
Trading tips
Long positions may be opened after a reversal around the level of 108.32 with targets at 109.11, 109.41 and stop-loss at 108.00. The period of implementation is 2-3 days.
The breakdown of the level of 108.32 may serve as a signal to the continuation of sales with target at 108.00 and stop-loss at 108.50. The period of implementation is 1-2 days.
USD/JPY: доллар остаётся под давлением
Текущая динамика
Американская валюта находится под давлением против японской иены в ходе утренней сессии 29 августа и уже обновила локальные минимумы с середины апреля. Рост «медвежьей» активности по инструменту был обусловлен очередным ростом спроса на активы-убежища после сообщений о запуске КНДР ракеты в сторону Японии.
В настоящий момент доллару удалось частично отыграть свои потери. Среди прочего, коррекционному росту способствовали неоднозначные данные из Японии. Так, расходы домашних хозяйств в июле неожиданно снизились на 0,2% в годовом исчислении после роста на 2,3% в прошлом месяце. Аналитики рассчитывали на рост на 0,7% в годовом исчислении.
В среду ожидается публикация информации по розничным продажам в Японии за июль, а также выход уточненных данных по ВВП США за 2-й квартал 2017 года.
Уровни поддержки и сопротивления
Полосы Боллинджера на графике D1 продолжают умеренное снижение. Ценовой диапазон расширяется, реагируя на усиление активности в ходе утренней сессии 29 августа. Индикатор MACD восстанавливает «медвежий» сигнал (гистограмма располагается ниже сигнальной линии) после непродолжительной попытки роста. Стохастик демонстрирует похожую динамику, развернувшись вниз примерно в центре своей области.
Уровни сопротивления: 109.11, 109.41, 109.82, 110.23.
Уровни поддержки: 108.58, 108.32, 108.00.
Торговые сценарии
Длинные позиции можно открывать после разворота у уровня 108.32 с целями 109.11, 109.41 и стоп-лоссом 108.00. Срок реализации составляет 2-3 дня.
Уверенный пробой уровня 108.32 вниз может стать сигналом к продолжению продаж с целью 108.00 и стоп-лоссом 108.50. Срок реализации составит 1-2 дня.
LiteFinance
XAG/USD: silver keeps rising
Current dynamics
Silver is moderately growing during the morning session on August 28th, trading in close proximity to local highs, updated on August 18th. The instrument was supported by weak US currency, which was under pressure from disappointing results of the speech of the head of the Fed, Janet Yellen, at the annual symposium in Jackson Hole.
Recall that investors were waiting for comments on the prospects for monetary policy. In particular, traders were interested in the reduction of the Fed's balance sheet, which the regulator representatives themselves talked about so much. Instead, Yellen confined herself to general issues on financial stability and regulation in the banking sector.
On Monday, the only published indicators would be the ones of business activity in the industrial sphere of the Dallas Fed in August. Against this background, we can expect that the pair will maintain its upward mood and come close to the previous local highs.
Support and resistance
The indicator "Bollinger bands" on the daily chart is slightly growing, and can still turn sideways. The price range is narrowing, reflecting the multidirectional nature of trading in recent days.
The MACD indicator keeps a weak buy signal (the histogram is located above the signal line).
Oscillator Stochastic is growing, approaching the border of the overbought area.
Resistance levels: 17.16 (local maximum), 17.27 (maximum of August 18), 17.38.
Support levels: 17.00, 16.89, 16.73 (minimum of August 25), 16.62, 16.48.
Trading tips
To open long positions, one can rely on a breakdown of level 17.16, provided that the technical indicators do not contradict the development of the "bullish" trend. Take-profit – 17.38. Stop loss is at 17.00. Term of realization: 2 days.
If the level of 17.16 turns out to be an insurmountable obstacle for the bulls, it is worth considering the possibility of sales with a target in the area of 16.73. Stop loss – 17.30-17.80. Term of realization: 2-3 days.
XAG/USD: серебро сохраняет восходящую динамику
Текущая динамика
Серебро продолжает умеренный рост в ходе утренней сессии 28 августа, вновь торгуясь в непосредственной близости от локальных максимумов, обновленных 18 августа. Поддержку инструменту оказывают слабые позиции американской валюты, которая оказалась под давлением разочаровывающих итогов выступления главы ФРС Джанет Йеллен на ежегодном симпозиуме в Джексон Хоул.
Напомним, что инвесторы ожидали комментариев по поводу перспектив монетарной политики. В частности, трейдеров интересовали сроки начала сокращения баланса ФРС, о котором так много говорили сами представители регулятора. Вместо этого Йеллен ограничилась лишь общими вопросами на тему финансовой стабильности и усиления регуляции в банковском секторе.
В понедельник выйдут только показатели деловой активности в промышленной сфере ФРБ Далласа за август. На этом фоне можно рассчитывать, что пара сохранит свой восходящий настрой и вплотную приблизится к прежним локальным максимумам.
Уровни поддержки и сопротивления
Индикатор «Полосы Боллинджера» на дневном графике неуверенно растёт, сохраняя склонность к развороту вбок. Ценовой диапазон сужается, отражая разнонаправленный характер торгов в последние дни.
Индикатор MACD сохраняет слабый сигнал на покупку (гистограмма располагается выше сигнальной линии).
Осциллятор Стохастик растёт, приближаясь к границе области перекупленности.
Уровни сопротивления: 17.16 (локальный максимум), 17.27 (максимум 18 августа), 17.38.
Уровни поддержки: 17.00, 16.89, 16.73 (минимум 25 августа), 16.62, 16.48.
Торговые сценарии
Для открытия длинных позиций можно опираться на пробой уровня 17.16, при условии, что показания технических индикаторов не будут противоречить развитию «бычьего» тренда. Тейк-профит — 17.38. Стоп-лосс — 17.00. Срок реализации: 2 дня.
Если отметка 17.16 окажется для «быков» непреодолимым препятствием, стоит рассмотреть возможность продаж с целью в районе 16.73. Стоп-лосс — 17.30–17.80. Срок реализации: 2-3 дня.
LiteFinance

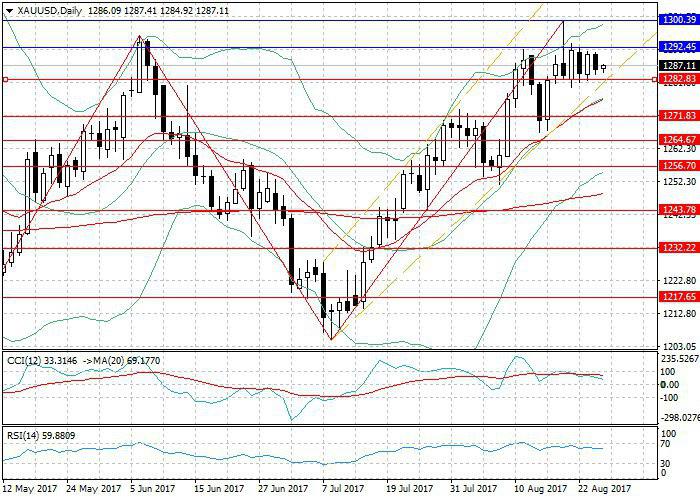
XAU/USD: general analysis
Current trend
During yesterday’s trading session gold price insignificantly fell and reached the level of 1291.93 (–0.21%) due to slight strengthening of the USD, which reacted to the lack of news upon the conflict between USA and North Korea.
At the moment gold is trading around the key level of 1300 USD per troy ounce. It reached the level of 1292.74 (+0.06% against the day before). Investors are focused on today’s Mario Draghi and Janet Yellen speeches at the summit in Jackson Hole, where the heads of central banks can comment upon further actions within the monetary policy. Donald Trump’s Administration problems also prevent gold from falling in the nearest future.
Today traders should pay attention to US Durable Goods Orders publication at 14:30 (GMT+2), which can affect the US currency.
upport and resistance
On the daily chart the instrument is trading above the middle line of Bollinger Bands, Bands are pointed upwards, which reflects the upward trend. However, CCI is reaching the zero line, and after is crosses it, the clear sell signal will be received. RSI is in the neutral zone, the indicator’s line is slightly reversing upwards, which reflects the upward trend.
Support levels: 1282.83, 1271.83, 1264.64.
Resistance levels: 1292.45, 1300.39.
Trading tips
Short positions can be opened after the price is set below the support level of 1282.83 with the targets at 1271.83 and 1264.67 and stop loss at 1287.02.
Long positions will become relevant after the breakout of the level of 1292.45 with the target at 1300.39 and stop loss at 1284.29.
XAU/USD: общий обзор
Текущая динамика
На вчерашних торгах цена на золото незначительно снизилась, достигнув отметки 1291.93 (–0,21%). Это произошло на фоне некоторого укрепления доллара США из-за отсутствия новостей о конфликте между США и Северной Кореей.
Сейчас золото продолжает торговаться вблизи ключевого уровня 1300 долларов за тройскую унцию и составляет 1292.74 (+0,06% по сравнению с днём ранее). Внимание инвесторов приковано к сегодняшним выступлениям Марио Драги и Джаннет Йеллен на экономическом саммите в Джексон Хоул, где главы Центральных банков могут сделать заявления о дальнейших действиях в рамках денежно-кредитной политики. Проблемы в администрации Дональда Трампа также ограничат падение котировок золота в ближайшее время.
Сегодня стоит обратить внимание на выход показателей по базовым заказам на товары длительного пользования в США в 14:30 (GMT+2), которые могут оказать некоторое влияние на американскую валюту.
Уровни поддержки и сопротивления
На дневном графике инструмент торгуется выше средней линии полос Боллинджера, сами полосы направлены вверх, что говорит о наличии восходящей тенденции. Однако CCI приближается к нулевой отметке, при пересечении которой будет дан явный сигнал на продажу. RSI находится в нейтральной зоне, а линия индикатора слегка разворачивается вверх, что говорит о восходящем движении.
Уровни поддержки: 1282.83, 1271.83, 1264.64.
Уровни сопротивления: 1292.45, 1300.39.
Торговые сценарии
Короткие позиции стоит открывать при закреплении цены ниже уровня поддержки 1282.83 с целями 1271.83 и 1264.67 и стоп-лоссом 1287.02.
Длинные позиции станут актуальны при пробое отметки 1292.45 с целью 1300.39 и стоп-лоссом 1284.29.
LiteFinance
LiteForex USD/JPY: general analysis
Current trend
Yesterday the pair was under the pressure of US New Home Sales statistics fall. In addition, the PMI Markit decreased to 52.5 basis points, which is by 0.8 points lower than expected. Today in Japan Foreign bond investment data were published. The volume of investments into debt obligations decreased, which let USD restore part of yesterday’s loss.
Today 3-day Economic Policy Symposium starts in Jackson Hole. Tomorrow Janet Yellen speech is expected. Her commentaries upon inflation, terms and volumes of balance-sheet reduction of the US regulator will greatly affect the dynamics of the price in the short term. Today the Initial Jobless Claims publication is worth traders’ attention. The expected growth of index will let the USD/JPY pair fall further.
Support and resistance
On the daily chart the pair began to grow from the support level of 108.85. Bollinger Bands are pointed downwards; the price range is stable, which reflects the development of the current trend. MACD histogram is in the negative zone; its volumes are decreasing, keeping a strong signal to open short positions. Stochastic doesn’t give clear signals to enter the market.
Support levels: 108.85, 108.60, 108.20.
Resistance levels: 109.40, 109.90, 110.35, 111.10.
Trading tips
Long positions can be opened above the level of 109.40 with the target around 110.30 and stop loss at 109.10. Implementation period: 1–2 days.
Short positions can be opened below the level of 109.00 with the target around 108.60, 108.40 and stop loss at 109.20. Implementation period: 1–2 days.
LiteForex аналитика. USD/JPY: общий анализ
Текущая динамика
Вчера пара находилась под давлением на фоне падения объёмов продаж новых домов в США. Кроме того, Индекс PMI Markit снизился до 52,5 базовых пункта, что ниже прогноза на 0,8 пункта. Сегодня Япония опубликовала отчёт по инвестициям в иностранные облигации. Объём инвестирования в долговые обязательства извне сократился, что позволило американскому доллару отыграть часть потерь вчерашнего дня.
Сегодня стартует трёхдневный экономический саммит в Джексон Хоул. Завтра в рамках форума прогнозируется выступление главы ФРС Джанет Йеллен. Её комментарии по инфляции, а также по срокам и объёмам сокращения баланса Американского регулятора будут играть ключевую роль для дальнейшего формирования цены торгового инструмента в краткосрочной перспективе. Сегодня необходимо обратить внимание на публикацию данных по числу заявок на пособие по безработице в США. Прогнозируемый рост первичных обращений будет способствовать дальнейшему снижению USD/JPY.
Уровни поддержки и сопротивления
На дневном графике пара возобновила рост от поддержки 108.85. Полосы Боллинджера устремлены вниз, ценовой диапазон остаётся стабильным, что служит основанием для продолжения текущего тренда. Гистограмма MACD находится в отрицательной зоне, объёмы её снижаются, сохраняя сильный сигнал для открытия позиций на продажу. «Стохастик» не даёт чётких сигналов для входа в рынок.
Уровни поддержки: 108.85, 108.60, 108.20.
Уровни сопротивления: 109.40, 109.90, 110.35, 111.10.
Торговые сценарии
Длинные позиции можно открывать выше уровня 109.40 с целью в районе 110.30 и стоп-лоссом на уровне 109.10. Срок реализации: 1-2 дня.
Короткие позиции можно открывать ниже уровня 109.00 с целью в районе 108.60, 108.40 и стоп-лоссом на уровне 109.20. Срок реализации: 1-2 дня.
LiteFinance
WTI Crude Oil: price consolidates
Current trend
Today the price of WTI is trading near the level of 47.60, to where it corrected after the publication of the API Weekly Crude Oil Stock data.
The report demonstrated another decline in reserves though smaller than in the previous two weeks (only for 3.6 million barrels). The instrument is not able to begin its growth even though there are supply disruptions from the Sharara oil field in Libya and a decision of one of the world’s largest miners BHP Billiton to sell its US shale assets due to their underperformance. Markets have paused as investors are waiting for the publication of the EIA Crude Oil Stock Change tonight that could also show a smaller decline in reserves, which might still pressure the instrument.
Support and resistance
The price fell below the middle MA of Bollinger Bands and could continue falling towards 47.10 (38.2% Fibonacci correction) and 46.15 (50% correction). Crucial for Bulls seems to be the level of 47.80 (middle MA of Bollinger Bands), a breakout of which would lead to a growth towards a cluster of 23.6% corrections (48.40 and 49.00). Technical indicators do not give a clear signal representing an uncertainty of the market before the news release. The Stochastic is directed down, Bollinger bands up while MACD histogram is near the zero line and its volumes are insignificant.
Support levels: 47.10, 46.15, 45.20.
Resistance levels: 47.80, 48.40, 49.00.
Trading tips
Short positions can be opened from the level of 47.10 with the target at 46.15 and stop-loss at 47.50.
Long positions can be opened after the price consolidation above the level of 47.80 with targets at 48.40, 49.00 and stop-loss at 47.40.
WTI crude oil: цена консолидируется
Текущая динамика
Сегодня нефть WTI торгуется в районе отметки 47.60, куда цена скорректировалась после выхода еженедельных данных по запасам нефти от Американского института Нефти.
Отчёт продемонстрировал новое сокращение запасов, но значительно меньшее, чем за две предыдущие недели (всего на 3,6 млн баррелей). Начать рост котировки пока не могут, несмотря на перебои в поставках с крупнейшего месторождения Шарара в Ливии и сообщений о решении одной из крупнейших мировых горнодобывающих компаний BHP Billiton выйти из бизнеса по добыче сланцевой нефти, поскольку тот считается недостаточно прибыльным. Выжидательная позиция рынка связана с публикацией вечером отчёта по запасам нефти от EIA, который также может показать несколько меньше сокращение, что может оказать новое давление на котировки.
Уровни поддержки и сопротивления
Цена опустилась ниже средней линии Полос Боллинджера и может продолжить снижение в район 47.10 (коррекция Фибоначчи 38,2%) и 46.15 (коррекция 50,0%). Ключевым для «быков» видится уровень 47.80 (средняя линия Полос Боллинджера), пробой которого может привести к росту в район скопления коррекций Фибоначчи 23,6% (48.40 и 49.00). Технические индикаторы не дают чёткого сигнала, иллюстрируя неопределённость рынка перед новостями. Стохастик направлен вниз, полосы Боллинджера вверх, а гистограмма MACD находится у нулевой линии, объёмы её незначительны.
Уровни поддержки: 47.10, 46.15, 45.20.
Уровни сопротивления: 47.80, 48.40, 49.00.
Торговые сценарии
Короткие позиции можно открывать от уровня 47.10 с целью 46.15 и стоп-лоссом на отметке 47.50.
При закреплении цены выше отметки 47.80 актуальными станут длинные позиции с целями 48.40, 49.00 и защитным приказом 47.40.
LiteFinance
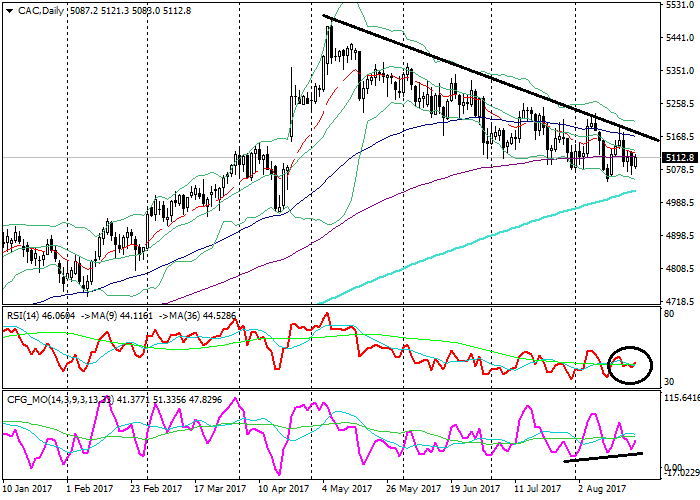
LiteForex CAC: technical analysis
CAC, D1
On the daily chart, the instrument is growing towards the middle MA of Bollinger Bands. The price remains above the SMA200, and just below the EMA14, EMA65 and EMA130 that start turning down. The RSI is testing its longer MA from above. The Composite keeps forming a Bullish divergence with the price.
CAC, H4
On the 4-hour chart, the instrument is trading just above the middle MA of Bollinger Bands. The price remains below the EMA65, EMA130 and SMA200 that are directed down. Both the RSI and Composite have formed a Bullish divergence with the price.
Key levels
Support levels: 5050.0 (local lows), 5010.0 (November 2015 highs), 4972.0 (April lows).
Resistance levels: 5128.0 (local highs), 5167.0 (April gap), 5180.0 (local highs).
Trading tips
The price is likely to retest its medium-term descending trendline.
Long positions can be opened form the level of 5128.0 with targets at 5167.0, 5180.0 and stop-loss at 5107.0. Validity – 3-5 days.
Short positions can be opened from the level of 5050.0 with targets at 5010.0, 4972.0 and stop-loss at 5075.0. Validity – 3-5 days.
LiteForex аналитика. CAC: технический анализ
CAC, D1
На дневном графике инструмент растёт к средней линии Полос Боллинджера. Цена находится выше SMA200 и немного ниже EMA14, EMA65 и EMA130, разворачивающимися вниз. RSI сверху тестирует свою долгосрочную MA. Composite продолжает формировать «бычье» расхождение с ценой.
CAC, H4
На 4-часовом графике инструмент торгуется прямо над средней линией Полос Боллинджера. Цена находится ниже EMA65, EMA130 и SMA200, направленными вниз. И RSI, и Composite сформировали «бычье» расхождение с ценой.
Ключевые уровни
Уровни поддержки: 5050.0 (локальные минимумы), 5010.0 (максимумы ноября 2015 года), 4972.0 (минимумы апреля).
Уровни сопротивления: 5128.0 (локальные максимумы), 5167.0 (апрельский гэп), 5180.0 (локальные максимумы).
Торговые сценарии
Цена, по всей видимости, протестирует свою среднесрочную нисходящую линию тренда.
Длинные позиции можно открывать от уровня 5128.0 с целями 5167.0, 5180.0 и стоп-лоссом на отметке 5107.0. Срок реализации — 3-5 дней.
Короткие позиции можно открывать от уровня 5050.0 с целями 5010.0, 4972.0 и стоп-лоссом на отметке 5075.0. Срок реализации — 3-5 дней.
CAC, D1
On the daily chart, the instrument is growing towards the middle MA of Bollinger Bands. The price remains above the SMA200, and just below the EMA14, EMA65 and EMA130 that start turning down. The RSI is testing its longer MA from above. The Composite keeps forming a Bullish divergence with the price.
CAC, H4
On the 4-hour chart, the instrument is trading just above the middle MA of Bollinger Bands. The price remains below the EMA65, EMA130 and SMA200 that are directed down. Both the RSI and Composite have formed a Bullish divergence with the price.
Key levels
Support levels: 5050.0 (local lows), 5010.0 (November 2015 highs), 4972.0 (April lows).
Resistance levels: 5128.0 (local highs), 5167.0 (April gap), 5180.0 (local highs).
Trading tips
The price is likely to retest its medium-term descending trendline.
Long positions can be opened form the level of 5128.0 with targets at 5167.0, 5180.0 and stop-loss at 5107.0. Validity – 3-5 days.
Short positions can be opened from the level of 5050.0 with targets at 5010.0, 4972.0 and stop-loss at 5075.0. Validity – 3-5 days.
LiteForex аналитика. CAC: технический анализ
CAC, D1
На дневном графике инструмент растёт к средней линии Полос Боллинджера. Цена находится выше SMA200 и немного ниже EMA14, EMA65 и EMA130, разворачивающимися вниз. RSI сверху тестирует свою долгосрочную MA. Composite продолжает формировать «бычье» расхождение с ценой.
CAC, H4
На 4-часовом графике инструмент торгуется прямо над средней линией Полос Боллинджера. Цена находится ниже EMA65, EMA130 и SMA200, направленными вниз. И RSI, и Composite сформировали «бычье» расхождение с ценой.
Ключевые уровни
Уровни поддержки: 5050.0 (локальные минимумы), 5010.0 (максимумы ноября 2015 года), 4972.0 (минимумы апреля).
Уровни сопротивления: 5128.0 (локальные максимумы), 5167.0 (апрельский гэп), 5180.0 (локальные максимумы).
Торговые сценарии
Цена, по всей видимости, протестирует свою среднесрочную нисходящую линию тренда.
Длинные позиции можно открывать от уровня 5128.0 с целями 5167.0, 5180.0 и стоп-лоссом на отметке 5107.0. Срок реализации — 3-5 дней.
Короткие позиции можно открывать от уровня 5050.0 с целями 5010.0, 4972.0 и стоп-лоссом на отметке 5075.0. Срок реализации — 3-5 дней.
LiteFinance
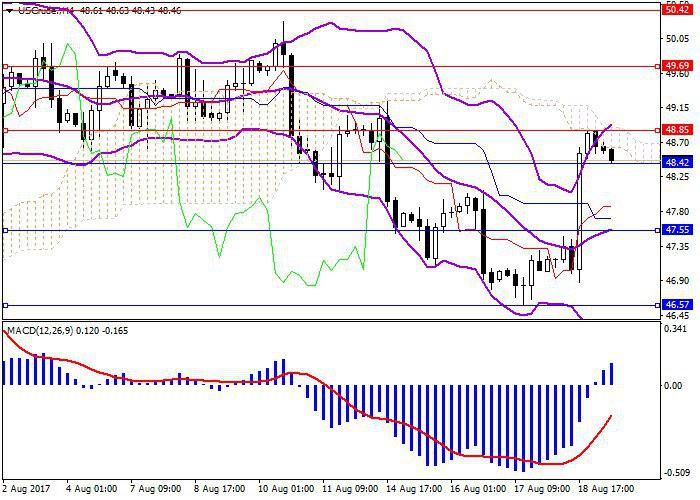
WTI Crude Oil: general review
Current trend
Oil prices grew rapidly after the release of the data from Baker Hughes on Friday indicating the reduction in the number of active drilling rigs in the USA by 5 to 763 which is the biggest reduction of the indicator in the last 7 months. In view of this the quotes of WTI grew by 3.38% to 48.60.
Oil prices were additionally supported by the news that Exxon Mobil Corp decided to close one of the biggest refineries in the USA. Today WTI quotes are gradually reducing in the framework of downward correction.
Support and resistance
In he absence of growth drivers downward correction is likely to continue in the near future. The main target of correction seems to be the level of 47.55 that coincides with the middle line of Bollinger Bands. After reaching this level the price is likely to move back to 48.85. One may speak about downward movement after the price consolidates below 47.55. In this case the next target of the sellers will be 46.57.
Technical indicators show the preservation of the upward trend but do not exclude the possibility of downward correction. MACD histogram is growing in the positive zone indicating preserved influence of the buyers. Bollinger Bands diverge confirming the upward trend. However, the price has broken through the upper line of Bollinger Bands which indicates the possibility of downward correction of the rate to 47.55 corresponding to the middle line of Bollinger Bands. One may speak about the continuation of the upward trend after the price consolidates above 48.85.
Support levels: 48.42, 47.55, 46.57.
Resistance levels: 48.85, 49.69, 50.42.
Trading tips
Sell positions may be opened below 48.42 with targets at 47.55 and stop-loss at 48.70.
Buy positions may be opened after the price is fixed above 48.85 with the nearest target at 49.69 and stop-loss at 48.55.
WTI Crude Oil: общий обзор
Текущая динамика
Нефтяные цены резко выросли после появления в пятницу данных от Baker Hughes, указавших на сокращение активных буровых установок в США на 5 единиц до 763 штук, что является максимальным сокращением показателя за последние 7 месяцев. На этом фоне котировки WTI подскочили на 3,38% в район 48.60.
Дополнительную поддержку нефтяным ценам оказали новости о том, что Exxon Mobil Corp решила закрыть один из крупнейших нефтеперерабатывающих заводов в США.
Сегодня котировки WTI плавно снижаются в рамках нисходящей коррекции.
Уровни поддержки и сопротивления
В отсутствие драйверов роста вероятно продолжение нисходящей коррекции в ближайшей перспективе. Главной целью коррекции видится уровень 47.55, соответствующий средней линии полос Боллинджера. По достижении этого уровня вновь вероятен отскок курса и движение в район 48.85. Говорить о формировании нисходящего движения можно будет после закрепления курса ниже уровня 47.55. В таком случае следующей целью продавцов выступит уровень 46.57.
Технические индикаторы указывают на сохранение восходящей тенденции, при этом не исключая вероятность нисходящей коррекции. Гистограмма MACD растёт в положительной зоне, указывая на сохранение влияния покупателей. Полосы Боллинджера расходятся, подтверждая текущую восходящую тенденцию. Однако цена пробила верхнюю линию полос Боллинджера, что указывает на вероятность нисходящей коррекции курса в район 47.55, соответствующий средней линии полос Боллинджера. Говорить о продолжении восходящей тенденции можно будет после закрепления цены выше уровня 48.85.
Уровни поддержки: 48.42, 47.55, 46.57.
Уровни сопротивления: 48.85, 49.69, 50.42.
Торговые сценарии
Позиции на продажу можно открывать ниже уровня 48.42 с ближайшей целью в районе 47.55 и стоп-лоссом на уровне 48.70.
Позиции на покупку открываем после уверенного пробоя и закрепления курса выше уровня 48.85 с целью в районе 49.69 и стоп-лоссом на уровне 48.55.
LiteFinance
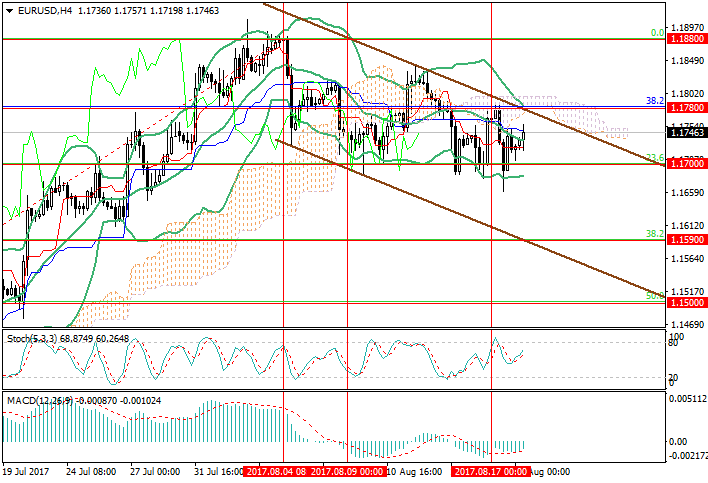
EUR/USD: the pair is trading in the downward channel
Current trend
On Thursday the pair tested the level of 1.1700 (Fibonacci correction 23.6%) again, but couldn’t consolidate below it and began to grow after the poor July US Industrial production data publication (the indicator decreased from 0.4% to 0.2%). At the moment the price is trading around the middle line of Bollinger Bands (1.1740) due to controversial factors. EUR is under the pressure of the terrorist acts in Spain, as USD is affected by the conflict in Trump’s administration. The rumors about the chief President economic advisor Gary D. Cohn resign were not confirmed, which slowed the fall of the US currency.
Yesterday the Head of FRB Robert S. Kaplan mentioned that the politics and investors should be patient and reasonable in waiting for the new interest rate rise. He also said that the balance-sheet reduction process can be started in the nearest future, while it’s better to wait for the stable growth of the inflation before the interest rate rise, which disappointed the market.
Support and resistance
Technically the pair is trading within the downward channel and is tending to its upper border at the area of 1.1780 (Fibonacci correction 38.2% for the long term trend). In case of breakout the price can grow to August highs at the level of 1.1880. In case of reversal around 1.1780 the fall to the key support level of 1.1700 (Fibonacci correction 23.6%, Murray [8/8]) is possible.
Support levels: 1.1700, 1.1590, 1.1500.
Resistance levels: 1.1780, 1.1880, 1.1950.
Trading tips
Short positions can be opened at the current price or at the level of 1.1780 with the targets at 1.1700 and 1.1590 from stop loss at around 1.1810.
If the price is set above the level of 1.1780, long positions will become relevant with the target at 1.1880 and stop loss at 1.1760.
EUR/USD: пара торгуется в нисходящем канале
Текущая динамика
В четверг пара вновь протестировала отметку 1.1700 (коррекция Фибоначчи 23,6%), но закрепиться ниже неё не смогла и начала рост после публикации слабых июльских данных по промышленному производству в США (показатель снизился с 0,4% до 0,2%). В настоящее время цена находится в районе средней линии полос Боллинджера (1.1740) под влиянием противоположных факторов. Евро испытывает давление после серии терактов в Испании, а американский доллар переживает последствия конфликта в администрации Трампа. Cлухи о том, что главный экономический советник президента по экономическим вопросам Гэри Кон собирается подавать в отставку, не оправдались, замедлило падение американской валюты.
Вчера председатель ФРБ Даллас Роберт Каплан отметил, что политики и инвесторы должны быть очень терпеливыми и рассудительными в ожидании нового повышения процентной ставки. Также он сказал, что процесс сокращения баланса ФРС можно начинать в ближайшем будущем, но для повышения ставки нужно дождаться стабильного роста инфляции. Эти комментарии разочаровали рынок.
Уровни поддержки и сопротивления
Технически пара торгуется в рамках нисходящего канала и стремится к его верхней границе в район 1.1780 (коррекция Фибоначчи 38,2% для долгосрочного тренда). При пробое этого уровня возможно продолжение роста к августовским максимумам 1.1880. В случае разворота в районе 1.1780 вероятно снижение к ключевой поддержке 1.1700 (коррекция Фибоначчи 23,6%, уровень Мюррея [8/8]).
Уровни поддержки: 1.1700, 1.1590, 1.1500.
Уровни сопротивления: 1.1780, 1.1880, 1.1950.
Торговые сценарии
Короткие позиции можно открывать по текущей цене или от уровня 1.1780 с целями 1.1700 и 1.1590 с защитным приказом в районе 1.1810.
При закреплении цены выше отметки 1.1780 стоит открывать длинные позиции с целью 1.1880 и защитным приказом 1.1760.
LiteFinance
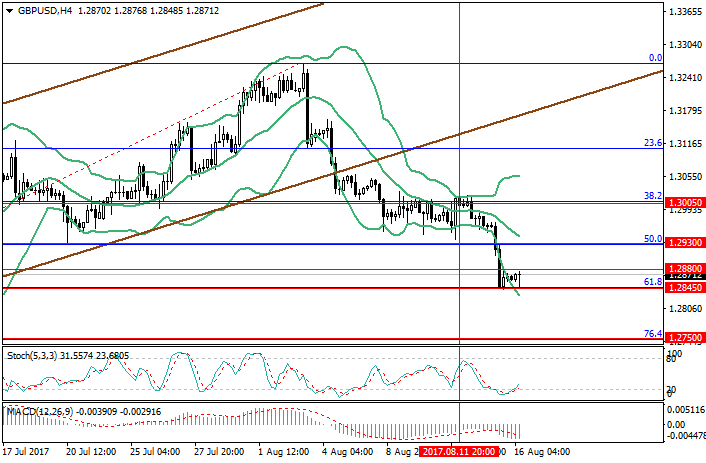
GBP/USD: pound is under the pressure of high inflation
Current trend
On Tuesday the pair was rapidly corrected to the level of 1.2845 (Fibonacci correction 61.8%). US dollar was supported by strong July Retail Sales data (in July the index grew by 0.6%) and new rumors upon the soon Fed’s interest rate rise. On the other hand, pound is under the pressure of June UK Consumer Price Index, which stayed at the same high level of 2.6%, as the fall of fuel prices was balance by the growth of food prices.
The long term maintenance of the high level of inflation raises concerns of market, as the earning index in the UK don’t keep pace with the Consumer Price Index growth, which leads to the impoverishing of the households, fall of retail sales and pressure on the GDP.
Today the Average Earnings data will be published in the UK, the index including bonus is expected to stay on the same level of 2.0% and index excluding bonus — on the level of 1.8% In this case the pair can decrease further. In addition, investors are waiting for the employment market data in the UK, which are expected to be more positive. The decrease of unemployment level from 5.9K to 3.7K is expected in June.
Support and resistance
Technically the pair is trading within the narrow sideways range of 1.2845 (Fibonacci correction 61.8%) and 1.2880 (Murray [3/8]), waiting for the employment and earnings data. In case of breakout of the upper border of the range the price can grow to the levels of 1.2930 (Fibonacci correction 50.0%, the middle line of Bollinger Bands) and 1.3005 (Fibonacci correction 38.2%, Murray [5/8]). The consolidation of the price below the level of 1.2845 can let it go down to the area of 1.2800 and 1.2750 (Fibonacci correction 61.8%).
Support levels: 1.2845, 1.2800, 1.2750.
Resistance levels: 1.2880, 1.2930, 1.3005.
Trading tips
Long positions can be opened after the breakout of the level of 1.2880 with the targets at 1.2930, 1.3005 and stop loss around 1.2840.
Short positions can be opened below the level of 1.2845 with the targets at 1.2800, 1.2750 and stop loss at 1.2880.
GBP/USD: высокая инфляция давит на фунт
Текущая динамика
Во вторник пара резко скорректировалась к отметке 1.2845 (коррекция Фибоначчи 61,8%). Американский доллар получил поддержку сильных июльских данных по розничным продажам (в июле показатель вырос на 0,6%) и новых спекуляций вокруг скорого повышения ФРС процентной ставки. С другой стороны, фунт оказался под давлением июльской статистики по индексу потребительских цен в Великобритании, который остался на прежнем высоком уровне 2,6%, потому что снижение цен на топливо было компенсировано ростом цен на продукты питания.
Сохранение высокой инфляции на протяжении значительного временного периода вызывает опасение рынка, поскольку рост заработной платы в Великобритании явно не успевает за ростом индекса потребительских цен, что ведет к обеднению домохозяйств, снижению розничных продаж и давлению на ВВП. Сегодня выйдут данные по уровню средней заработной платы в Великобритании, показатель обещает остаться на прежнем уровне 2,0% для зарплаты с учетом премий и на уровне 1,8% для зарплаты без учета премий. Реализация этих прогнозов может привести к дальнейшему снижению пары. Стоит отметить, что сегодня инвесторы ждут также данных с рынка труда Великобритании, которые обещают быть не столь печальны. В июне прогнозируется снижение количества безработных с 5,9 тысяч до 3,7 тысяч.
Уровни поддержки и сопротивления
Технически пара сейчас торгуется в узком боковом диапазоне 1.2845 (коррекция Фибоначчи 61,8%) и 1.2880 (уровень Мюррея [3/8]), ожидая выхода статистики по заработной плате и занятости. При пробое верхней границы диапазона котировки могут подняться к отметкам 1.2930 (коррекция Фибоначчи 50,0%, средняя линия полос Боллинджера) и 1.3005 (коррекция Фибоначчи 38,2%, уровень Мюррея [5/8]). Закрепление цены ниже отметки 1.2845 может привести к снижению в район 1.2800 и 1.2750 (коррекция Фибоначчи 61,8%).
Уровни поддержки: 1.2845, 1.2800, 1.2750.
Уровни сопротивления: 1.2880, 1.2930, 1.3005.
Торговые сценарии
Длинные позиции стоит открывать при пробое вверх отметки 1.2880 с целями 1.2930, 1.3005 и защитным приказом в районе 1.2840.
Короткие позиции можно будет открывать ниже отметки 1.2845 с целями 1.2800, 1.2750 и защитным приказом 1.2880.
LiteFinance
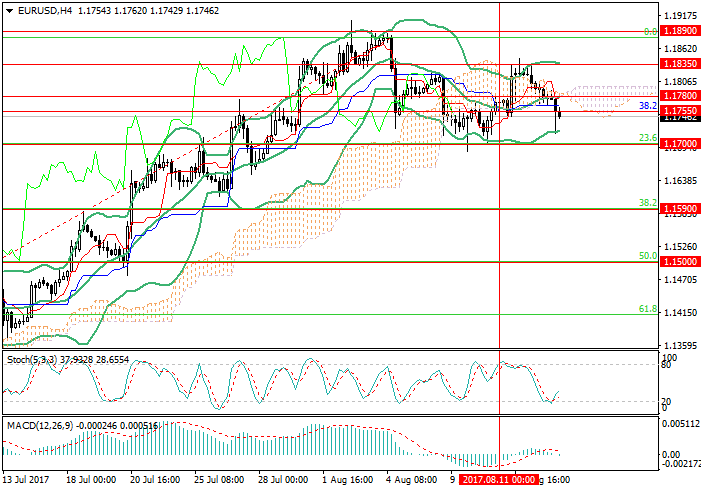
EUR/USD: waiting for the US retail sales
Current trend
The pair started the week with a fall in view of negative data from the EU. Monday data on industrial output in Eurozone were weak: in June the indicator dropped by 0.6% MoM and grew by 2.6% YoY but failed to reach the forecast values. Initial German GDP data for Q2 2017 released today appeared to be much lower than expected. In quarterly terms the indicator grew by 0.6% against the expected 0.7%, and YoY by 0.8% instead of the expected 1.9% which is the smallest growth since 2013. Today USD may continue to strengthen in view of the upcoming release of July data on retail sales from the USA. Both indicators (the general one and the one without fuel and cars) may grow by 0.4% after July decrease by 0.2%. Still, the price is not likely to consolidate below the key support level of 1.1700.
Support and resistance
Technically the price is around 1.1755 (Fibo correction 38.2% for the long-term trend). After the release of strong US data on retail sales it may reach a key support level at 1.1700 (23.6% correction for the medium-term trend, Murrey level [8/8]). If this level is broken down, the price may go down to 1.1590 (Fibo correction 38.2%, Murrey level [7/8]). Otherwise the quotes may return to August maximums at 1.1890.
Support levels: 1.1700, 1.1590, 1.1500.
Resistance levels: 1.1755, 1.1835, 1.1890.
Trading tips
In the current situation short positions may be opened from the current level with targets at 1.1700 and 1.1590. Stop-loss may be placed at 1.1780.
In case of reversal of the price around 1.1700 long positions may be opened with targets at 1.1780, 1.1835, 1.1890 and stop-loss at 1.1670.
EUR/USD: в ожидании американских розничных продаж
Текущая динамика
Пара начала неделю снижением на фоне негативных данных из ЕС. В понедельник вышли слабые данные по промышленному производству еврозоны: показатель в июне снизился на 0,6% в месячном исчислении и вырос на 2,6%, но не дотянул до прогнозов в годовом. Сегодня неубедительно выглядят предварительные данные по ВВП Германии за второй квартал текущего года, оказавшиеся значительно ниже прогнозов. В квартальном исчислении показатель вырос на 0,6% вместо ожидаемых 0,7%, а в годовом только на 0,8%, вместо ожидаемых 1,9%, что является самым незначительным ростом с 2013 года. Сегодня укрепление доллара может продолжиться, поскольку ожидается выход позитивных июльских данных по розничным продажам в США. Оба показателя (общий и без учёта продаж топлива и автомобилей) могут вырасти на 0,4% после июньского снижения на 0,2%. Тем не менее, вряд ли цена может закрепиться ниже ключевой поддержки 1.1700.
Уровни поддержки и сопротивления
Технически цена находится в районе 1.1755 (коррекция Фибо 38,2% для долгосрочного тренда). При публикации сильных американских данных по розничным продажам она может достигнуть ключевого на текущий момент уровня поддержки в районе 1.1700 (коррекция 23,6% для среднесрочного тренда, уровень Мюррея [8/8]). Если этот уровень будет пробит, то цена может пойти ниже к отметке 1.1590 (коррекция Фибо 38,2%, уровень Мюррея [7/8]). В противном случае котировки могут вернуться к августовским максимумам в район 1.1890.
Уровни поддержки: 1.1700, 1.1590, 1.1500.
Уровни сопротивления: 1.1755, 1.1835, 1.1890.
Торговые сценарии
В сложившейся ситуации короткие позиции можно открывать по текущей цене с целями 1.1700 и 1.1590. Защитный приказ можно выставить в районе 1.1780.
При развороте цены в районе 1.1700 стоит открывать длинные позиции с целями 1.1780, 1.1835, 1.1890 и защитным приказом 1.1670.
LiteFinance
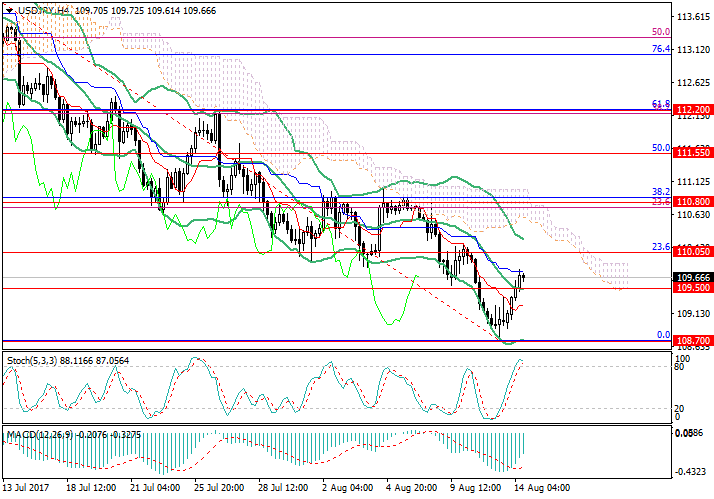
USD/JPY: yen is under pressure
Current trend
The pair started the week with growth to the level of 109.65. Although initial GDP data of Japan for Q2 2017 showed growth (from 1.5% to 4.0% YoY and from 0.3% to 1.0% MoM), yen is weakening. It is under pressure from July data on industrial output and retail sales in China that were the worst since January 2017.
The situation in the Japanese economy is also uncertain. The growth of GDP in Q2 2017 was caused by increased internal demand and consumer spending. However, durable goods account for a considerable part of them, which may indicates that the costs are seasonal, and that in the future the tendency for their increase would not preserve and new pressure will be put on the GDP volume.
Support and resistance
Technically the price grew above the middle line of Bollinger Bands (109.50) and is aiming at 110.05 (Fibo correction 23.6%). If this level is broken out, growth may continue to 110.80 (gathering of Fibo corrections 23.6% and 38.2%) and 111.55 (Fibo correction 50.0%). However, one cannot exclude the reversal and return of the price to August minimums at 108.70. Technical indicators show mixed signals: MACD histogram is reducing in the negative zone, and Stochastic is turning downwards to the overbought zone.
Support levels: 109.50, 108.70, 108.00.
Resistance levels: 110.05, 110.80, 111.55, 112.20.
Trading tips
In this situation, short positions could be opened below 109.50 with target at 108.70. Stop-loss order may be placed at 109.80.
If the price consolidates above 110.05, long positions could be opened with target at 110.80, 111.55 and stop-loss at 109.70.
USD/JPY: иена под давлением
Текущая динамика
Пара начала неделю ростом к отметке 109.65. Несмотря на то, что предварительные данные ВВП Японии за второй квартал текущего года продемонстрировали рост (с 1,5% до 4,0% в годовом и с 0,3% до 1,0% в месячном исчислении), иена значительно слабеет. Давление на неё оказывают июльские данные по промышленному производству и розничным продажам в Китае, которые оказались худшими с января текущего года.
Ситуация в японской экономике также неоднозначна. Рост ВВП во втором квартале текущего года был обеспечен увеличением внутреннего спроса и потребительских расходов. Однако значительная их доля приходится на товары длительного пользования, что может говорить о сезонности трат и том, что в будущем тенденция к их увеличению не сохранится, что создаст новое давление на объём ВВП.
Уровни поддержки и сопротивления
Технически цена поднялась выше средней линии полос Боллинджера (109.50) и стремится в район 110.05 (коррекция Фибо 23,6%). При пробое этого уровня вверх рост может продолжиться к отметкам 110.80 (скопление коррекций Фибо 23,6% и 38,2%) и 111.55 (коррекция Фибо 50,0%). Однако исключать разворот и возвращение цены к августовским минимумам в район 108.70 нельзя. Технические индикаторы дают противоположные сигналы: гистограмма MACD уменьшается в отрицательной зоне, а Стохастик разворачивается вниз в зоне перекупленности.
Уровни поддержки: 109.50, 108.70, 108.00.
Уровни сопротивления: 110.05, 110.80, 111.55, 112.20.
Торговые сценарии
В сложившейся ситуации короткие позиции можно будет открывать ниже отметки 109.50 с целью 108.70. Защитный приказ можно выставить в районе 109.80.
При закреплении цены выше отметки 110.05 стоит открывать длинные позиции с целями 110.80, 111.55 и защитным приказом 109.70.
LiteFinance
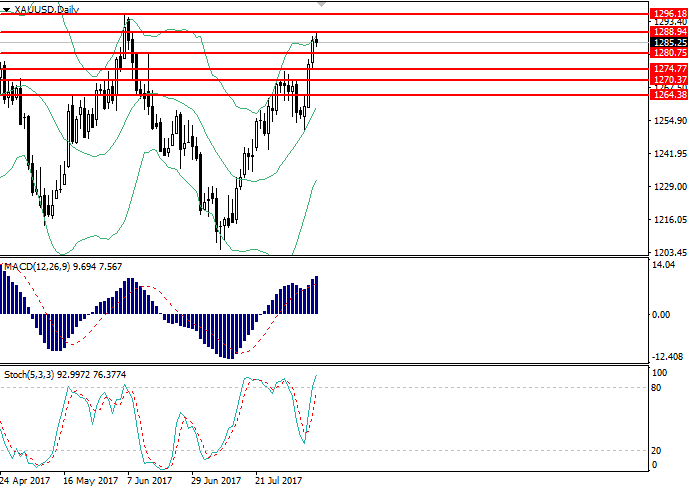
XAU/USD: general analysis
Current trend
XAU/USD is strengthening due to the poor macroeconomic statistic publication in the USA and political tense between USA and North Korea.
Yesterday the Initial Jobless Claims data were published, which were worse than expected: the index grew from 241 to 244K, as the experts supposed the fall to 240K. In addition, the July Producer Price Index unexpectedly falls by 0.1%, which resulted in the decrease of the YoY indicator. The USD is also under the pressure due to New York Fed’s president William Dudley’s statement, who expressed the fear of the low inflation. In the current situation gold is an attractive asset for the investors in the short term.
Today’s key release is Consumer Price Index publication in the USA. If the indicator is worse than expected, the pair will too likely to renew the year highs.
Support and resistance
On the daily chart the instrument is trying to consolidate above the level of 1290.00. Bollinger Bands are pointed upwards; the price range stays the same, reflecting the high possibility of the development of the upward trend. MACD histogram is in the positive zone, keeping buy signal. Stochastic is ready to enter the overbought area.
Support levels: 1265.00, 1270.40, 1274.75, 1280.75.
Resistance levels: 1289.00, 1296.20, 1307.00.
Trading tips
Long positions can be opened at the level of 1289.50 with the target at 1300.00 and stop loss at 1286.00. Implementation period: 1–2 days.
Short positions can be opened at the level of 1280.00 with the target at 1270.25 and stop loss at 1284.00. Implementation period: 1–2 days.
XAU/USD: general analysis
Current trend
XAU/USD is strengthening due to the poor macroeconomic statistic publication in the USA and political tense between USA and North Korea.
Yesterday the Initial Jobless Claims data were published, which were worse than expected: the index grew from 241 to 244K, as the experts supposed the fall to 240K. In addition, the July Producer Price Index unexpectedly falls by 0.1%, which resulted in the decrease of the YoY indicator. The USD is also under the pressure due to New York Fed’s president William Dudley’s statement, who expressed the fear of the low inflation. In the current situation gold is an attractive asset for the investors in the short term.
Today’s key release is Consumer Price Index publication in the USA. If the indicator is worse than expected, the pair will too likely to renew the year highs.
Support and resistance
On the daily chart the instrument is trying to consolidate above the level of 1290.00. Bollinger Bands are pointed upwards; the price range stays the same, reflecting the high possibility of the development of the upward trend. MACD histogram is in the positive zone, keeping buy signal. Stochastic is ready to enter the overbought area.
Support levels: 1265.00, 1270.40, 1274.75, 1280.75.
Resistance levels: 1289.00, 1296.20, 1307.00.
Trading tips
Long positions can be opened at the level of 1289.50 with the target at 1300.00 and stop loss at 1286.00. Implementation period: 1–2 days.
Short positions can be opened at the level of 1280.00 with the target at 1270.25 and stop loss at 1284.00. Implementation period: 1–2 days.
: