LiteFinance / Profil

The online ECN broker LiteFinance (ex. LiteForex) has been providing its clients access to Tier 1 liquidity in the currency, commodity, and stock market since 2005. All major currency pairs and cross rates, oil, precious metals, stock indexes, blue chips, and the largest set of cryptocurrency pairs can be traded at LiteFinance (ex. LiteForex).
Freunde
381
Anfragen
Ausgehend

LiteFinance

GBP/USD: general review
Current trend
GBP continues strengthening due to positive economic statistics and is testing the level of 1.3244 (Murrey [5/8]).
Wednesday's data on the Services PMI in the UK proved to be strong and strengthened GBP. In June, the indicator reached the 8-month maximum at 55.1 points. According to experts, this could lead to GDP growth by 0.4% in the UK in Q2 2018 and push the Bank of England to increase the interest rate at an August meeting. However, for such a decision, inflation in the country should be above the target level of 2.0%. Currently, this indicator continues to decline and has already reached the level of 2.4%.
The situation with Brexit remains controversial. Theresa May's Cabinet developed a new plan for customs cooperation with the EU. According to it, after leaving the EU, Britain will be able to set its own tariffs on imported goods while transit products going to the EU through the UK territory will have to be taxed by the EU duties.
Support and resistance
The price is testing the level of 1.3244 (Murrey [5/8]), the breakdown of which will give the prospect of growth to 1.3305 (Murrey [6/8]), 1.3366 (Murrey [7/8]). The key level for the "bears" seems to be 1.3183 (Murrey [2/8]), midline of Bollinger Bands). If it is broken down, the price may decline to 1.3122 (Murrey [3/8]) and 1.3061 (Murrey [2/8]). Technical indicators don’t provide a clear signal. Stochastic has reversed downwards, and MACD histogram is reducing in the positive zone.
Support levels: 1.3366, 1.3305.
Resistance levels: 1.3061, 1.3122, 1.3183.
Trading tips
Buy positions may be opened from 1.3260 with targets at 1.3305, 1.3366 and stop-loss at 1.3220. Sell positions may be opened from 1.3183 with targets at 1.3122, 1.3061 and stop-loss at 1.3220.
Implementation time: 3-5 days.
GBP/USD: общий обзор
Текущая динамика
Британский фунт продолжает укрепляться на фоне позитивной экономической статистики и в настоящее время тестирует отметку 1.3244 (Мюррей [5/8]).
Опубликованные в среду данные по индексу деловой активности в сфере услуг Великобритании оказались сильными и укрепили позиции фунта. В июне показатель достиг восьмимесячного максимума на отметке 55,1 пункта. По оценкам экспертов, это может привести к росту ВВП Великобритании во втором квартале текущего года на 0,4% и подтолкнуть Банк Англии к увеличению процентной ставки уже на заседании в августе. Однако для такого решения инфляция в стране должна стабильно находиться выше целевого уровня 2,0%. В настоящее время этот показатель продолжает снижаться и уже достиг отметки 2,4%.
Ситуация с Brexit остаётся противоречивой и может серьёзно надавить на британскую валюту. Кабинет Терезы Мэй разработал новый план таможенного взаимодействия с ЕС. Суть его в том, что после выхода из Евросоюза Великобритания сможет устанавливать собственные тарифы на импортируемые товары. При этом транзитная продукция, идущая в ЕС через территорию королевства, должна будет облагаться пошлинами Евросоюза. Однако перспективы реализации этого плана туманны, главный британский переговорщик Дэвид Дэвис уже назвал его неработоспособным.
Уровни поддержки и сопротивления
Сейчас цена тестирует отметку 1.3244 (Мюррей [5/8]), пробой которой даст перспективу роста цены к уровням 1.3305 (Мюррей [6/8]), 1.3366 (Мюррей [7/8]). Ключевой для «медведей» видится отметка 1.3183 (Мюррей [2/8], средняя линия полос Боллинджера). При её пробое вниз вероятно снижение цены к отметкам 1.3122 (Мюррей [3/8]) и 1.3061 (Мюррей [2/8]). Технические индикаторы единого сигнала не дают. Стохастик развернулся вниз, а гистограмма MACD растёт в положительной зоне.
Уровни поддержки: 1.3305, 1.3366.
Уровни сопротивления: 1.3183, 1.3122, 1.3061.
Торговые сценарии
Покупать можно от уровня 1.3260 целями 1.3305, 1.3366 и стоп-лоссом у отметки 1.3220.
Продавать стоит ниже отметки 1.3183 с целями 1.3122, 1.3061 и стоп-лоссом на уровне 1.3220.
Срок реализации: 3-5 дней.
LiteFinance
USD/JPY: general review
Current trend
This week, the pair is corrected downwards due to weak economic statistics from Japan.
Tankan Large Manufacturing Index in Q2 2018 dropped from 24 to 21 points and Manufacturing PMI in June dropped from 53.1 to 53.0 points.
Also, JPY is under pressure of the decision of the People's Bank of China not to use the yuan as a weapon in the trade war with the US. This was announced by the head of the Chinese regulator Yi Gang. In general, the potential to strengthen JPY as a safe haven asset remains, especially if the US-China trade conflict continues to worsen.
In addition, on Wednesday, the Japanese Bank of Japan board member Yutaka Harada addressed the leaders of Japanese business. The official noted that the current level of unemployment in the country (2.2%) is too high and to achieve inflation level of 2.0% it is necessary to further reduce it. Therefore, the Bank of Japan intends to continue soft monetary policy.
Support and resistance
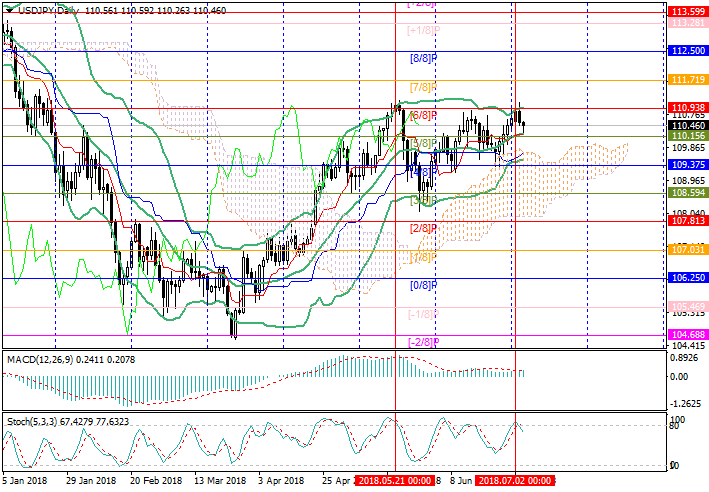
The price has fallen to the midline of Bollinger Bands to 110.15. The breakdown of this level will give the prospect of further decline to 109.37 (Murrey [4/8], the bottom line of Bollinger Bands) and 108.59 (Murrey [5/8]). This possibility is indicated by Stochastic which has left the overbought area. The key to the "bulls" is 110.93 (Murrey [6/8]), which was tested unsuccessfully in May. Consolidation of the price above it will cause an increase to 111.72 (Murrey [7/8]) and 112.50 (Murrey [8/8]).
Support levels: 110.15, 109.37, 108.59.
Resistance levels: 110.93, 111.72, 112.50.
Trading tips
Buy positions can be opened above 110.93 with targets at 111.72, 112.50 and stop-loss at 110.50.
Sell positions may be opened below 110.15 with targets at 109.37, 108.59 and stop-loss at 110.40.
Implementation period: 3-5 days.
USD/JPY: общий обзор
Текущая динамика
На текущей неделе пара корректируется вниз из-за слабой экономической статистики из Японии.
Индекс деловой активности крупнейших производителей Японии Tankan во втором квартале текущего года снизился с 24 до 21 пункта, а июньский индекс деловой активности в производственном секторе Японии снизился с 53,1 до 53,0 пункта.
Также давление на японскую валюту оказывает решение Народного банка Китая не использовать юань как оружие в торговой войне с США и сохранять его стабильность. Об этом накануне заявил глава китайского регулятора Йи Ганг. В целом, потенциал укрепления иены как актива-убежища по-прежнему сохраняется, особенно в случае продолжения обострения американо-китайского торгового конфликта.
Отметим также, что в среду перед лидерами японского бизнеса выступил член правления Банка Японии Ютака Харада. Чиновник отметил, что нынешний уровень безработицы в стране (2,2%) слишком высок и для достижения инфляцией уровня 2,0% необходимо его дальнейшее снижение. Поэтому Банк Японии намерен в ближайшее время продолжать мягкую денежно-кредитную политику.
Уровни поддержки и сопротивления
В настоящее время цена опустилась к средней линии полос Боллинджера в район 110.15. Пробой этой отметки вниз даст перспективу дальнейшего снижения к уровням 109.37 (Мюррей [4/8], нижняя линия полос Боллинджера) и 108.59 (Мюррей [5/8]). О такой возможности говорит Стохастик, который вышел из зоны перекупленности. Ключевой для «быков» видится отметка 110.93 (Мюррей [6/8]), которую пара безуспешно тестировала в мае. Закрепление цены выше неё вызовет рост к уровням 111.72 (Мюррей [7/8]) и 112.50 (Мюррей [8/8]).
Уровни поддержки: 110.15, 109.37, 108.59.
Уровни сопротивления: 110.93, 111.72, 112.50.
Торговые сценарии
Покупать можно выше отметки 110.93 с целями 111.72, 112.50 и стоп-лоссом у отметки 110.50.
Продавать стоит ниже отметки 110.15 с целями 109.37 и 108.59 и стоп-лоссом в районе 110.40.
Срок реализации 3-5 дней.
Current trend
This week, the pair is corrected downwards due to weak economic statistics from Japan.
Tankan Large Manufacturing Index in Q2 2018 dropped from 24 to 21 points and Manufacturing PMI in June dropped from 53.1 to 53.0 points.
Also, JPY is under pressure of the decision of the People's Bank of China not to use the yuan as a weapon in the trade war with the US. This was announced by the head of the Chinese regulator Yi Gang. In general, the potential to strengthen JPY as a safe haven asset remains, especially if the US-China trade conflict continues to worsen.
In addition, on Wednesday, the Japanese Bank of Japan board member Yutaka Harada addressed the leaders of Japanese business. The official noted that the current level of unemployment in the country (2.2%) is too high and to achieve inflation level of 2.0% it is necessary to further reduce it. Therefore, the Bank of Japan intends to continue soft monetary policy.
Support and resistance
The price has fallen to the midline of Bollinger Bands to 110.15. The breakdown of this level will give the prospect of further decline to 109.37 (Murrey [4/8], the bottom line of Bollinger Bands) and 108.59 (Murrey [5/8]). This possibility is indicated by Stochastic which has left the overbought area. The key to the "bulls" is 110.93 (Murrey [6/8]), which was tested unsuccessfully in May. Consolidation of the price above it will cause an increase to 111.72 (Murrey [7/8]) and 112.50 (Murrey [8/8]).
Support levels: 110.15, 109.37, 108.59.
Resistance levels: 110.93, 111.72, 112.50.
Trading tips
Buy positions can be opened above 110.93 with targets at 111.72, 112.50 and stop-loss at 110.50.
Sell positions may be opened below 110.15 with targets at 109.37, 108.59 and stop-loss at 110.40.
Implementation period: 3-5 days.
USD/JPY: общий обзор
Текущая динамика
На текущей неделе пара корректируется вниз из-за слабой экономической статистики из Японии.
Индекс деловой активности крупнейших производителей Японии Tankan во втором квартале текущего года снизился с 24 до 21 пункта, а июньский индекс деловой активности в производственном секторе Японии снизился с 53,1 до 53,0 пункта.
Также давление на японскую валюту оказывает решение Народного банка Китая не использовать юань как оружие в торговой войне с США и сохранять его стабильность. Об этом накануне заявил глава китайского регулятора Йи Ганг. В целом, потенциал укрепления иены как актива-убежища по-прежнему сохраняется, особенно в случае продолжения обострения американо-китайского торгового конфликта.
Отметим также, что в среду перед лидерами японского бизнеса выступил член правления Банка Японии Ютака Харада. Чиновник отметил, что нынешний уровень безработицы в стране (2,2%) слишком высок и для достижения инфляцией уровня 2,0% необходимо его дальнейшее снижение. Поэтому Банк Японии намерен в ближайшее время продолжать мягкую денежно-кредитную политику.
Уровни поддержки и сопротивления
В настоящее время цена опустилась к средней линии полос Боллинджера в район 110.15. Пробой этой отметки вниз даст перспективу дальнейшего снижения к уровням 109.37 (Мюррей [4/8], нижняя линия полос Боллинджера) и 108.59 (Мюррей [5/8]). О такой возможности говорит Стохастик, который вышел из зоны перекупленности. Ключевой для «быков» видится отметка 110.93 (Мюррей [6/8]), которую пара безуспешно тестировала в мае. Закрепление цены выше неё вызовет рост к уровням 111.72 (Мюррей [7/8]) и 112.50 (Мюррей [8/8]).
Уровни поддержки: 110.15, 109.37, 108.59.
Уровни сопротивления: 110.93, 111.72, 112.50.
Торговые сценарии
Покупать можно выше отметки 110.93 с целями 111.72, 112.50 и стоп-лоссом у отметки 110.50.
Продавать стоит ниже отметки 110.15 с целями 109.37 и 108.59 и стоп-лоссом в районе 110.40.
Срок реализации 3-5 дней.
LiteFinance
WTI Crude Oil: general analysis
Current trend
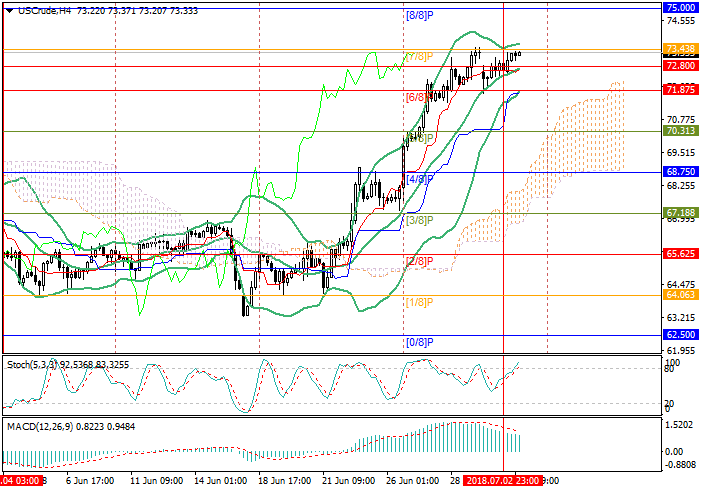
On Tuesday, oil prices grew and reached 73.35, but the market is influenced by ambiguous factors.
The risks of Libya oil supply interruptions support the instrument. Yesterday, the representatives of the Libyan National Oil Corp announced that the shipment from a number of ports is unavailable, so the reduction of production in the country by 850,000 barrels per day is expected. On the other hand, the price is under pressure of the United Arab Emirates government's statement that the country has the opportunity to significantly increase production to prevent a supply shortage in the market. Previously, Saudi Arabia said the same thing. Thus, the expected by the end of the year, Iran "black gold" export decrease will be balanced by other OPEC members’ production growth.
In the evening, investors are waiting for API Crude Oil Stocks change release. If the index falls, it will affect the price negatively.
Support and resistance
The key "bullish" level is 73.43 (Murrey [7/8]). After the breakout, the price can grow to 75.00 (Murrey [8/8]). Otherwise, a downward correction to 71.87 (the lower line of Bollinger bands, Murrey [6/8]) and 70.31 (Murrey [5/8]) is expected.
Technical indicators do not exclude the fall possibility. Bollinger bands are directed upwards. Stochastic entered the overbought zone and can reverse. MACD decreases in the positive zone.
Resistance levels: 73.43, 75.00.
Support levels: 71.87, 70.31.
Trading tips
Short positions can be opened at the level 72.80 with the targets at 71.87, 70.31 and stop loss 73.40.
Long positions can be opened when the price is set above the level of 73.43 with the target at 75.00 and stop loss around 72.80.
Implementation period: 3–5 days.
WTI Crude Oil: общий обзор
Текущая динамика
Во вторник цены на нефть росли, достигнув отметки 73.35, но рынок находится под влиянием разнонаправленных факторов.
Поддержку котировкам оказывают риски перебоев с поставками «чёрного золота» из Ливии. Вчера представители ливийской Национальной нефтяной компании заявили о невозможности отгрузки продукции из ряда портов, из-за чего ожидается снижение добычи в стране на 850 тысяч баррелей в сутки. С другой стороны, на котировки давит заявление правительства ОАЭ о том, что страна имеет возможность значительно нарастить добычу, чтобы не допустить дефицита предложения на рынке. Ранее об этом же заявляли представители Саудовской Аравии. Таким образом, ожидаемое к концу года снижение экспорта «чёрного золота» из Ирана будет компенсировано увеличением производства другими членами ОПЕК.
Вечером инвесторы ждут публикации еженедельных данных по запасам нефти в США от API. Продолжение снижения показателя может привести к дополнительному давлению на цены.
Уровни поддержки и сопротивления
Ключевой для «быков» выступает отметка 73.43 (Мюррей [7/8]), при её пробое цена может вырасти к уровню 75.00 (Мюррей [8/8]). В противном случае ожидается нисходящая коррекция к отметкам 71.87 (нижняя линия полос Боллинджера, Мюррей [6/8]) и 70.31 (Мюррей [5/8]).
Технические индикаторы не исключают возможность снижения цен. Полосы Боллинджера направлены вверх. Стохастик вошёл в зону перекупленности, что грозит разворотом, гистограмма MACD уменьшается в положительной зоне.
Уровни сопротивления: 73.43, 75.00.
Уровни поддержки: 71.87, 70.31.
Торговые сценарии
Короткие позиции можно открывать от уровня 72.80 с целями 71.87, 70.31 и стоп-лоссом 73.40.
Длинные позиции можно открывать при закреплении цены выше уровня 73.43 с целью 75.00 и стоп-лоссом в районе 72.80.
Срок реализации: 3–5 дней.
Current trend
On Tuesday, oil prices grew and reached 73.35, but the market is influenced by ambiguous factors.
The risks of Libya oil supply interruptions support the instrument. Yesterday, the representatives of the Libyan National Oil Corp announced that the shipment from a number of ports is unavailable, so the reduction of production in the country by 850,000 barrels per day is expected. On the other hand, the price is under pressure of the United Arab Emirates government's statement that the country has the opportunity to significantly increase production to prevent a supply shortage in the market. Previously, Saudi Arabia said the same thing. Thus, the expected by the end of the year, Iran "black gold" export decrease will be balanced by other OPEC members’ production growth.
In the evening, investors are waiting for API Crude Oil Stocks change release. If the index falls, it will affect the price negatively.
Support and resistance
The key "bullish" level is 73.43 (Murrey [7/8]). After the breakout, the price can grow to 75.00 (Murrey [8/8]). Otherwise, a downward correction to 71.87 (the lower line of Bollinger bands, Murrey [6/8]) and 70.31 (Murrey [5/8]) is expected.
Technical indicators do not exclude the fall possibility. Bollinger bands are directed upwards. Stochastic entered the overbought zone and can reverse. MACD decreases in the positive zone.
Resistance levels: 73.43, 75.00.
Support levels: 71.87, 70.31.
Trading tips
Short positions can be opened at the level 72.80 with the targets at 71.87, 70.31 and stop loss 73.40.
Long positions can be opened when the price is set above the level of 73.43 with the target at 75.00 and stop loss around 72.80.
Implementation period: 3–5 days.
WTI Crude Oil: общий обзор
Текущая динамика
Во вторник цены на нефть росли, достигнув отметки 73.35, но рынок находится под влиянием разнонаправленных факторов.
Поддержку котировкам оказывают риски перебоев с поставками «чёрного золота» из Ливии. Вчера представители ливийской Национальной нефтяной компании заявили о невозможности отгрузки продукции из ряда портов, из-за чего ожидается снижение добычи в стране на 850 тысяч баррелей в сутки. С другой стороны, на котировки давит заявление правительства ОАЭ о том, что страна имеет возможность значительно нарастить добычу, чтобы не допустить дефицита предложения на рынке. Ранее об этом же заявляли представители Саудовской Аравии. Таким образом, ожидаемое к концу года снижение экспорта «чёрного золота» из Ирана будет компенсировано увеличением производства другими членами ОПЕК.
Вечером инвесторы ждут публикации еженедельных данных по запасам нефти в США от API. Продолжение снижения показателя может привести к дополнительному давлению на цены.
Уровни поддержки и сопротивления
Ключевой для «быков» выступает отметка 73.43 (Мюррей [7/8]), при её пробое цена может вырасти к уровню 75.00 (Мюррей [8/8]). В противном случае ожидается нисходящая коррекция к отметкам 71.87 (нижняя линия полос Боллинджера, Мюррей [6/8]) и 70.31 (Мюррей [5/8]).
Технические индикаторы не исключают возможность снижения цен. Полосы Боллинджера направлены вверх. Стохастик вошёл в зону перекупленности, что грозит разворотом, гистограмма MACD уменьшается в положительной зоне.
Уровни сопротивления: 73.43, 75.00.
Уровни поддержки: 71.87, 70.31.
Торговые сценарии
Короткие позиции можно открывать от уровня 72.80 с целями 71.87, 70.31 и стоп-лоссом 73.40.
Длинные позиции можно открывать при закреплении цены выше уровня 73.43 с целью 75.00 и стоп-лоссом в районе 72.80.
Срок реализации: 3–5 дней.
LiteFinance
USD/JPY: the dollar is growing
Current trend
USD moderately rose against JPY on Thursday, continuing to develop an uptrend formed earlier this week. The instrument was strengthened due to technical factors, as well as weakened JPY at the backdrop of pessimistic statistics from Japan.
MoM Retail Trade fell to –1.7% in May from 1.4% a month earlier. YoY index fell to 0.6% in May from 1.5% a month earlier.
Today, the pair is also declining, despite the publication of optimistic statistics from Japan. Tokyo CPI ex Fresh Food (YoY) grew by 0.7% in June after the growth to 0.5% a month earlier, with the forecast of +0.6%. At the same time, the unemployment rate fell to a record 2.2% in May against 2.5% earlier. Industrial production (YoY) grew by 4.2% which turned out to be significantly better than previous value of +2.6% and the forecast of +1.1%.
Support and resistance
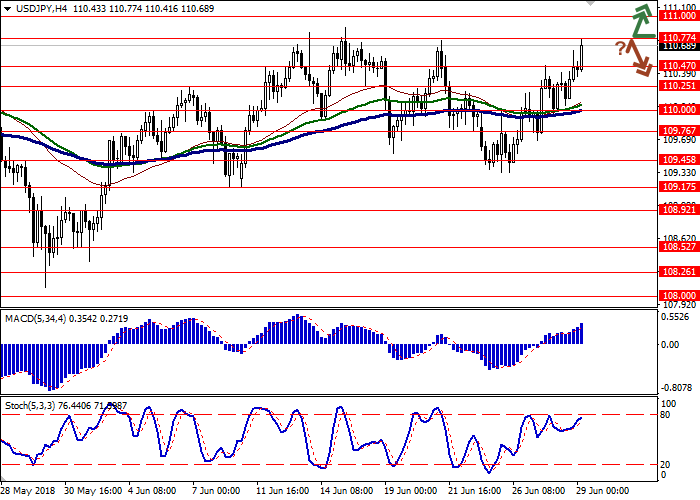
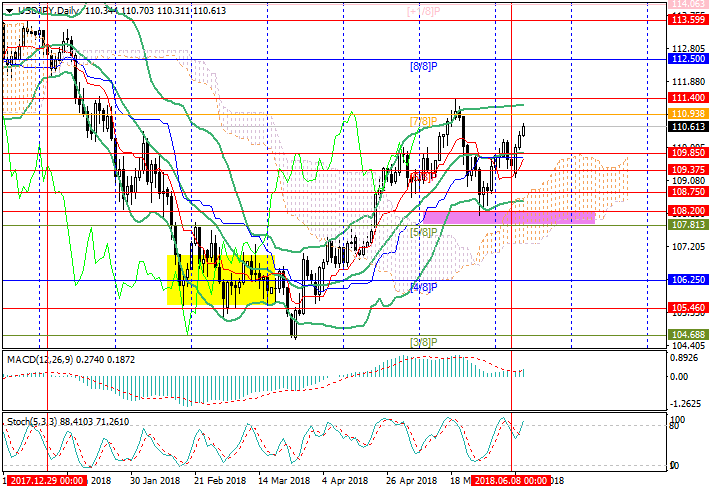
Bollinger Bands in D1 chart demonstrate flat dynamics. The price range slightly widens from above and limiting the further development of "bullish" trend. MACD indicator is growing keeping a new buy signal (located above the signal line). Stochastic keeps its upward direction, but is approaching its maximum values, which signals an overbought dollar.
Current indicators do not contradict the further development of the "bullish" trend in the short term.
Resistance levels: 110.77, 111.00, 111.38.
Support levels: 110.47, 110.25, 110.00, 109.76.
Trading tips
To open long positions, one can rely on the breakout of 110.77. Take-profit — 111.38 or 111.50. Stop-loss — 110.50. Implementation period: 2 days.
A rebound from the level of 110.77, as from resistance, followed by a breakdown of 110.50 or 110.47, may become a signal for corrective sales with the target at 110.00. Stop-loss — 110.70 or 110.80. Implementation period: 2-3 days.
USD/JPY: доллар показывает рост
Текущая динамика
Американский доллар умеренно вырос против японской иены в четверг, продолжив развитие восходящего тренда, сформированного в начале недели. Укреплению инструмента, помимо технических факторов, способствовало снижение иены на фоне слабой макроэкономической статистики из Японии.
Розничные продажи в месячном выражении снизились до –1,7% в мае с 1,4% месяцем ранее. В годовом выражении значение показателя упало до 0,6% в мае с 1,5% месяцем ранее.
Сегодня пара также снижается, несмотря на публикацию оптимистичной статистики из Японии. Так, индекс потребительских цен Токио без учета цен на свежие продукты питания в июне вырос на 0,7% г/г после роста на 0,5% г/г месяцем ранее, при прогнозе +0,6% г/г. При этом уровень безработицы в мае рухнул до рекордных значений в 2,2% против 2,5% ранее. Объёмы промышленного производства в мае выросли на 4,2% г/г, что также оказалось заметно лучше прошлых данных в +2,6% г/г и прогноза +1,1% г/г.
Уровни поддержки и сопротивления
Полосы Боллинджера на дневном графике демонстрируют флэтовую динамику. Ценовой диапазон незначительно расширяется сверху и пока ограничивает дальнейшее развитие «бычьей» динамики. Индикатор MACD растёт, сформировав новый сигнал на покупку (гистограмма располагается выше сигнальной линии). Стохастик сохраняет восходящую направленность, но приближается к своим максимальным значениям, что сигнализирует о перекупленности доллара.
Текущие показания индикаторов не противоречат дальнейшему развитию «бычьего» тренда в краткосрочной перспективе.
Уровни сопротивления: 110.77, 111.00, 111.38.
Уровни поддержки: 110.47, 110.25, 110.00, 109.76.
Торговые сценарии
Для открытия длинных позиций можно опираться на пробой отметки 110.77 вверх. Тейк-профит — 111.38 или 111.50. Стоп-лосс — 110.50. Срок реализации 2 дня.
Отскок от уровня 110.77, как от сопротивления, с последующим пробоем отметки 110.50 или 110.47 вниз, может стать сигналом к началу коррекционных продаж с целью 110.00. Стоп-лосс — 110.70 или 110.80. Срок реализации 2-3 дня.
Current trend
USD moderately rose against JPY on Thursday, continuing to develop an uptrend formed earlier this week. The instrument was strengthened due to technical factors, as well as weakened JPY at the backdrop of pessimistic statistics from Japan.
MoM Retail Trade fell to –1.7% in May from 1.4% a month earlier. YoY index fell to 0.6% in May from 1.5% a month earlier.
Today, the pair is also declining, despite the publication of optimistic statistics from Japan. Tokyo CPI ex Fresh Food (YoY) grew by 0.7% in June after the growth to 0.5% a month earlier, with the forecast of +0.6%. At the same time, the unemployment rate fell to a record 2.2% in May against 2.5% earlier. Industrial production (YoY) grew by 4.2% which turned out to be significantly better than previous value of +2.6% and the forecast of +1.1%.
Support and resistance
Bollinger Bands in D1 chart demonstrate flat dynamics. The price range slightly widens from above and limiting the further development of "bullish" trend. MACD indicator is growing keeping a new buy signal (located above the signal line). Stochastic keeps its upward direction, but is approaching its maximum values, which signals an overbought dollar.
Current indicators do not contradict the further development of the "bullish" trend in the short term.
Resistance levels: 110.77, 111.00, 111.38.
Support levels: 110.47, 110.25, 110.00, 109.76.
Trading tips
To open long positions, one can rely on the breakout of 110.77. Take-profit — 111.38 or 111.50. Stop-loss — 110.50. Implementation period: 2 days.
A rebound from the level of 110.77, as from resistance, followed by a breakdown of 110.50 or 110.47, may become a signal for corrective sales with the target at 110.00. Stop-loss — 110.70 or 110.80. Implementation period: 2-3 days.
USD/JPY: доллар показывает рост
Текущая динамика
Американский доллар умеренно вырос против японской иены в четверг, продолжив развитие восходящего тренда, сформированного в начале недели. Укреплению инструмента, помимо технических факторов, способствовало снижение иены на фоне слабой макроэкономической статистики из Японии.
Розничные продажи в месячном выражении снизились до –1,7% в мае с 1,4% месяцем ранее. В годовом выражении значение показателя упало до 0,6% в мае с 1,5% месяцем ранее.
Сегодня пара также снижается, несмотря на публикацию оптимистичной статистики из Японии. Так, индекс потребительских цен Токио без учета цен на свежие продукты питания в июне вырос на 0,7% г/г после роста на 0,5% г/г месяцем ранее, при прогнозе +0,6% г/г. При этом уровень безработицы в мае рухнул до рекордных значений в 2,2% против 2,5% ранее. Объёмы промышленного производства в мае выросли на 4,2% г/г, что также оказалось заметно лучше прошлых данных в +2,6% г/г и прогноза +1,1% г/г.
Уровни поддержки и сопротивления
Полосы Боллинджера на дневном графике демонстрируют флэтовую динамику. Ценовой диапазон незначительно расширяется сверху и пока ограничивает дальнейшее развитие «бычьей» динамики. Индикатор MACD растёт, сформировав новый сигнал на покупку (гистограмма располагается выше сигнальной линии). Стохастик сохраняет восходящую направленность, но приближается к своим максимальным значениям, что сигнализирует о перекупленности доллара.
Текущие показания индикаторов не противоречат дальнейшему развитию «бычьего» тренда в краткосрочной перспективе.
Уровни сопротивления: 110.77, 111.00, 111.38.
Уровни поддержки: 110.47, 110.25, 110.00, 109.76.
Торговые сценарии
Для открытия длинных позиций можно опираться на пробой отметки 110.77 вверх. Тейк-профит — 111.38 или 111.50. Стоп-лосс — 110.50. Срок реализации 2 дня.
Отскок от уровня 110.77, как от сопротивления, с последующим пробоем отметки 110.50 или 110.47 вниз, может стать сигналом к началу коррекционных продаж с целью 110.00. Стоп-лосс — 110.70 или 110.80. Срок реализации 2-3 дня.
LiteFinance
CAC: technical analysis
CAC, D1
On the daily chart, the instrument is trading on the lower line of the Bollinger Bands. The price remains just below its moving averages that start turning down. The RSI is approaching the border of the oversold zone. The Composite is about to test from below its longer MA.
CAC, H4
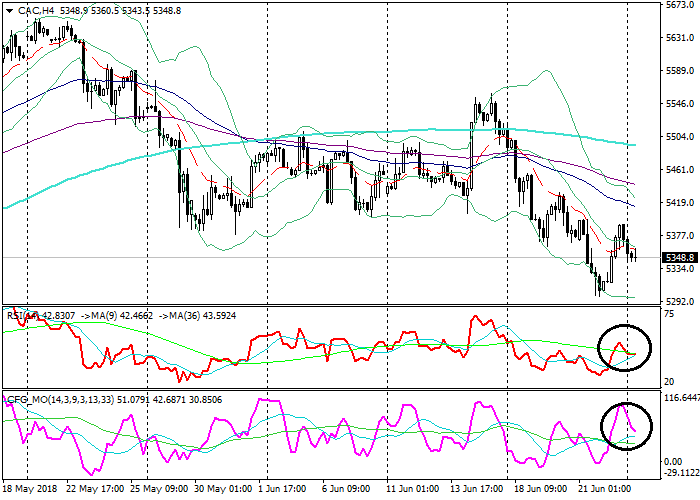
On the 4-hour chart, the instrument is correcting down from the middle MA of the Bollinger Bands. The price remains below its moving averages that are directed down. The RSI is testing from above its longer MA. The Composite is about to test its longer MA as well.
Key levels
Support levels: 5300.0 (local lows), 5285.0 (local lows), 5265.0 (November 2017 lows).
Resistance levels: 5400.0 (local highs), 5435.0 (local highs), 5500.0 (local highs).
Trading tips
The fall is likely to continue.
Short positions can be opened from current prices with targets at 5300.0, 5285.0, 5265.0 and stop-loss at 5375.0. Validity – 3-5 days.
Long positions can be opened from the level of 5435.0 with the target at 5500.0 and stop-loss at 5400.0. Validity – 3-5 days.
CAC: технический анализ
CAC, D1
На дневном графике инструмент торгуется на нижней линии Полос Боллинджера. Цена находится прямо под своими скользящими средними, разворачивающимися вниз. RSI приближается к границе области перепроданности. Composite готовится снизу протестировать свою долгосрочную MA.
CAC, H4
На 4-часовом графике инструмент корректируется вниз от средней линии Полос Боллинджера. Цена находится ниже своих скользящих средних, направленных вниз. RSI сверху тестирует свою долгосрочную MA. Composite также готовится протестировать свою долгосрочную MA.
Ключевые уровни
Уровни поддержки: 5300.0 (локальные минимумы), 5285.0 (локальные минимумы), 5265.0 (минимумы ноября 2017 года).
Уровни сопротивления: 5400.0 (локальные максимумы), 5435.0 (локальные максимумы), 5500.0 (локальные максимумы).
Торговые сценарии
Снижение, по всей видимости, продолжится.
Короткие позиции можно открывать от текущей цены с целями 5300.0, 5285.0, 5265.0 и стоп-лоссом на отметке 5375.0. Срок реализации — 3-5 дней.
Длинные позиции можно открывать от уровня 5435.0 с целью 5500.0 и стоп-лоссом на отметке 5400.0. Срок реализации — 3-5 дней.
CAC, D1
On the daily chart, the instrument is trading on the lower line of the Bollinger Bands. The price remains just below its moving averages that start turning down. The RSI is approaching the border of the oversold zone. The Composite is about to test from below its longer MA.
CAC, H4
On the 4-hour chart, the instrument is correcting down from the middle MA of the Bollinger Bands. The price remains below its moving averages that are directed down. The RSI is testing from above its longer MA. The Composite is about to test its longer MA as well.
Key levels
Support levels: 5300.0 (local lows), 5285.0 (local lows), 5265.0 (November 2017 lows).
Resistance levels: 5400.0 (local highs), 5435.0 (local highs), 5500.0 (local highs).
Trading tips
The fall is likely to continue.
Short positions can be opened from current prices with targets at 5300.0, 5285.0, 5265.0 and stop-loss at 5375.0. Validity – 3-5 days.
Long positions can be opened from the level of 5435.0 with the target at 5500.0 and stop-loss at 5400.0. Validity – 3-5 days.
CAC: технический анализ
CAC, D1
На дневном графике инструмент торгуется на нижней линии Полос Боллинджера. Цена находится прямо под своими скользящими средними, разворачивающимися вниз. RSI приближается к границе области перепроданности. Composite готовится снизу протестировать свою долгосрочную MA.
CAC, H4
На 4-часовом графике инструмент корректируется вниз от средней линии Полос Боллинджера. Цена находится ниже своих скользящих средних, направленных вниз. RSI сверху тестирует свою долгосрочную MA. Composite также готовится протестировать свою долгосрочную MA.
Ключевые уровни
Уровни поддержки: 5300.0 (локальные минимумы), 5285.0 (локальные минимумы), 5265.0 (минимумы ноября 2017 года).
Уровни сопротивления: 5400.0 (локальные максимумы), 5435.0 (локальные максимумы), 5500.0 (локальные максимумы).
Торговые сценарии
Снижение, по всей видимости, продолжится.
Короткие позиции можно открывать от текущей цены с целями 5300.0, 5285.0, 5265.0 и стоп-лоссом на отметке 5375.0. Срок реализации — 3-5 дней.
Длинные позиции можно открывать от уровня 5435.0 с целью 5500.0 и стоп-лоссом на отметке 5400.0. Срок реализации — 3-5 дней.
LiteFinance
XAU/USD: Wave analysis and forecast for 22/06/2018 – 29/06/2018
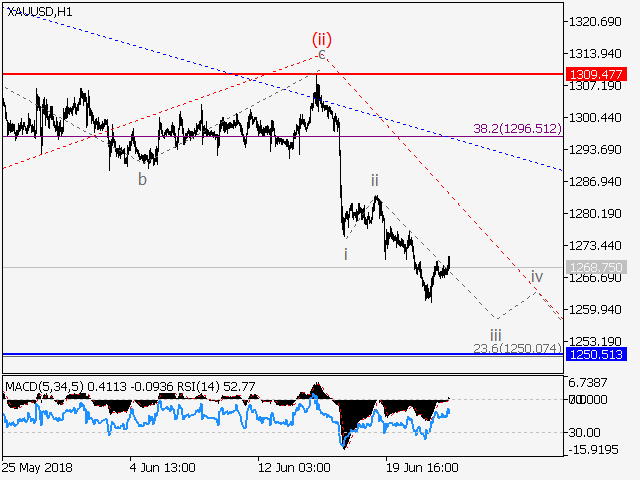
Descending trend for the pair XAU/USD continues. Estimated pivot point is at a level of 1309.47.
Main scenario: short positions will be relevant from corrections below the level of 1309.47 with a target of 1250.50 – 1233.90.
Alternative scenario: breakdown and consolidation above the level of 1309.47 will allow the pair to continue the rise up to the levels of 1325.72 – 1355.62.
Analysis: Supposedly, an ascending wave of senior level C of (В) finished developing within the daily time frame and the wave (C) started forming. A downward impetus is developing as the third wave iii в inside the wave 1 of (C) in the 4-hour timeframe. Apparently, a downward impetus is developing as wave (iii) of iii in the 1-hour timeframe. If the presumption is correct, the price will continue falling to the levels of 1250.50 – 1233.90. The level 1309.47 is critical in this scenario.
LiteFinance
USD/JPY: the dollar is dropping
Current trend
USD showed a stable decrease against JPY on Tuesday, updating the local low of June 11. The growth of the Japanese currency is fueled by the growing US-China trade conflict.
At the same time, the dollar is relatively stable, as it receives support from the Fed's actions aimed at gradual tightening of monetary policy.
Today, the pair is also trading in an upward direction. Traders focus on the published minutes of the April meeting of the Bank of Japan, which in many respects turned out to be neutral. According to the protocol, only one official spoke in favor of additional stimulation measures, while the overwhelming majority of board members advocated the preservation of the monetary policy vector.
Support and resistance
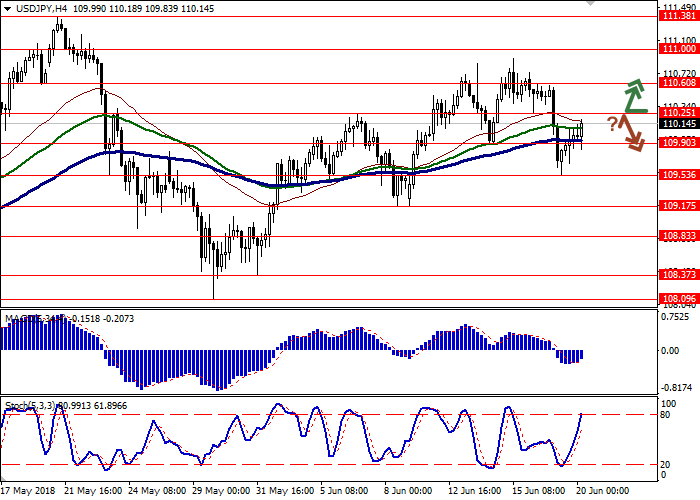
On the D1 chart, Bollinger Bands are gradually reversing horizontally. The price range is narrowing, reflecting ambiguous nature of trading in recent days. MACD reversed downwards having formed a sell signal (located under the signal line). Stochastic is going down and is located in the middle of its area.
Technical indicators do not contradict the further development of the "bearish" trend in the short and/or ultra-short term. The existing short positions should be left open for some time.
Resistance levels: 110.25, 110.60, 111.00, 111.38.
Support levels: 109.90, 109.53, 109.17, 108.83.
Trading tips
To open long positions one can rely on the breakout of the level of 110.25 if signals for the uptrend development in the short and/or ultra-short term emerge. Take-profit — 111.00. Stop-loss — 109.80.
The rebound from the level of 110.25 as from resistance, with the subsequent breakdown of 109.90, can become a signal to new sales with target at 109.17, 109.00 or 108.83. Stop-loss — 110.40.
Implementation period: 2-3 days.
USD/JPY: доллар снижается
Текущая динамика
Доллар США показал уверенное снижение против иены во вторник, отметив новый локальный минимум с 11 июня. Росту японской валюты способствует набирающий обороты торговый конфликт между США и Китаем.
Вместе с тем, американская валюта относительно стабильна, поскольку получает поддержку со стороны действий ФРС, направленных на постепенное ужесточение монетарной политики.
Сегодня пара торгуется в восходящем ключе. Трейдеры обыгрывают опубликованные протоколы апрельского заседания Банка Японии, которые во многом оказались нейтральными. Так, согласно документу, лишь один политик ЦБ высказался за дополнительные меры стимуляции, тогда как подавляющее большинство членов правления выступили за сохранение вектора монетарной политики.
Уровни поддержки и сопротивления
Полосы Боллинджера на дневном графике демонстрируют плавный разворот в горизонтальную плоскость. Ценовой диапазон сужается, отражая смешанный характер торгов последних дней. Индикатор MACD развернулся вниз, сформировав сигнал на продажу (гистограмма располагается ниже сигнальной линии). Стохастик также уверенно снижается, находясь примерно в центре своей рабочей области.
Текущие показания технических индикаторов не противоречат дальнейшему развитию «медвежьего» тренда в краткосрочной и/или сверхкраткосрочной перспективе. Следует оставить открытыми имеющиеся короткие позиции ещё какое-то время.
Уровни сопротивления: 110.25, 110.60, 111.00, 111.38.
Уровни поддержки: 109.90, 109.53, 109.17, 108.83.
Торговые сценарии
Для открытия длинных позиций можно опираться на пробой отметки 110.25 при появлении сигналов на развитие восходящей коррекции в краткосрочной и/или сверхкраткосрочной перспективе. Тейк-профит — 111.00. Стоп-лосс — 109.80.
Отскок от уровня 110.25, как от сопротивления, с последующим пробоем отметки 109.90 вниз, может стать сигналом к новым продажам с целью 109.17, 109.00 или 108.83. Стоп-лосс — 110.40.
Срок реализации 2-3 дня.
Current trend
USD showed a stable decrease against JPY on Tuesday, updating the local low of June 11. The growth of the Japanese currency is fueled by the growing US-China trade conflict.
At the same time, the dollar is relatively stable, as it receives support from the Fed's actions aimed at gradual tightening of monetary policy.
Today, the pair is also trading in an upward direction. Traders focus on the published minutes of the April meeting of the Bank of Japan, which in many respects turned out to be neutral. According to the protocol, only one official spoke in favor of additional stimulation measures, while the overwhelming majority of board members advocated the preservation of the monetary policy vector.
Support and resistance
On the D1 chart, Bollinger Bands are gradually reversing horizontally. The price range is narrowing, reflecting ambiguous nature of trading in recent days. MACD reversed downwards having formed a sell signal (located under the signal line). Stochastic is going down and is located in the middle of its area.
Technical indicators do not contradict the further development of the "bearish" trend in the short and/or ultra-short term. The existing short positions should be left open for some time.
Resistance levels: 110.25, 110.60, 111.00, 111.38.
Support levels: 109.90, 109.53, 109.17, 108.83.
Trading tips
To open long positions one can rely on the breakout of the level of 110.25 if signals for the uptrend development in the short and/or ultra-short term emerge. Take-profit — 111.00. Stop-loss — 109.80.
The rebound from the level of 110.25 as from resistance, with the subsequent breakdown of 109.90, can become a signal to new sales with target at 109.17, 109.00 or 108.83. Stop-loss — 110.40.
Implementation period: 2-3 days.
USD/JPY: доллар снижается
Текущая динамика
Доллар США показал уверенное снижение против иены во вторник, отметив новый локальный минимум с 11 июня. Росту японской валюты способствует набирающий обороты торговый конфликт между США и Китаем.
Вместе с тем, американская валюта относительно стабильна, поскольку получает поддержку со стороны действий ФРС, направленных на постепенное ужесточение монетарной политики.
Сегодня пара торгуется в восходящем ключе. Трейдеры обыгрывают опубликованные протоколы апрельского заседания Банка Японии, которые во многом оказались нейтральными. Так, согласно документу, лишь один политик ЦБ высказался за дополнительные меры стимуляции, тогда как подавляющее большинство членов правления выступили за сохранение вектора монетарной политики.
Уровни поддержки и сопротивления
Полосы Боллинджера на дневном графике демонстрируют плавный разворот в горизонтальную плоскость. Ценовой диапазон сужается, отражая смешанный характер торгов последних дней. Индикатор MACD развернулся вниз, сформировав сигнал на продажу (гистограмма располагается ниже сигнальной линии). Стохастик также уверенно снижается, находясь примерно в центре своей рабочей области.
Текущие показания технических индикаторов не противоречат дальнейшему развитию «медвежьего» тренда в краткосрочной и/или сверхкраткосрочной перспективе. Следует оставить открытыми имеющиеся короткие позиции ещё какое-то время.
Уровни сопротивления: 110.25, 110.60, 111.00, 111.38.
Уровни поддержки: 109.90, 109.53, 109.17, 108.83.
Торговые сценарии
Для открытия длинных позиций можно опираться на пробой отметки 110.25 при появлении сигналов на развитие восходящей коррекции в краткосрочной и/или сверхкраткосрочной перспективе. Тейк-профит — 111.00. Стоп-лосс — 109.80.
Отскок от уровня 110.25, как от сопротивления, с последующим пробоем отметки 109.90 вниз, может стать сигналом к новым продажам с целью 109.17, 109.00 или 108.83. Стоп-лосс — 110.40.
Срок реализации 2-3 дня.
LiteFinance

USD/CAD: general analysis
Current trend
On Thursday, the pair strengthened steadily and grew by more than a hundred points due to the strong dollar. USD was supported by strong May US Sales Data supported USD. It is estimated that sales increased from 0.4% to 0.8%, and Retail Sales increased from 0.4% to 0.9%. Initial Jobless Claims indicator was also positive. It was below the forecasts, which indicates the strength of the employment market and affects the national currency positively.
On Friday, investors are waiting for the publication of the May US Industrial Production, which can fall from 0.7% to 0.2% and affect USD negatively.
Support and resistance
On the 4-hour chart, the instrument grows along the upper border of Bollinger bands, the price range is widened. MACD histogram is in the positive area, keeping a strong signal for the opening of long positions.
Resistance levels: 1.3160, 1.3200.
Support levels: 1.3130, 1.3100, 1.3080, 1.3050, 1.3025.
Trading tips
Long positions can be opened from the current level with the target at 1.3200 and stop loss 1.3110.
Short positions can be opened at the level 1.3100 with the target at 1.3025 and stop loss 1.3130.
Implementation period: 1–3 days.
LiteFinance
USD/JPY: general review
Current trend
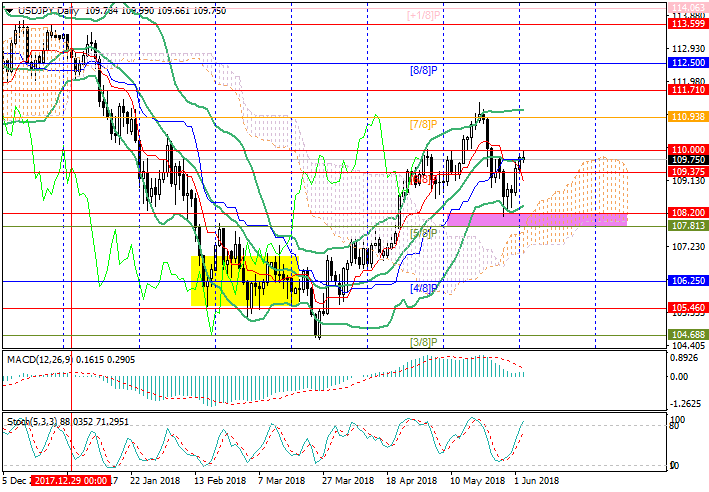
This week, the pair rose to around 110.65 amid expectations of an interest rate increase by the Fed, the decision on which will be made today.
It is expected that the regulator will raise the rate from 1.75% to 2.00%. Nevertheless, the main intrigue is how much more increases should be expected this year – one or two. Jerome Powell, the Fed's Head, can answer this question at today's press-conference. In conditions of steady growth of inflation, the basic level of which exceeds the target level of 2.0% for three months in a row, the aggressive increase in rates looks logical. However, a trade conflict with the EU and Canada can make the FOMC officials be more cautious.
On Thursday, April data on industrial production in Japan will be published. It is expected that, on an annual basis, the figure will increase from 2.5% to 3.1%, which is unlikely to significantly strengthen the yen, as investors' attention will continue to focus on the results of the meeting of the American regulator.
Support and resistance
Currently, the price approaches the level of 110.93 (Murray [7/8]) and after its breakout can go to the level of 111.40 (the May high area). A breakdown of the midline of Bollinger Bands around 109.85 will give a prospect of a decline to 109.37 (Murray [6/8]) and 108.75. Technical indicators show growth. Stochastic is directed upwards, and MACD histogram is growing in the positive zone.
Support levels: 109.85, 109.37, 108.75.
Resistance levels: 110.93, 111.40.
Trading tips
Long positions may be opened from the current level with targets at 110.93, 111.40 and stop-loss at 110.20.
Short positions may be opened below the level of 109.85 with targets at 109.37, 108.75 and stop-loss at 110.10.
USD/JPY: общий обзор
Текущая динамика
На текущей неделе пара выросла к отметке 110.65 на фоне ожидания повышения ФРС процентной ставки. Решение по этому вопросу будет вынесено сегодня.
Вероятно, американский регулятор повысит уровень ставки с 1,75% до 2,00%. Тем не менее, главная интрига заключается в том, сколько ещё повышений рынку стоит ожидать в текущем году – одно или два. Ответ на это вопрос на пресс-конференции может дать глава ФРС Джером Пауэлл. В условиях стабильного роста инфляции, базовый уровень которой три месяца подряд превышает целевую отметку 2,0%, агрессивное повышение ставок выглядит логично. Однако торговый конфликт с ЕС и Канадой может заставить чиновников Комитета по открытым рынкам быть осторожнее.
В четверг будут опубликованы апрельские данные по объёму промышленного производства в Японии. Ожидается, что в годовом исчислении показатель вырастет с 2,5% до 3,1%, что вряд ли существенно укрепит иену, поскольку внимание инвесторов по-прежнему будет сосредоточено на результатах заседания американского регулятора.
Уровни поддержки и сопротивления
В настоящее время цена стремится к отметке 110.93 (Мюррей [7/8]) и при её пробое может пойти к уровню 111.40 (район майского максимума). Пробой вниз средней линии полос Боллинджера в районе 109.85 даст перспективу снижения к отметкам 109.37 (Мюррей [6/8]) и 108.75. Технические индикаторы пока говорят о росте. Стохастик направлен вверх, гистограмма MACD растёт в положительной зоне.
Уровни поддержки: 109.85, 109.37, 108.75.
Уровни сопротивления: 110.93, 111.40.
Торговые сценарии
Длинные позиции стоит открывать от текущего уровня с целями 110.93, 111.40 и стоп-лоссом у отметки 110.20.
Короткие позиции стоит открывать ниже отметки 109.85 с целями 109.37, 108.75 и стоп-лоссом в районе 110.10.
Current trend
This week, the pair rose to around 110.65 amid expectations of an interest rate increase by the Fed, the decision on which will be made today.
It is expected that the regulator will raise the rate from 1.75% to 2.00%. Nevertheless, the main intrigue is how much more increases should be expected this year – one or two. Jerome Powell, the Fed's Head, can answer this question at today's press-conference. In conditions of steady growth of inflation, the basic level of which exceeds the target level of 2.0% for three months in a row, the aggressive increase in rates looks logical. However, a trade conflict with the EU and Canada can make the FOMC officials be more cautious.
On Thursday, April data on industrial production in Japan will be published. It is expected that, on an annual basis, the figure will increase from 2.5% to 3.1%, which is unlikely to significantly strengthen the yen, as investors' attention will continue to focus on the results of the meeting of the American regulator.
Support and resistance
Currently, the price approaches the level of 110.93 (Murray [7/8]) and after its breakout can go to the level of 111.40 (the May high area). A breakdown of the midline of Bollinger Bands around 109.85 will give a prospect of a decline to 109.37 (Murray [6/8]) and 108.75. Technical indicators show growth. Stochastic is directed upwards, and MACD histogram is growing in the positive zone.
Support levels: 109.85, 109.37, 108.75.
Resistance levels: 110.93, 111.40.
Trading tips
Long positions may be opened from the current level with targets at 110.93, 111.40 and stop-loss at 110.20.
Short positions may be opened below the level of 109.85 with targets at 109.37, 108.75 and stop-loss at 110.10.
USD/JPY: общий обзор
Текущая динамика
На текущей неделе пара выросла к отметке 110.65 на фоне ожидания повышения ФРС процентной ставки. Решение по этому вопросу будет вынесено сегодня.
Вероятно, американский регулятор повысит уровень ставки с 1,75% до 2,00%. Тем не менее, главная интрига заключается в том, сколько ещё повышений рынку стоит ожидать в текущем году – одно или два. Ответ на это вопрос на пресс-конференции может дать глава ФРС Джером Пауэлл. В условиях стабильного роста инфляции, базовый уровень которой три месяца подряд превышает целевую отметку 2,0%, агрессивное повышение ставок выглядит логично. Однако торговый конфликт с ЕС и Канадой может заставить чиновников Комитета по открытым рынкам быть осторожнее.
В четверг будут опубликованы апрельские данные по объёму промышленного производства в Японии. Ожидается, что в годовом исчислении показатель вырастет с 2,5% до 3,1%, что вряд ли существенно укрепит иену, поскольку внимание инвесторов по-прежнему будет сосредоточено на результатах заседания американского регулятора.
Уровни поддержки и сопротивления
В настоящее время цена стремится к отметке 110.93 (Мюррей [7/8]) и при её пробое может пойти к уровню 111.40 (район майского максимума). Пробой вниз средней линии полос Боллинджера в районе 109.85 даст перспективу снижения к отметкам 109.37 (Мюррей [6/8]) и 108.75. Технические индикаторы пока говорят о росте. Стохастик направлен вверх, гистограмма MACD растёт в положительной зоне.
Уровни поддержки: 109.85, 109.37, 108.75.
Уровни сопротивления: 110.93, 111.40.
Торговые сценарии
Длинные позиции стоит открывать от текущего уровня с целями 110.93, 111.40 и стоп-лоссом у отметки 110.20.
Короткие позиции стоит открывать ниже отметки 109.85 с целями 109.37, 108.75 и стоп-лоссом в районе 110.10.
LiteFinance
Brent Crude Oil: Murray analysis
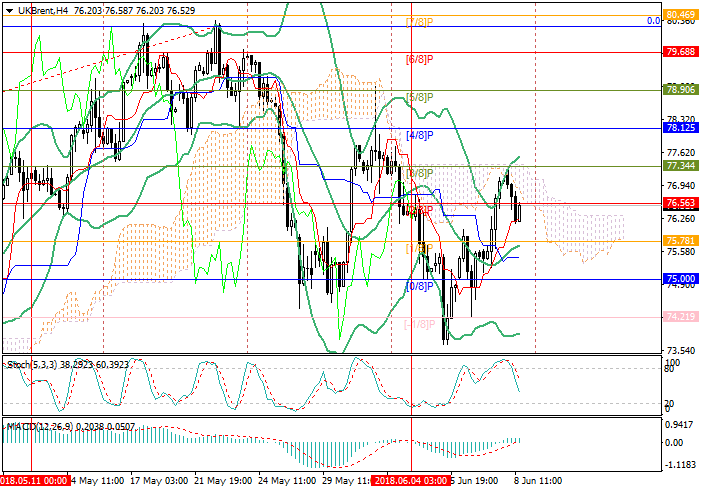
On the 4-hour chart, the price rebounded from the level of 77.34 ([3/8]) and tries to be corrected to the midline of Bollinger bands in the area of 75.78 ([1/8]), which is seen as key “bullish” range. The breakdown will let the instrument fall to the levels of 75.00 ([0/8]) and 74.21 ([–1/8]). The consolidation of the price above the level of 76.56 can let it grow to 77.34 ([3/8]) and 78.12 ([4/8]).
Technical signals do not give a clear signal. MACD histogram is stable in the positive zone, its volumes are insignificant. Stochastic is pointing down.
Support and resistance
Resistance levels: 76.56, 77.34, 78.12.
Support levels: 75.78, 75.00, 74.21.
Trading tips
Short positions can be opened below the level of 75.78 with the targets at 75.00, 74.21 and stop loss 76.00.
Long positions can be opened from the level of 76.80 with the targets at 77.34, 78.12 and stop loss around 76.40.
Implementation period: 3–4 days.
Brent Crude Oil: анализ уровней Мюррея
На 4-часовом графике цена отбилась от отметки 77.34 ([3/8]) и пытается скорректироваться к средней линии полос Боллинджера в район 75.78 ([1/8]), который видится ключевым для «медведей». Его пробой даст перспективу снижения к уровням 75.00 ([0/8]) и 74.21 ([–1/8]). Закрепление цены выше отметки 76.56 может привести к возобновлению роста котировок к отметкам 77.34 ([3/8]) и 78.12 ([4/8]).
Технические сигналы не дают чёткого сигнала. Гистограмма MACD стабильна в положительной зоне, объёмы её незначительны. Стохастик направлен вниз.
Уровни поддержки и сопротивления
Уровни сопротивления: 76.56, 77.34, 78.12.
Уровни поддержки: 75.78, 75.00, 74.21.
Торговые сценарии
Короткие позиции можно открывать ниже уровня 75.78 с целями 75.00, 74.21 и защитным приказом в районе 76.00.
Длинные позиции можно открывать от уровня 76.80 с целями 77.34, 78.12 и защитным приказом в районе 76.40.
Срок реализации: 3–4 дней.
LiteFinance
GBP/USD: general analysis
Current trend
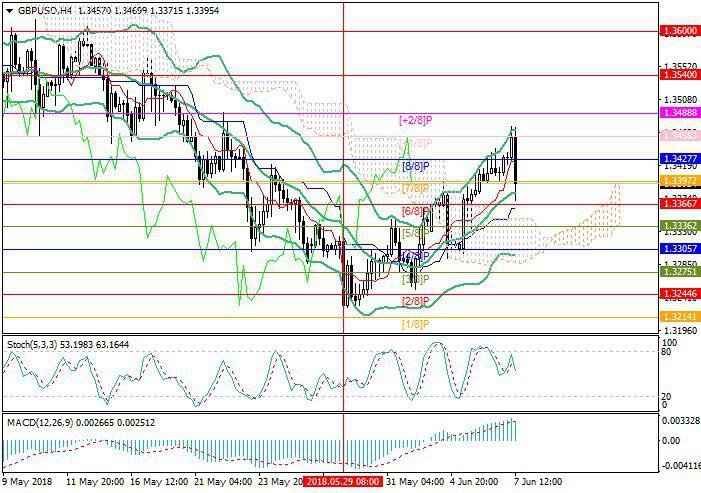
The pair is influenced by contradictory factors. On the one hand, positive British Service, Manufacturing, and Construction PMI inspired the investors and gave hopes for reduction of BoE monetary stimulus. On the other hand, Brexit situation is incurring significant risks for the British economy. In general, business is preparing for hard times. Representatives of major European and British companies have warned Prime Minister Theresa May about a possible reduction in investment, which would cause a reduction in jobs number.
The lack of a compromise upon Brexit in the British government worsens the situation. Recently, Theresa May proposed to leave the UK in the EU United Customs zone temporary, which would let avoid the physical borders in Ireland. However, this plan has raised objections from a number of ministers, including David Davis, Boris Johnson, and Liam Fox, who insisted that the UK's stay within the customs union should be limited to a specific unmovable deadline.
Support and resistance
Technically, the pair has been growing for two weeks but was corrected to the midline of Bollinger bands. In the case of a breakdown below the level of 1.3366 (Murray [6/8]), a further decline to the level of 1.3300 (Murray [4/8]) is possible, which is confirmed by indicators: Stochastic reversed downwards, MACD decreases in the positive zone. The key "bullish" level is 1.3427 (Murray [0/8]). In case of the breakout, the price can grow to 1.3488 (Murray [+2/8]), 1.3540.
Resistance levels: 1.3427, 1.3488.
Support levels: 1.3366, 1.3300.
Trading tips
Short positions can be opened below the level of 1.3366 with the target at 1.3300 and a stop loss around 1.3400.
Long positions can be opened above the level of 1.3427 with the targets at 1.3488, 1.3540 and stop loss 1.3390.
Implementation period: 3–5 days.
GBP/USD: общий обзор
Текущая динамика
В настоящее время пара находится под влиянием противоречивых факторов. С одной стороны, позитивные британские данные по индексам деловой активности в промышленности и сфере услуг, в также строительства вызвали у инвесторов эйфорию и новые надежды на сокращение Банком Англии монетарных стимулов. С другой стороны, ситуация с Brexit продолжает нести значительные риски для британской экономики. В целом, бизнес начитает готовиться к тяжёлым временам. Представители крупных европейских и британских компаний предупредили премьер-министра Терезу Мэй о возможном сокращении инвестиций, что грозит уменьшением количества рабочих мест.
Ситуация усугубляется отсутствием компромисса по условиям Brexit в самом британском правительстве. Так, недавно Тереза Мэй предложила после выхода из ЕС временно оставить Великобританию в зоне действия единых таможенных правил Евросоюза. Такое положение позволило бы избежать установления физических границ в Ирландии. Однако этот план вызвал возражения ряда министров, в том числе Дэвида Дэвиса, Бориса Джонсона и Лиама Фокса, которые настаивают на том, что пребывание Великобритании в рамках таможенного союза должно быть ограничено конкретным непродлеваемым сроком.
Уровни поддержки и сопротивления
Технически пара росла в течение двух недель, однако сейчас скорректировалась к средней линии полос Боллинджера. При пробое вниз отметки 1.3366 (Мюррей [6/8]) возможно дальнейшее снижение к уровню 1.3300 (Мюррей [4/8]). Такой вариант подтверждается индикаторами, Стохастик развернулся вниз, гистограмма MACD уменьшается в положительной зоне. Ключевым для «быков» видится уровень 1.3427 (Мюррей [0/8]). Его пробой даст перспективу роста к отметкам 1.3488 (Мюррей [+2/8]), 1.3540.
Уровни сопротивления: 1.3427, 1.3488.
Уровни поддержки: 1.3366, 1.3300.
Торговые сценарии
Открывать короткие позиции можно ниже уровня 1.3366 с целью 1.3300 и стоп-лоссом в районе 1.3400.
Открывать длинные позиции можно выше уровня 1.3427 с целями 1.3488, 1.3540 и стоп-лоссом у отметки 1.3390.
Срок реализации: 3–5 дней.
Current trend
The pair is influenced by contradictory factors. On the one hand, positive British Service, Manufacturing, and Construction PMI inspired the investors and gave hopes for reduction of BoE monetary stimulus. On the other hand, Brexit situation is incurring significant risks for the British economy. In general, business is preparing for hard times. Representatives of major European and British companies have warned Prime Minister Theresa May about a possible reduction in investment, which would cause a reduction in jobs number.
The lack of a compromise upon Brexit in the British government worsens the situation. Recently, Theresa May proposed to leave the UK in the EU United Customs zone temporary, which would let avoid the physical borders in Ireland. However, this plan has raised objections from a number of ministers, including David Davis, Boris Johnson, and Liam Fox, who insisted that the UK's stay within the customs union should be limited to a specific unmovable deadline.
Support and resistance
Technically, the pair has been growing for two weeks but was corrected to the midline of Bollinger bands. In the case of a breakdown below the level of 1.3366 (Murray [6/8]), a further decline to the level of 1.3300 (Murray [4/8]) is possible, which is confirmed by indicators: Stochastic reversed downwards, MACD decreases in the positive zone. The key "bullish" level is 1.3427 (Murray [0/8]). In case of the breakout, the price can grow to 1.3488 (Murray [+2/8]), 1.3540.
Resistance levels: 1.3427, 1.3488.
Support levels: 1.3366, 1.3300.
Trading tips
Short positions can be opened below the level of 1.3366 with the target at 1.3300 and a stop loss around 1.3400.
Long positions can be opened above the level of 1.3427 with the targets at 1.3488, 1.3540 and stop loss 1.3390.
Implementation period: 3–5 days.
GBP/USD: общий обзор
Текущая динамика
В настоящее время пара находится под влиянием противоречивых факторов. С одной стороны, позитивные британские данные по индексам деловой активности в промышленности и сфере услуг, в также строительства вызвали у инвесторов эйфорию и новые надежды на сокращение Банком Англии монетарных стимулов. С другой стороны, ситуация с Brexit продолжает нести значительные риски для британской экономики. В целом, бизнес начитает готовиться к тяжёлым временам. Представители крупных европейских и британских компаний предупредили премьер-министра Терезу Мэй о возможном сокращении инвестиций, что грозит уменьшением количества рабочих мест.
Ситуация усугубляется отсутствием компромисса по условиям Brexit в самом британском правительстве. Так, недавно Тереза Мэй предложила после выхода из ЕС временно оставить Великобританию в зоне действия единых таможенных правил Евросоюза. Такое положение позволило бы избежать установления физических границ в Ирландии. Однако этот план вызвал возражения ряда министров, в том числе Дэвида Дэвиса, Бориса Джонсона и Лиама Фокса, которые настаивают на том, что пребывание Великобритании в рамках таможенного союза должно быть ограничено конкретным непродлеваемым сроком.
Уровни поддержки и сопротивления
Технически пара росла в течение двух недель, однако сейчас скорректировалась к средней линии полос Боллинджера. При пробое вниз отметки 1.3366 (Мюррей [6/8]) возможно дальнейшее снижение к уровню 1.3300 (Мюррей [4/8]). Такой вариант подтверждается индикаторами, Стохастик развернулся вниз, гистограмма MACD уменьшается в положительной зоне. Ключевым для «быков» видится уровень 1.3427 (Мюррей [0/8]). Его пробой даст перспективу роста к отметкам 1.3488 (Мюррей [+2/8]), 1.3540.
Уровни сопротивления: 1.3427, 1.3488.
Уровни поддержки: 1.3366, 1.3300.
Торговые сценарии
Открывать короткие позиции можно ниже уровня 1.3366 с целью 1.3300 и стоп-лоссом в районе 1.3400.
Открывать длинные позиции можно выше уровня 1.3427 с целями 1.3488, 1.3540 и стоп-лоссом у отметки 1.3390.
Срок реализации: 3–5 дней.
LiteFinance
AUD/USD: correction may be long
Current trend
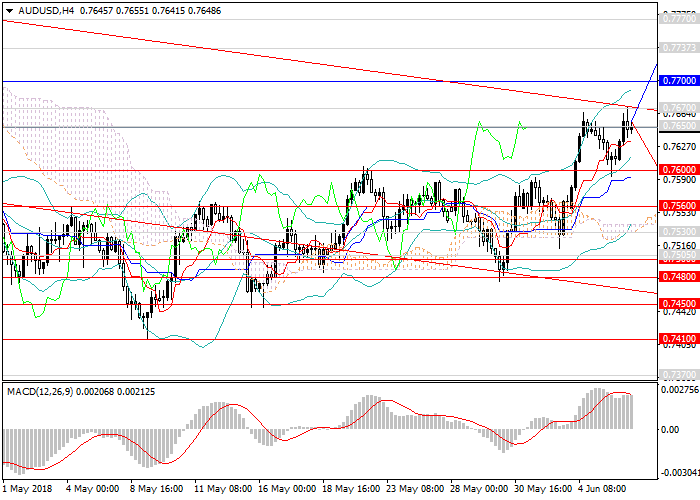
In June, the Australian dollar against the US one continues to recover after a significant fall in April and early May. The pair returned to the medium-term downward channel and has now reached the upper border of this trend.
The main catalyst for this movement was the fall in the attractiveness of the overbought American currency: investors fix short positions, waiting for a longer upward correction. Moreover, strong economic growth data for Q1 were released in Australia, which gave serious support to AUD.
This week, there will be no key releases for the US dollar, so one should not expect increased interest in the currency.
Support and resistance
The pair stopped at a strong resistance level of 0.7670, which is the upper border of the descending channel, which makes it difficult to pass this mark. On the other hand, a strong fundamental background in Australia and a decline in demand for USD can provide momentum for further growth with the possibility of the upward correction to the levels of 0.7700, 0.7800. From them, the instrument can go down to local minima: one should not expect a fall from the current level, but the overall trend remains descending.
Technical indicators on W1 chart confirm the decline forecast in the medium term: MACD indicates the preservation of the high volume of short positions, and Bollinger Bands are pointing downwards.
Support levels: 0.7600, 0.7560, 0.7530, 0.7505, 0.7480, 0.7450, 0.7410.
Resistance levels: 0.7650, 0.7670, 0.7700, 0.7735, 0.7770, 0.7800.
Trading tips
Short positions may be opened from levels of 0.7700, 0.7770, 0.7800 with targets at 0.7450, 0.7410 and stop-loss at 0.7870.
AUD/USD: коррекция может затянуться
Текущая динамика
В июне австралийская валюта против доллара США продолжает восстанавливаться после существенного падения в апреле и начале мая. Пара вернулась в нисходящий среднесрочный канал и на текущий момент достигла верхней границы этой тенденции.
Основным катализатором такого движения стало падение привлекательности перекупленной американской валюты: инвесторы фиксируют короткие позиции, ожидая более длинной коррекции вверх. Помимо этого, в Австралии вышли сильные данные по темпам роста экономики в первом квартале текущего года, что придало серьёзную поддержку AUD.
Ключевых для доллара США релизов на текущей неделе не будет, поэтому повышенного интереса к валюте ожидать не стоит.
Уровни поддержки и сопротивления
В текущей ситуации пара остановилась у сильного уровня сопротивления 0.7670, который является верхней границей нисходящего канала, что затрудняет прохождение этой отметки. С другой стороны, сильный фундаментальный фон по Австралии и спад спроса на американский доллар может обеспечить импульс для дальнейшего роста с возможностью продолжения восходящей коррекции к уровням 0.7700, 0.7800. Уже от них инструмент может направиться вниз к локальным минимумам: ждать падения от текущего уровня не стоит, но общий тренд остается нисходящим.
Технические индикаторы на недельном графике подкрепляют прогноз снижения в среднесрочной перспективе: MACD указывает на сохранение высокого объёма коротких позиций, полосы Боллинджера направлены вниз.
Уровни поддержки: 0.7600, 0.7560, 0.7530, 0.7505, 0.7480, 0.7450, 0.7410.
Уровни сопротивления: 0.7650, 0.7670, 0.7700, 0.7735, 0.7770, 0.7800.
Торговые сценарии
В данной ситуации актуально наращивать короткие позиции от уровней 0.7700, 0.7770, 0.7800 с целями 0.7450, 0.7410 и стоп-лоссом 0.7870.
Current trend
In June, the Australian dollar against the US one continues to recover after a significant fall in April and early May. The pair returned to the medium-term downward channel and has now reached the upper border of this trend.
The main catalyst for this movement was the fall in the attractiveness of the overbought American currency: investors fix short positions, waiting for a longer upward correction. Moreover, strong economic growth data for Q1 were released in Australia, which gave serious support to AUD.
This week, there will be no key releases for the US dollar, so one should not expect increased interest in the currency.
Support and resistance
The pair stopped at a strong resistance level of 0.7670, which is the upper border of the descending channel, which makes it difficult to pass this mark. On the other hand, a strong fundamental background in Australia and a decline in demand for USD can provide momentum for further growth with the possibility of the upward correction to the levels of 0.7700, 0.7800. From them, the instrument can go down to local minima: one should not expect a fall from the current level, but the overall trend remains descending.
Technical indicators on W1 chart confirm the decline forecast in the medium term: MACD indicates the preservation of the high volume of short positions, and Bollinger Bands are pointing downwards.
Support levels: 0.7600, 0.7560, 0.7530, 0.7505, 0.7480, 0.7450, 0.7410.
Resistance levels: 0.7650, 0.7670, 0.7700, 0.7735, 0.7770, 0.7800.
Trading tips
Short positions may be opened from levels of 0.7700, 0.7770, 0.7800 with targets at 0.7450, 0.7410 and stop-loss at 0.7870.
AUD/USD: коррекция может затянуться
Текущая динамика
В июне австралийская валюта против доллара США продолжает восстанавливаться после существенного падения в апреле и начале мая. Пара вернулась в нисходящий среднесрочный канал и на текущий момент достигла верхней границы этой тенденции.
Основным катализатором такого движения стало падение привлекательности перекупленной американской валюты: инвесторы фиксируют короткие позиции, ожидая более длинной коррекции вверх. Помимо этого, в Австралии вышли сильные данные по темпам роста экономики в первом квартале текущего года, что придало серьёзную поддержку AUD.
Ключевых для доллара США релизов на текущей неделе не будет, поэтому повышенного интереса к валюте ожидать не стоит.
Уровни поддержки и сопротивления
В текущей ситуации пара остановилась у сильного уровня сопротивления 0.7670, который является верхней границей нисходящего канала, что затрудняет прохождение этой отметки. С другой стороны, сильный фундаментальный фон по Австралии и спад спроса на американский доллар может обеспечить импульс для дальнейшего роста с возможностью продолжения восходящей коррекции к уровням 0.7700, 0.7800. Уже от них инструмент может направиться вниз к локальным минимумам: ждать падения от текущего уровня не стоит, но общий тренд остается нисходящим.
Технические индикаторы на недельном графике подкрепляют прогноз снижения в среднесрочной перспективе: MACD указывает на сохранение высокого объёма коротких позиций, полосы Боллинджера направлены вниз.
Уровни поддержки: 0.7600, 0.7560, 0.7530, 0.7505, 0.7480, 0.7450, 0.7410.
Уровни сопротивления: 0.7650, 0.7670, 0.7700, 0.7735, 0.7770, 0.7800.
Торговые сценарии
В данной ситуации актуально наращивать короткие позиции от уровней 0.7700, 0.7770, 0.7800 с целями 0.7450, 0.7410 и стоп-лоссом 0.7870.
AUD/USD: коррекция может затянуться
Текущая динамика
В июне австралийская валюта против доллара США продолжает восстанавливаться после существенного падения в апреле и начале мая. Пара вернулась в нисходящий среднесрочный канал и на текущий момент достигла верхней границы этой тенденции.
Основным катализатором такого движения стало падение привлекательности перекупленной американской валюты: инвесторы фиксируют короткие позиции, ожидая более длинной коррекции вверх. Помимо этого, в Австралии вышли сильные данные по темпам роста экономики в первом квартале текущего года, что придало серьёзную поддержку AUD.
Ключевых для доллара США релизов на текущей неделе не будет, поэтому повышенного интереса к валюте ожидать не стоит.
Уровни поддержки и сопротивления
В текущей ситуации пара остановилась у сильного уровня сопротивления 0.7670, который является верхней границей нисходящего канала, что затрудняет прохождение этой отметки. С другой стороны, сильный фундаментальный фон по Австралии и спад спроса на американский доллар может обеспечить импульс для дальнейшего роста с возможностью продолжения восходящей коррекции к уровням 0.7700, 0.7800. Уже от них инструмент может направиться вниз к локальным минимумам: ждать падения от текущего уровня не стоит, но общий тренд остается нисходящим.
Технические индикаторы на недельном графике подкрепляют прогноз снижения в среднесрочной перспективе: MACD указывает на сохранение высокого объёма коротких позиций, полосы Боллинджера направлены вниз.
Уровни поддержки: 0.7600, 0.7560, 0.7530, 0.7505, 0.7480, 0.7450, 0.7410.
Уровни сопротивления: 0.7650, 0.7670, 0.7700, 0.7735, 0.7770, 0.7800.
Торговые сценарии
В данной ситуации актуально наращивать короткие позиции от уровней 0.7700, 0.7770, 0.7800 с целями 0.7450, 0.7410 и стоп-лоссом 0.7870.
LiteFinance
USD/JPY: Murrey analysis
On D1 chart, the price rose above the level of 109.37 ([6/8]) and tests the midline of Bollinger Bands near 109.70 area. Consolidation of the instrument above this level will give the prospect of growth to 110.93 ([7/8]) and 111.71 ([+2/8], H4). Otherwise, the price may resume decline to the levels of 108.20 ([1/8], H4) and 107.81 ([5/8]).
Technical indicators don't provide a clear signal. MACD histogram stopped declining but is still close to the zero line. Stochastic is pointing down but has approached the oversold zone, so a reverse and the formation of a sell signal are likely.
Support and resistance
Support levels: 109.37 ([6/8]), 108.20 ([1/8], H4), 107.81 ([5/8]).
Resistance levels: 110.00 (weekly maximum), 110.93 ([7/8]), 111.71 ([+2/8], H4).
Trading tips
Short positions may be opened below 109.37 with targets at 108.20, 107.81 and the stop-loss at 109.70.
Long positions may be opened above the level of 110.00 with targets at 110.93, 111.71 and stop-loss at 109.70.
Implementation time: 5-7 days.
USD/JPY: анализ уровней Мюррея
На дневном графике цена поднялась выше отметки 109.37 ([6/8]) и тестирует среднюю линию полос Боллинджера в районе 109.70. Закрепление инструмента выше этого уровня даст перспективу продолжения роста к отметкам 110.93 ([7/8]) и 111.71 ([+2/8], H4). В противном случае цена может возобновить снижение к уровням 108.20 ([1/8], H4) и 107.81 ([5/8]).
Технические сигналы не дают чёткого сигнала. Гистограмма MACD приостановила снижение, но всё ещё близка к нулевой линии. Стохастик направлен вверх, но подходит к зоне перекупленности, что чревато разворотом и формированием сигнала на продажу.
Уровни поддержки и сопротивления
Уровни поддержки: 109.37 ([6/8]), 108.20 ([1/8], H4), 107.81 ([5/8]).
Уровни сопротивления: 110.00 (недельный максимум), 110.93 ([7/8]), 111.71 ([+2/8], H4).
Торговые сценарии
Короткие позиции стоит открывать ниже отметки 109.37 с целями 108.20, 107.81 и стоп-лоссом 109.70.
Длинные позиции статут актуальны выше отметки 110.00 с целями 110.93, 111.71 и стоп-лоссом 109.70.
Срок реализации: 5-7 дней.
LiteFinance
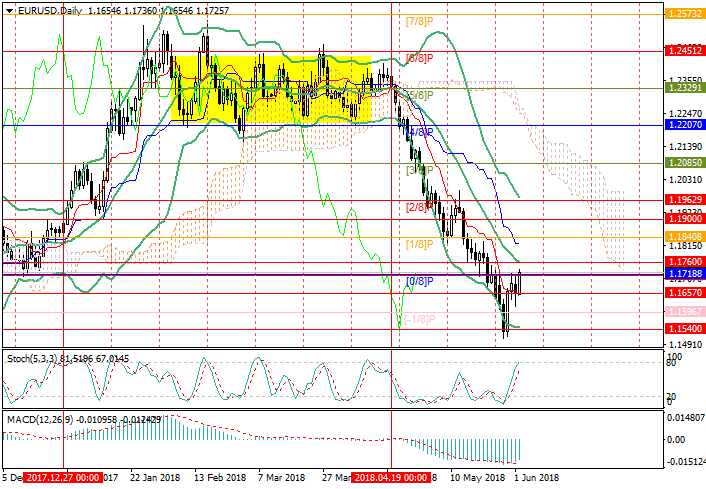
EUR/USD: general analysis
Current trend
Published on Friday, the May data from the US labor market proved to be strong. The number of Nonfarm Payrolls has grown stronger than forecasts from 159K to 223K. The average wage has expectedly increased by 2.7%, and the unemployment rate has dropped to 3.8%. On the one hand, the good state of the labor market helps raise the Fed's interest rate. However, the complication of trade relations with the EU leads to an increase in the uncertainty of the American economy, which means that the regulator may delay the tightening of monetary policy. James Bullard, the head of the FRB of St. Louis, said this on Friday.
Since June 1, US have implied taxes on EU Canadian and Mexican steel and aluminum. In reply, the will imply taxes on a number of US goods, and EU plans to initiate WTO proceedings. This week in Canada, the G7 leaders will meet to discuss the trade disputes. Beijing can refuse form earlier agreements if the US introduces new taxes on Chinese goods.
Support and resistance
The price returns to Murray main range, consolidating above 1.1718 (Murray [0/8]). In this case, the instrument can reach 1.1840 (Murray [1/8]), 1.1900 and 1.1962 (Murray [2/8], the upper border of Bollinger bands). Otherwise, the pair can return to 1.1540 (Murray [5/8], H4). Technical indicators are ambiguous. Bollinger bands are directed downwards. MACD decreases in the negative zone. Stochastic is directed upwards, reaching the overbought zone.
Resistance levels: 1.1718, 1.1840, 1.1900.
Support levels: 1.1657, 1.1596, 1.1540.
Trading tips
Long positions can be opened above 1.1718 and the midline of Bollinger bands (1.1760) with the targets at 1.1840, 1.1900 and stop loss 1.1710.
Short positions can be opened below 1.1657 with the targets at 1.1596, 1.1540 and stop loss around of 1.1690.
EUR/USD: общий обзор
Текущая динамика
Опубликованные в пятницу майские данные с американского рынка труда оказались сильными. Количество рабочих мест вне сельскохозяйственного сектора выросло сильнее прогнозов со 159 до 223 тысяч. Средняя заработная плата ожидаемо выросла на 2,7%, а уровень безработицы снизился и составил 3,8%. С одной стороны, хорошее состояние рынка труда способствует повышению ФРС процентной ставки. Однако осложнение торговых отношений с ЕС приводит к росту неопределённости американкой экономики, а значит, регулятор может повременить с ужесточением монетарной политики. На это в пятницу указал глава ФРБ Сент-Луиса Джеймс Буллард.
C 1 июня Дональд Трамп ввёл пошлины на сталь и алюминий, произведённые в еврозоне, Канаде и Мексике. Вот ответ эти страны намерены ввести налоги на ряд производимых в США товаров, а ЕС планирует начать разбирательство в рамках ВТО. На этой неделе в Канаде состоится встреча лидеров G7, и тема торговых споров обещает стать центральной. Дополнительный негатив в ситуацию вносит Пекин, который может отказаться от выполнения достигнутых ранее соглашений, если администрация Трампа введёт новые пошлины на китайские товары.
Уровни поддержки и сопротивления
В настоящее время цена пытается вернуться в рамки основного диапазона Мюррея, закрепившись выше отметки 1.1718 (Мюррей [0/8]). Если это удастся, то инструмент может достигнуть уровней 1.1840 (Мюррей [1/8]), 1.1900 и 1.1962 (Мюррей [2/8], верхняя граница полос Боллинджера). В противном случае пара может вернуться к отметке 1.1540 (Мюррей [5/8], H4). Технические индикаторы не дают чёткого сигнала. Полосы Боллинджера направлены вниз. MACD уменьшается в отрицательной зоне. Стохастик направлен вверх и приближается к зоне перекупленности.
Уровни сопротивления: 1.1718, 1.1840, 1.1900.
Уровни поддержки: 1.1657, 1.1596, 1.1540.
Торговые сценарии
Покупать можно выше отметки 1.1718 и средней линии полос Боллинджера (1.1760) с целями 1.1840, 1.1900 и стоп-лоссом у отметки 1.1710.
Открывать короткие позиции можно ниже уровня 1.1657 с целями 1.1596, 1.1540 и стоп-лоссом в районе 1.1690.
LiteFinance
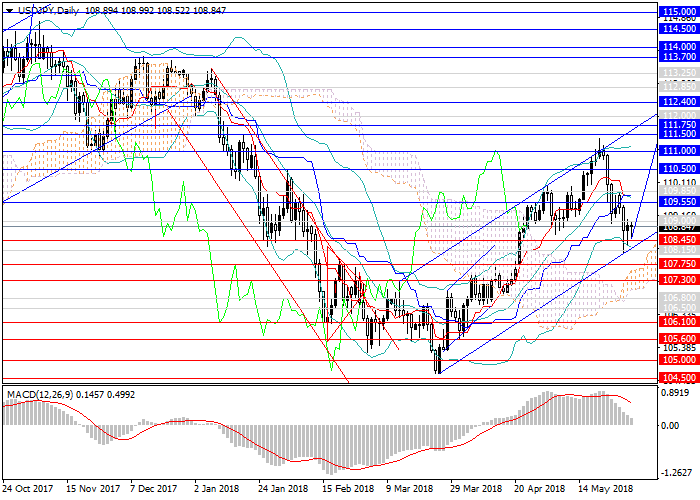
USD/JPY: the upward trend restores
Current trend
The significant USD growth against JPY in April and in the first half of May changed to a long downwards correction. In a few days, the pair lost more than 300 points and reached the support level of 108.15, despite the strong USD positions. The main catalyst was data from the Bank of Japan, which received approval to abandon the timeframe to achieve the inflation target, which means that in future the regulator will not target to maintaining the aggressive mitigation policy. However, the pair stopped at a key support level and could not go lower. In the medium term, this fall should be considered as a long correction, after which the upward trend will resume.
Today and tomorrow a block of key US releases, that can support USD additionally (Initial Jobless Claims, Unemployment Rate, and Nonfarm Payrolls), will be published.
Support and resistance
In the medium term, the upward trend will develop to the levels of 111.75, 112.00. USD will continue to grow due to positive main US economy sectors statistics. On the daily chart, technical indicators support the forecast: the growth of MACD long positions’ volumes restored, Bollinger bands are directed upwards.
Resistance levels: 109.00, 109.55, 109.85, 110.50, 111.00, 111.50, 111.75, 112.00.
Support levels: 108.45, 108.15, 107.75, 107.30, 106.80, 106.10.
LiteFinance

EUR/USD: general analysis
Current trend
Yesterday, the pair correctionally grew and is now trying to consolidate above the level of 1.1718. USD is under pressure of canceling the US-DPRK summit, moreover, next week new sanctions may be imposed on DPRK. However, EUR is unstable due to the Italian and Spanish government crisis. The Socialist Party of Spain is ready to vote of no confidence in Prime Minister Mariano Rajoy, whose advisers are accused of corruption.
Investors continue to follow the development of US-China trade disputes. The recent agreements on the mutual suspension of duties and of the US trade deficit with the US 200 billion aroused serious criticism in the US Congress. The Donald Trump to declare that the trade agreement with the PRC could be changed since it is difficult to verify its results. Market participants saw in this the possibility of a breakdown of the transaction. In addition, the US currency is weakened due to the data. There are fears that the following duties on metals, the president's administration and the trade war (this time with Germany, Japan, and South Korea) will get a new round.
Support and resistance
The consolidation above 1.1718 (Murray [2/8]) will let the price grow to the levels of 1.1840 (Bollinger bands’ middle line), 1.1900. However, the indicators reflect the strength of sellers, so the decline to 1.1596 (Murray [–1/8]) and 1.1540 is possible. Bollinger bands are pointed down, MACD is growing in the negative zone, Stochastic is reversing downwards.
Resistance levels: 1.1780, 1.1840, 1.1900.
Support levels: 1.1657, 1.1596, 1.1540.
Trading tips
Short positions can be opened at the level 1.1657 with the targets at 1.1596, 1.1540 and stop loss 1.1690.
Long positions can be opened at the level 1.1780 with the targets at 1.1840, 1.1900 and stop loss 1.1740.
LiteFinance
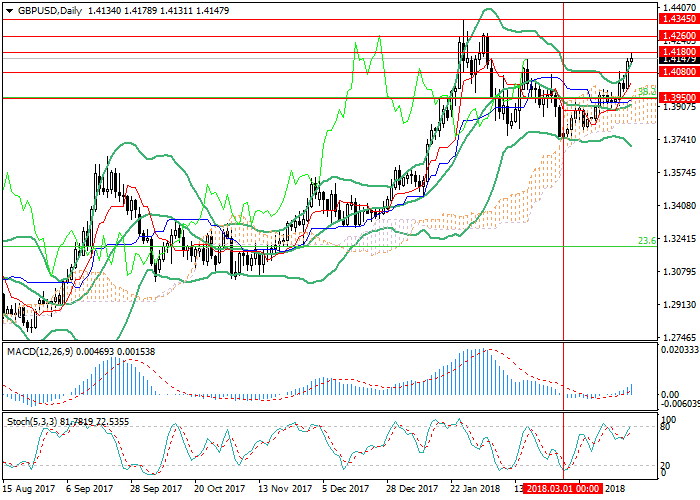
XAG/USD: technical analysis
XAG/USD, D1
On the daily chart,the instrument is trading in the upper Bollinger band. The price remains just below its moving averages that are horizontal. The RSI is testing from below its longer MA. The Composite is growing, having broken out its longer MA.
XAG/USD, H4
On the 4-hour chart,the instrument is trading in the upper Bollinger band. The price remains on the level with its moving averages that are horizontal. The RSI turned down just below the border of the overbought zone. The Composite is falling, having broken down its longer MA.
Key levels
Support levels:16.35 (local lows), 16.05 (March lows), 15.95 (April lows).
Resistance levels:16.75 (March highs), 16.95 (local highs), 17.05 (local highs).
Trading tips
The price keeps trading in a sideways channel. There is a chance of a downward correction.
Short positions can be opened from the level of 16.35 with targets at 16.05, 15.95 and stop-loss at 16.55. Validity – 3-5 days.
Long positions can be opened from the level of 16.75 with targets at 16.95, 17.05 and stop-loss at 16.60. Validity – 3-5 days.
XAG/USD: технический анализ
XAG/USD, D1
На дневном графике инструмент торгуется в верхней полосе Боллинджера. Цена находится прямо под своими скользящими средними, направленными горизонтально. RSI снизу тестирует свою долгосрочную MA. Composite растёт, преодолев свою долгосрочную MA.
XAG/USD, H4
На 4-часовом графике инструмент торгуется в верхней полосе Боллинджера. Цена находится на одном уровне со своими скользящими средними, направленными горизонтально. RSI развернулся вниз немного ниже границе области перекупленности. Composite снижается, преодолев свою долгосрочную MA.
Ключевые уровни
Уровниподдержки: 16.35 (локальные минимумы), 16.05 (минимумы марта), 15.95 (минимумы апреля).
Уровнисопротивления: 16.75 (максимумы марта), 16.95 (локальные максимумы), 17.05 (локальные максимумы).
Торговые сценарии
Ценапродолжаетторговатьсявбоковом канале. Существует вероятность нисходящей коррекции.
Короткиепозицииможно открывать от уровня 16.35 с целями 16.05, 15.95 и стоп-лоссом на отметке 16.55. Срокреализации — 3-5 дней.
Длинныепозицииможнооткрыватьот уровня 16.75 с целями 16.95, 17.05 и стоп-лоссом на отметке 16.60. Срокреализации — 3-5 дней.
XAG/USD, D1
On the daily chart,the instrument is trading in the upper Bollinger band. The price remains just below its moving averages that are horizontal. The RSI is testing from below its longer MA. The Composite is growing, having broken out its longer MA.
XAG/USD, H4
On the 4-hour chart,the instrument is trading in the upper Bollinger band. The price remains on the level with its moving averages that are horizontal. The RSI turned down just below the border of the overbought zone. The Composite is falling, having broken down its longer MA.
Key levels
Support levels:16.35 (local lows), 16.05 (March lows), 15.95 (April lows).
Resistance levels:16.75 (March highs), 16.95 (local highs), 17.05 (local highs).
Trading tips
The price keeps trading in a sideways channel. There is a chance of a downward correction.
Short positions can be opened from the level of 16.35 with targets at 16.05, 15.95 and stop-loss at 16.55. Validity – 3-5 days.
Long positions can be opened from the level of 16.75 with targets at 16.95, 17.05 and stop-loss at 16.60. Validity – 3-5 days.
XAG/USD: технический анализ
XAG/USD, D1
На дневном графике инструмент торгуется в верхней полосе Боллинджера. Цена находится прямо под своими скользящими средними, направленными горизонтально. RSI снизу тестирует свою долгосрочную MA. Composite растёт, преодолев свою долгосрочную MA.
XAG/USD, H4
На 4-часовом графике инструмент торгуется в верхней полосе Боллинджера. Цена находится на одном уровне со своими скользящими средними, направленными горизонтально. RSI развернулся вниз немного ниже границе области перекупленности. Composite снижается, преодолев свою долгосрочную MA.
Ключевые уровни
Уровниподдержки: 16.35 (локальные минимумы), 16.05 (минимумы марта), 15.95 (минимумы апреля).
Уровнисопротивления: 16.75 (максимумы марта), 16.95 (локальные максимумы), 17.05 (локальные максимумы).
Торговые сценарии
Ценапродолжаетторговатьсявбоковом канале. Существует вероятность нисходящей коррекции.
Короткиепозицииможно открывать от уровня 16.35 с целями 16.05, 15.95 и стоп-лоссом на отметке 16.55. Срокреализации — 3-5 дней.
Длинныепозицииможнооткрыватьот уровня 16.75 с целями 16.95, 17.05 и стоп-лоссом на отметке 16.60. Срокреализации — 3-5 дней.
LiteFinance
WTI Crude Oil: Murrey analysis
This week, the price of WTI Crude oil continued to grow and is now testing the 71.87 mark ([6/8]). Its breakout will give the prospect of further growth to the levels of 73.43 ([7/8]) and 75.00 ([8/8]). Technical indicators generally confirm the development of an uptrend: Bollinger Bands are directed upwards, and MACD histogram grows in the positive zone; Stochastic is directed downwards, but it makes a reversal attempt.
In the price fails to consolidate above 71.87, correction to the mid-range of Bollinger Bands (69.53) or to the mid-range of the Murray trade range (68.75 [4/8]) is possible. But so far this scenario seems less probable.
Support and resistance
Support levels: 70.31 ([5/8]), 69.53 ([1/8], H4), 68.75 ([4/8]).
Resistance levels: 71.87 ([6/8]), 73.43 ([7/8]), 75.00 ([8/8]).
Trading tips
Long positions may be opened above the 71.87 mark with targets at 73.43, 75.00 and the stop-loss at 71.20.
Short positions may be opened from the level of 71.00 with targets at 70.31, 69.53 and the stop-loss at 71.50.
Implementation time: 5-7 days.
WTI Crude Oil: анализ уровней Мюррея
На текущей неделе цена нефти марки WTI продолжила рост и сейчас тестирует отметку 71.87 ([6/8]). Её пробой даст перспективу дальнейшего роста к уровням 73.43 (7/8]) и 75.00 ([8/8]). Технические индикаторы в целом подтверждают развитие восходящего тренда: полосы Боллинджера направлены вверх, гистограмма MACD растёт в положительной зоне. Стохастик направлен вниз, но предпринимает попытку разворота.
В том случае, если выше уровня 71.87 закрепиться не удастся, возможна коррекция в район средней линии полос Боллинджера (69.53) или к средней линии торгового диапазона Мюррея (68.75 [4/8]). Но пока этот сценарий видится менее вероятным.
Уровни поддержки и сопротивления
Уровни поддержки: 70.31 ([5/8]), 69.53 ([1/8], H4), 68.75 ([4/8]).
Уровни сопротивления: 71.87 ([6/8]), 73.43 ([7/8]), 75.00 ([8/8]).
Торговые сценарии
Длинные позиции стоит открывать выше отметки 71.87 с целями 73.43, 75.00 и стоп-лоссом в районе 71.20.
Короткие позиции можно открывать от уровня 71.00 с целями 70.31, 69.53 и стоп-лоссом 71.50.
Срок реализации: 5-7 дней.
LiteFinance
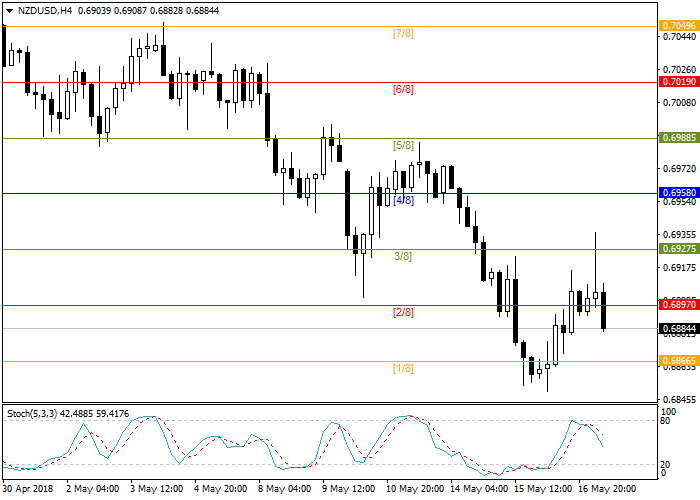
NZD/USD: general review
Current trend
NZD continues to decline against USD, demand for which is caused by rising interest rates and an increase in yields on 10-year treasury bonds.
High oil prices increase inflationary pressures and the likelihood of a more aggressive change in monetary policy by the Fed. The fundamental economic indicators in the US are also growing: the industrial production indicator last month increased by 0.7% with a forecast of 0.6%. As experts say, the production capacity in the country is actually used by 75%, which is a record since 2015 and is considered a sign of a fast-growing economy. In the US GDP, the production sector occupies about 12%.
As for New Zealand, the negative factors for the currency include the recent decision by the government to ban the issuance of new permits for oil production. The state intends to combat climate change this way. Many experts have already criticized this initiative, as it will negatively affect the economy of the country and significantly reduce the supply of new jobs.
Today, the data on secondary jobless claims in the US and the index of leading indicators will be published.
Support and resistance
Stochastic is at 70 points and does not provide a clear signal for the opening of positions.
Resistance levels: 0.6927, 0.6958.
Support levels: 0.6866, 0.6844.
NZD/USD: общий анализ
Текущая динамика
Новозеландская валюта продолжает снижение против доллара США, спрос на который вызван ростом процентных ставок и увеличением доходностей по 10-летним казначейским облигациям.
Высокие цены на нефть увеличивают инфляционное давление и повышают вероятность более агрессивного изменения монетарной политики со стороны ФРС. Растут и фундаментальные экономически показатели в США: так, индикатор промышленного производства в прошлом месяце увеличился на 0,7% при прогнозе в 0,6%. Как отмечают эксперты, производственные мощности в стране задействованы фактически на 75%, что является рекордом с 2015 года и считается признаком быстрорастущей экономики. В ВВП США производственный сектор занимает порядка 12%.
Что касается Новой Зеландии, к негативным факторам для валюты можно отнести недавнее решение правительства страны запретить выдачу новых разрешений на добычу нефти. Таким образом государство намеревается бороться с климатическими изменениями. Многие эксперты уже раскритиковали данную инициативу, так как она негативно повлияет на экономику страны и значительно сократит предложение новых рабочих мест.
Сегодня будут опубликованы данные по повторным заявкам по безработице в США и индекс ведущих индикаторов.
Уровни поддержки и сопротивления
Стохастик находится на отметке 70 пунктов и не дает сигналов для открытия позиций.
Уровни сопротивления: 0.6927, 0.6958.
Уровни поддержки: 0.6866, 0.6844.
LiteFinance
USD/CHF: general review
Current trend
Since earlier this week, the pair is trading in a narrow price range, near the psychological level of 1.0000.
Mixed statistics on retail sales published in the US yesterday had no significant impact on the instrument. The volume of trading fell before the head of the National Bank of Switzerland Thomas Jordan's speech, and the further dynamics of the pair will depend on his comments. Investors are cautious before the second round of the US-China talks.
Today, a large number of macroeconomic publications are expected, which can lead to strong volatility in the market. Investors will monitor the release of data on the consumer price index of the eurozone (11:00 GMT+2), the statement by ECB head Mario Draghi (14:00 GMT+2), the real estate market statistics in the US (14:30 GMT+2). The key event is the speech by the Swiss regulator head at 18:00 (GMT+2).
Support and resistance
On the H4 chart, the instrument corrected to the moving average of Bollinger Bands. The indicator is directed sideways, the price range has not significantly decreased, confirming the correction of the instrument. Significant resistance is the level of 1.0030, the breakout of which will form a signal to open positions for purchase. MACD histogram is in the neutral zone, the signal for entering the market is not formed. Stochastic does not give a clear signal for opening positions.
Support levels: 0.9850, 0.9892, 0.9927, 0.9968, 1.0000.
Resistance levels: 1.0031, 1.0058, 1.0095, 1.0125.
Trading tips
Long positions may be opened above the level of 1.0030 with target at 1.0095 and stop-loss at 0.9990. Implementation period: 1-2 days.
Short positions may be opened below the level of 0.9985 with target at 0.9940 and stop-loss at 1.0010. Implementation period: 1-2 days.
US Dollar vs Swiss Franc
Buy Sell Spread
1.00075 1.00044 31
Scenario
Timeframe Day's Range
Recommendations BUY STOP
Entry Point 1.0035
Take Profit 1.0095
Stop Loss 0.9990
Support levels 0.9850, 0.9892, 0.9927, 0.9968, 1.0000, 0.9850, 0.9892, 0.9927, 0.9968, 1.0000
Alternative scenario
Recommendations SELL STOP
Entry Point 0.9980
Take Profit 0.9940
Stop Loss 1.0010
Support levels 0.9850, 0.9892, 0.9927, 0.9968, 1.0000, 0.9850, 0.9892, 0.9927, 0.9968, 1.0000
: