Andy Ismail
Andy Ismail
  • Information
9+ Jahre
Erfahrung
13
Produkte
323
Demoversionen
0
Jobs
0
Signale
0
Abonnenten
Andy Ismail
Andy Ismail
Forex News Anchor is all in one forex news provider from major forex websites, like:
forexfactory.com, fxstreet.com, investing.com, fxbazooka.com and many more !

https://play.google.com/store/apps/details?id=com.forex.live.signal
Andy Ismail
Andy Ismail
NZDUSD Sell Feb 21' 16 : SELL

https://www.mql5.com/en/market/product/12101
Roberto Jacobs
Roberto Jacobs 2016.02.21
Disagree..!!
Roberto Jacobs
Roberto Jacobs 2016.02.22
Jika anda jadi SELL hari ini, maka anda sudah kalah kawan.. ^_^
Andy Ismail
Andy Ismail
GBPUSD Sell Limit
Rozana Sustar
Rozana Sustar 2016.02.07
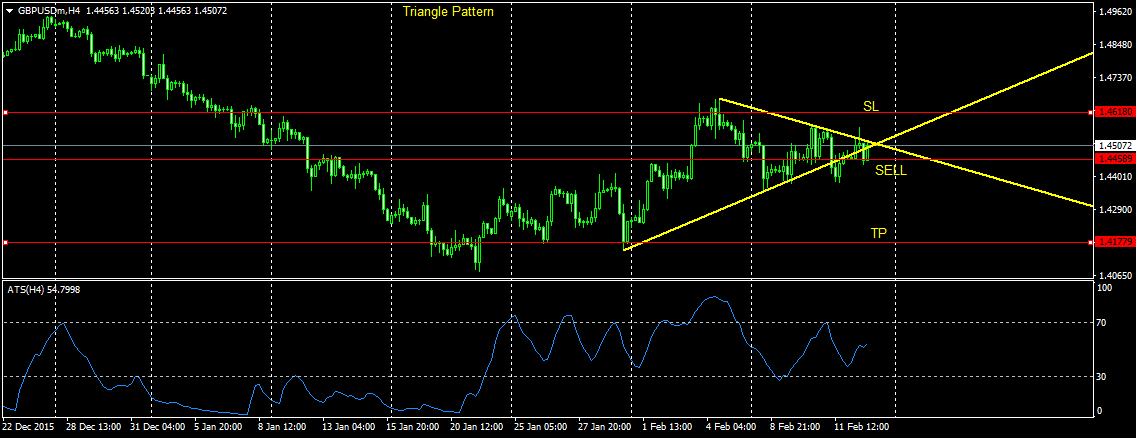
Better SL is at 1.46800, the current resistance level. You would risk less....
Andy Ismail
Andy Ismail 2016.02.07
yes, i agree
Andy Ismail
Andy Ismail
AUDJPY for 10 years performance every february 7 times up, 3 times down. February 2016 : 70% UP probability
Rozana Sustar
Rozana Sustar 2016.02.07
That is gambling....
Andy Ismail Hat ein Produkt angeboten

This indicator based on Alpha Trend Spotter, Moving Average, and RSI Indicators. Its Customized for H4 (Four Hour) Timeframe where the price do real swing. This indicator doesn't have setting value, just plug and play in H4 Timeframe. Best performance with pairs: EURUSD GBPUSD EURJPY GBPJPY Entry conditions: LINE CROSS ATS < 30, HOLD and then line TOUCHING BACK TO 30 = LONG ENTRY LINE CROSS ATS > 70, HOLD and then line TOUCHING BACK TO 70 = SHORT ENTRY Exit conditions: LONG CLOSE IF CROSS

Andy Ismail Hat ein Produkt angeboten
Bewertungen: 2
30.00 USD

This indicator is another variant of the famous powerful indicator Fibonacci-SS https://www.mql5.com/en/market/product/10136 but has different behaviour in placing Pending Order and TP Line. Automatically places Fibonacci retracement lines from the last highest and lowest visible bars on the chart with: An auto Pending Order (Buy/Sell). Taking Profit 1, Taking Profit 2 is pivot point and Taking Profit 3 for extended reward opportunity. The best risk and reward ratio. Simple and powerful

Andy Ismail Hat ein Produkt angeboten

Fibonacci Swing Scalp (Fibonacci-SS) This indicator automatically places Fibonacci retracement lines from the last highest and lowest visible bars on the chart with an auto Pending Order (Buy/Sell), Stop Loss, Taking Profit 1, Taking Profit 2 and the best risk and reward ratio. This is a very simple and powerful indicator. This indicator's ratios are math proportions established in many destinations and structures in nature, along with many human produced creations. Finding out this particular

Andy Ismail Hat ein Produkt angeboten
Bewertungen: 1
30.00 USD

This indicator is customized for binary option trading like M1 timeframe or turbo option trading. The way a binary option works is from the traders perspective is that you choose whether or not a certain underlying asset (a stock, commodity, currency etc.) is going to go up or down in a certain amount of time. You essentially bet money on this prediction. You are shown how much money up front you will earn if your prediction is correct. If your prediction is wrong, you lose your bet and the

Andy Ismail Hat ein Produkt angeboten
Bewertungen: 1
30.00 USD

This indicator automatically draws Support and Resistance lines based on High and Low Candle at every timeframe. Support and resistance have a recurring nature as a trader goes through the process of building a strategy. Because of its importance, it is often reasonable for a trader to build object patterns for incorporating these prices into a strategy. When strong support and resistance levels are found, this can enable traders to effectively plot their approach, manage trades, and adjust risk

Andy Ismail Hat ein Produkt angeboten
Bewertungen: 1
30.00 USD

This indicator draws Fibonacci level automatically from higher high to lower low or from lower low to higher high. With adjustable Fibonacci range and has an alert function. How to use Fibonacci Risk Reward Ration (R3) into trading strategy Forex traders use Fibonacci-R3 to pinpoint where to place orders for market entry, for taking profits and for stop-loss orders. Fibonacci levels are commonly used in forex trading to identify and trade off of support and resistance levels. Fibonacci

Andy Ismail
Hat den Code MA Triple Median veröffentlicht
This indicator draws 3 Moving Averages by median price.
Andy Ismail
Andy Ismail
Alpha Trend Spotter + Price Action indicators, auto draw support-resistance and fibonacci based on higher high/lower low or lower low/higher high. Trend and Price Action in one chart
Andy Ismail Hat ein Produkt angeboten
Bewertungen: 1
30.00 USD

This Indicator will draw support and resistance (SR) in chart and give alert whenever there is a Support or Resistance Breakout. It has a variable to control SR line length (default 100) 500 is recommended. Support and resistance (SR) The concepts of support and resistance are undoubtedly two of the most highly discussed attributes of technical analysis and they are often regarded as a subject that is complex by those who are just learning to trade or even the expert traders. As we all know that

Andy Ismail Hat ein Produkt angeboten

30.00 USD

This indicator searches for the strongest trend and works on any timeframe. D1 timeframe is recomended. The product features three lines showing fast, medium and slow bars. If red bars appear at each of the three lines simultaneously, there is a strong bearish trend. If green bars appear at each of the three lines simultaneously, there is a strong bullish trend. The indicator does not repaint and can be combined with other indicators. It is also suitable for binary option trading

Andy Ismail Hat ein Produkt angeboten

Alpha Trend Spotter (ATS) Volume Break Out This is an indicator that combines Volume breakout/breakdown and Moving Average Breakout/breakdown. It is able to predict further price changes. It is not repainted, not recalculated. All lines are shown at the open of a new candlestick, never winking or vanishing in the current candle. These lines are appeared at the beginning of the current candle. Suitable for M5 to D1 Timeframe. How to Use: If Green line appears, that shows the "oversold" area, so