Crazy Color Cloud
- Indikatoren
- Igor Gerasimov
- Version: 2.2
- Aktualisiert: 10 April 2023
- Aktivierungen: 5
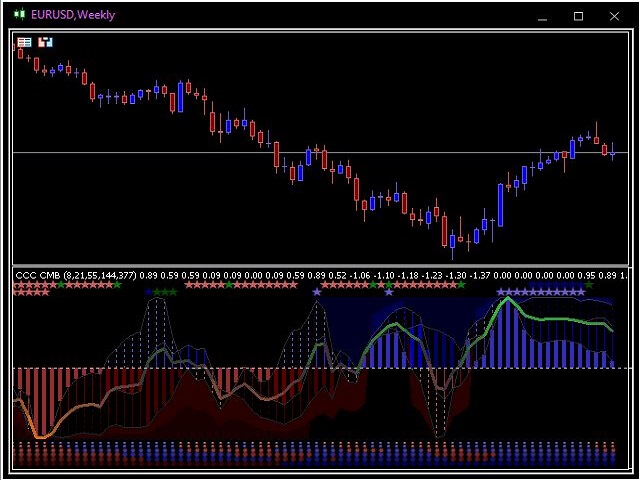
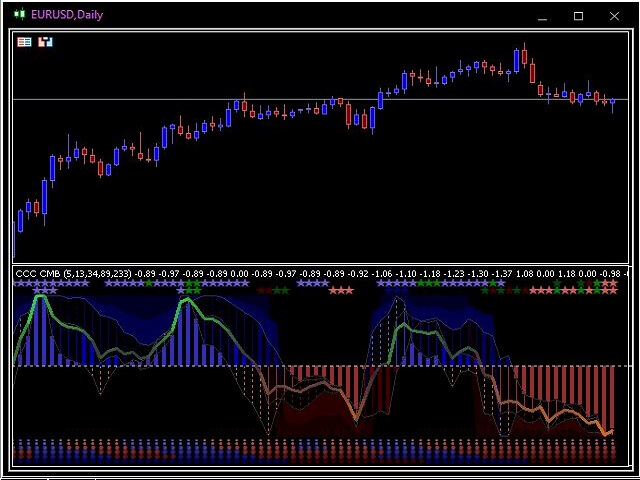
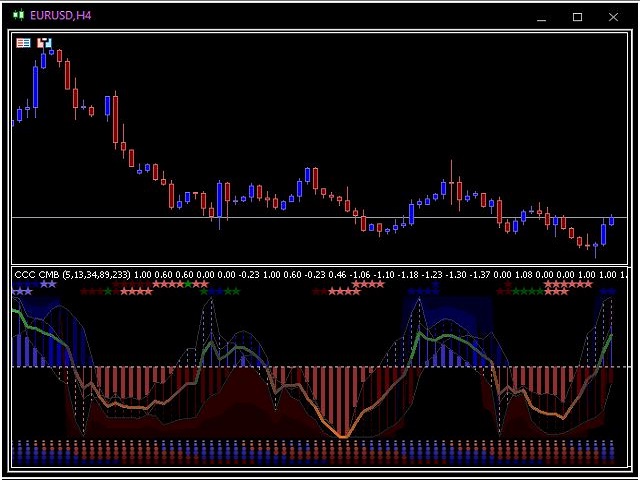
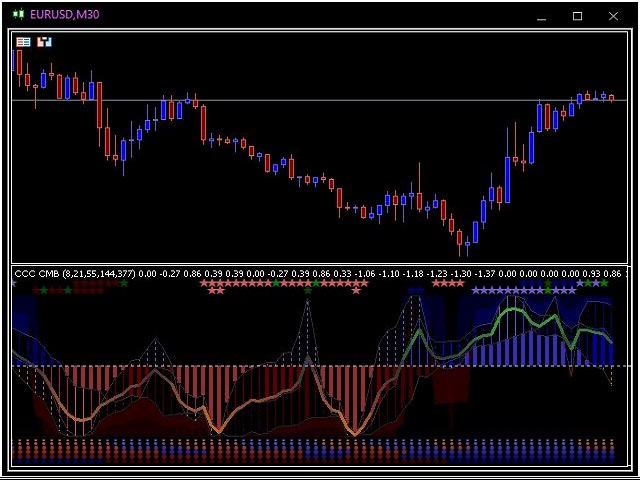
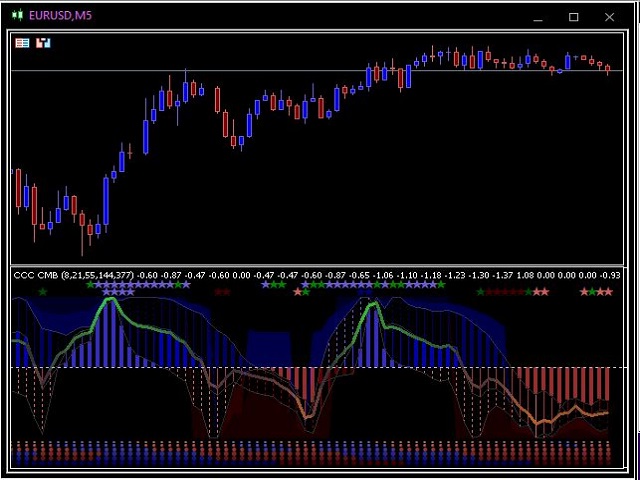
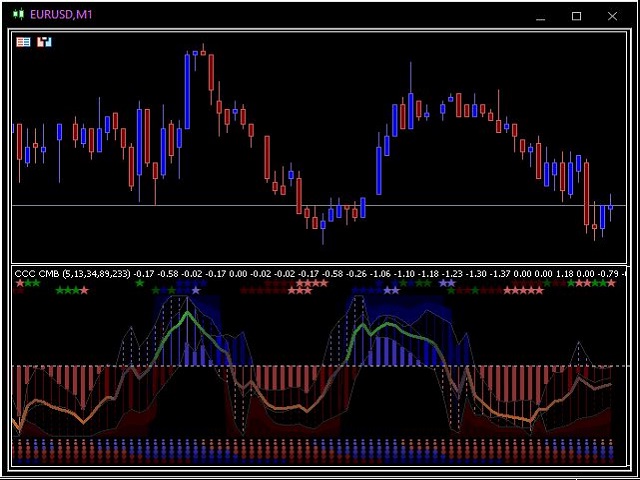
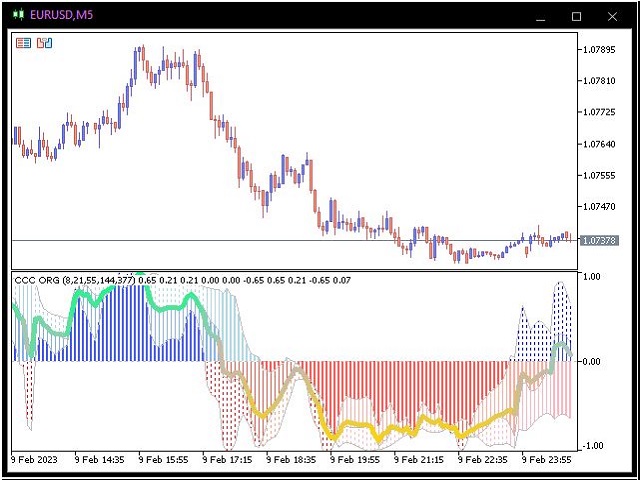
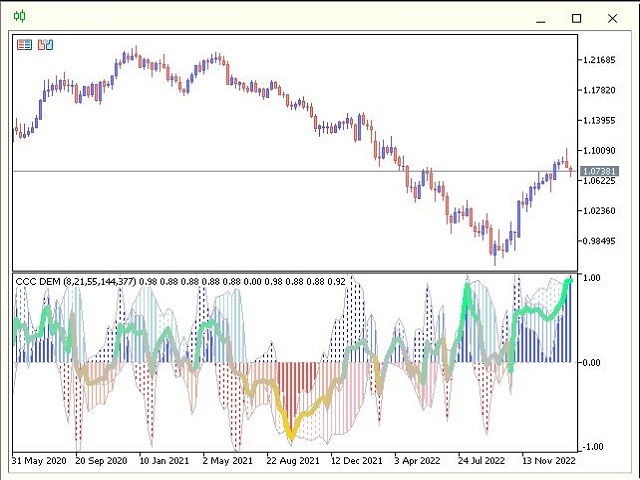
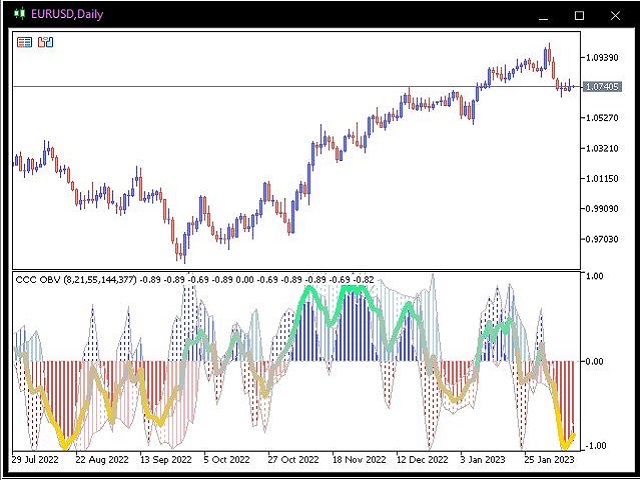
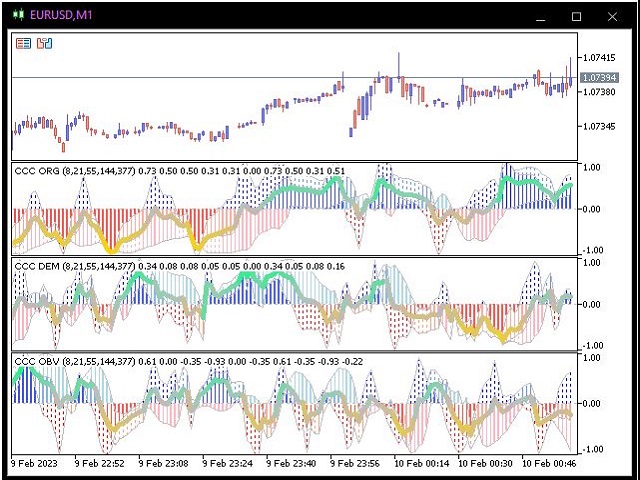
Dieser Indikator zeigt gefilterte Preisinformationen an
in Form von drei farbigen Histogrammen und einer gemeinsamen farbigen Linie.
Dies ist ein sehr farbenfroher und schöner Indikator.
Hervorragend geeignet, um die Stärke und Richtung der Preisbewegung zu bestimmen.
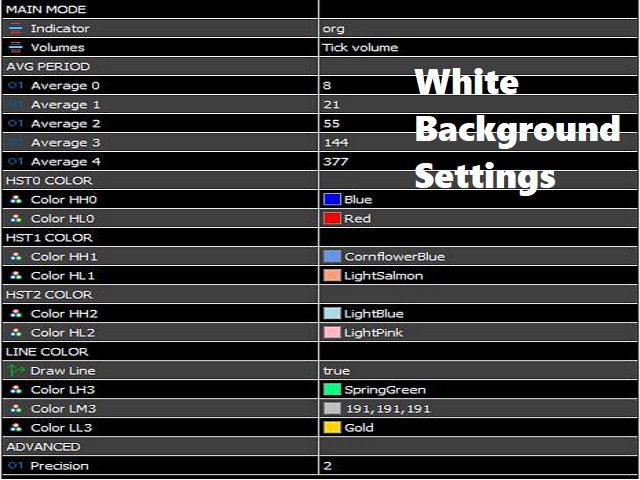
Dieser Indikator hat sehr einfache Einstellungen:
1) Auswahl von drei Optionen zur Berechnung des Indikators:
- ursprünglich,
- Entmarkierer,
- Ausgleichsvolumen.
2) Auswahl von fünf verschiedenen Perioden.
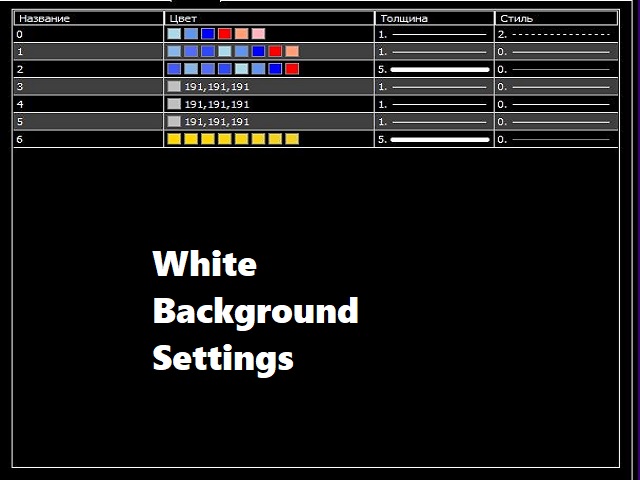
3) Auswahl der angezeigten Farbe.
4) Wahl der Genauigkeit.
////////////////////////////////////////////////// /////////
Ich hoffe, dieser Indikator wird Ihnen beim erfolgreichen Trading sehr nützlich sein.
Viel Glück.