• Übersicht
  • Bewertungen
  • Diskussion

R Var Moving Average

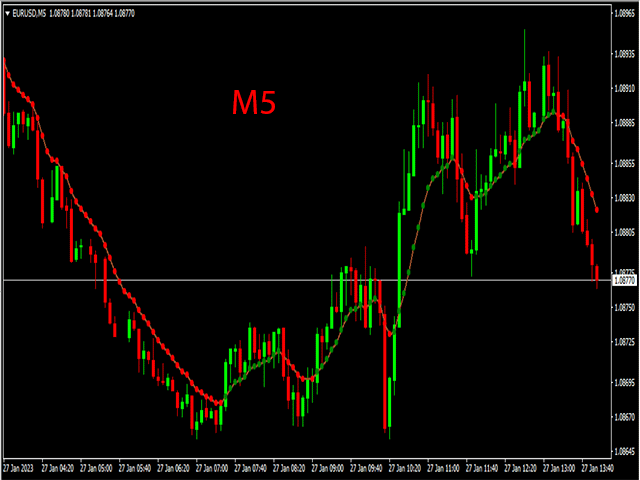
Der R Var Moving Average Indicator ist ein Trendfolgeindikator, der für eingefleischte Trendfolger entwickelt wurde.

Es ist ein sehr beliebter Devisenhandelsindikator unter Aktienhändlern sowie Rohstoffhändlern, und seine Popularität ergibt sich aus seiner Fähigkeit, seinen Benutzern echte Signale zum Geldverdienen zu liefern.

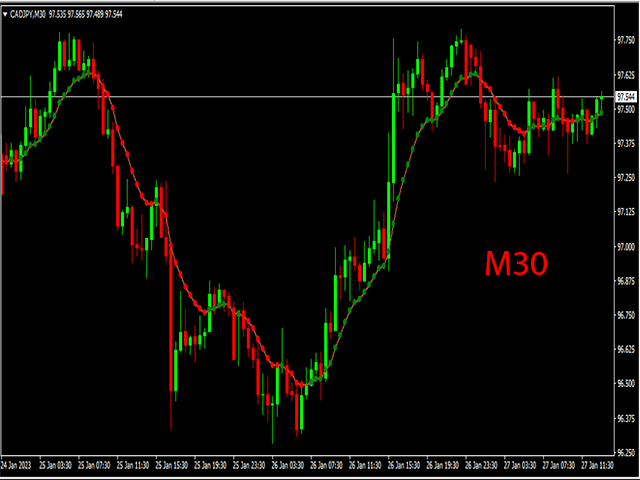
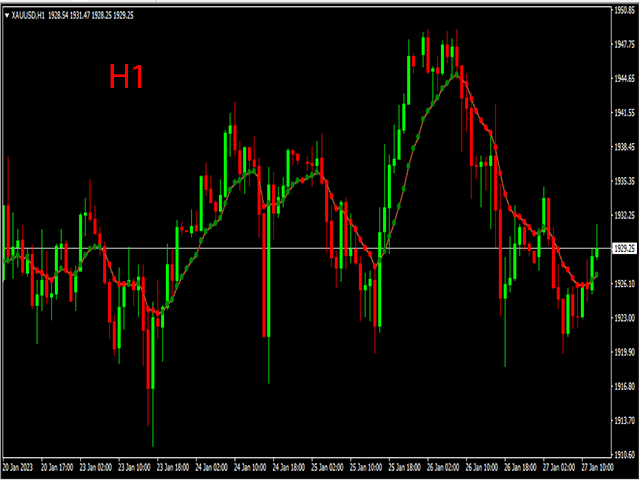
Der Indikator besteht aus grünen und roten Punkten, die auf einer Sienna-Linie platziert sind.
Der grüne Punkt zeigt auf ein bullisches Signal, während der rote Punkt ein rückläufiges Signal darstellt.

Grundlegende Handelssignale
Kaufsignal: Gehen Sie long, wenn die Punkte auf der Siena-Linie des Indikators grün werden.
Verkaufssignal: Gehen Sie short, wenn die Punkte auf der Siena-Linie des Indikators rot werden.
Kaufhandel beenden: Schließen Sie alle Kaufaufträge, wenn während eines anhaltenden Aufwärtstrends ein roter Punkt auf der Siena-Linie des Indikators erscheint.
Verkauf beenden: Schließen Sie alle Verkaufsaufträge, wenn während eines rückläufigen Trends ein grüner Punkt auf der Siena-Linie des R Var Moving Average-Indikators angezeigt wird.

Tipps
Verwenden Sie einen moderaten Stop-Loss, um sich vor falschen Signalen zu schützen, wenn Sie den R Var Moving Average-Indikator verwenden.

Verwenden Sie es für alle Arten von Handelsstilen, einschließlich Scalping und Daytrading.

Eigenschaften
Plattform: Metatrader 4

Währungspaare: Alle

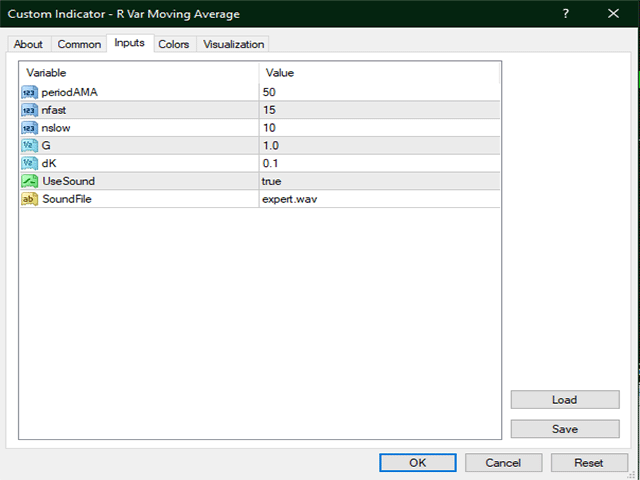
Anpassungsoptionen: Variabel (periodAMA, nfast, nslow, G, dK, UseSound, SoundFile), Breite & Stil.

Zeitrahmen: 1 Minute, 5 Minuten, 15 Minuten, 30 Minuten, 1 Stunde, 4 Stunden, 1 Tag, 1 Woche, 1 Monat

Typ: Trend
Empfohlene Produkte
Oscillator helps determine the direction of the market Shows the direction of the price movement and is painted in the appropriate color. Allows you to conduct trend and counter trend trading It works on all timeframes, on any currency pairs, metals and cryptocurrency Can be used when working with binary options Distinctive features Does not redraw; Simple and clear settings; It works on all timeframes and on all symbols; Suitable for trading currencies, metals, options and cryptocurrency (Bitco
FREE
MQLTA Candle Timer
MQL4 Trading Automation
5 (1)
MQLTA Candle Timer is an indicator that can show you the details about a symbol/pair and alert you before the close of a candle. Used in swing trading and not only, it can help your strategies knowing and be ready before the close of a candle. How does it work Simply add the indicator to the chart and set the notifications options. You can load a minimalistic interface or a full interface. The alert will be sent once per candle. Parameters All the parameters, that you can see in the picture,
FREE
MA Multi-Currencies  Multi-Timeframes Histogram BUY/SELL Indicator up to 6 currencies on time  calculations based on 6 time frames : M5, M15, M30, H1, H4, D1 Trading Strategies: **TREND shifts to UP trend when Green point appears after Red and Gray points -> Close SELL positions then add new BUY positions on new Green points  **TREND shifts to DOWN trend when Red point appears after Green and Gray points -> Close BUY  positions then add new SELL positions on new Red points ** Close BUY position
15 USD
100% non-repaint MT4 indicator with advance pre alert Pros: Neural Network based Advance price action algorithms Pre-alert (get ready) signals Non-delay indications 24/7 signals Can do Auto-trading  100% Non repaint 100% No lag No recalculating Lifetime license Cons: Very few signals Instructions to use: #1 Do not enter a trade if pre-alert appears on a hammer type candle. #2 Do not trade when market is making very small candles (indecision candles- dash
FREE
Hello all The indicator works to set higher levels and lower levels, while controlling the search in the number of candles from iBarsDayEnd iBarsDayBeg With the control of the size of the breakout candle from Step_Bars With the setting of the dummy target and the dummy stop loss With control from settings TakeProfit StopLoss With the control of turning the alarm on or off from OP_Alert The amount of winning and losing trades is shown on the chart
200 USD
EMA Dashboard
Chantal Sala
1 (1)
Ema Dashboard is an innovative dashboard that allows you to monitor Moving Average on multiples symbols and different timeframes. This dashboard allows you to analyze information on 28 pairs on an unique chart. Its functionality includes analysis of All Time Frames. This configuration allows you to identify the Long Term Trend with extreme ease. This panel allows you to take very important directional movements. A click on button opens a new chart (symbol and timeframe). Graphic Object Symbol
100 USD
Clever RSI
Carlos Forero
4 (1)
Description Better version of RSI indicator which offer a complete visual trading strategy and realize an auto-optimization Support:   We create great tools for the entire trading community. Most of them are free. If you believe in what we do  Support Us Here.   KEY LINKS:   How to Install  –  Frequent Questions  -  All Products  How is this indicator useful? NEVER repaints. Detect best parameters of RSI indicator, based on profit factor during the specified period. This indicator can be used as
FREE
Niubility Trend  Niubility Trend displays the trend direction for all time frames in real time. You'll see at a glance at which direction the trends are running, how long they last and how powerful they are. All this makes it an easy-to-use trend trading system for beginners, advanced and professional traders. Features Easy to trade Customizable colors and sizes It is non-repainting and non-backpainting It is fantastic as a trailing stop method It implements alerts of all kinds
30 USD
KFX Symbol Changer
Peter Kariuki Thande
5 (2)
KFX SMA: Symbol Changer + Moving Average (3x) + ATR + RSI + Candle Timer. This indicator allows you to create a Symbol list and change between symbols of the current chart or Timeframe by selecting the appropriate button. On Chart there are three(3) multi timeframe Moving Averages shown (selected by you), ATR Value MTF ( selected by you -  helps with setting SL and TP), RSI Value MTF (selected by you) and a Candle Timer.   Features: - Symbol Changer : Change Symbol and Timeframe of Chart.   (
FREE
Atr Grid Maker Pro
AutoTrading Factory
This Expert Advisor uses ATR as CORE indicator for GRID operative.ATR measures intrinsec volatility. Using ATR on a GRID, you will give enought space between lines considering current volatility. On this EA, you can set ATR period and timeframe parameters, and also you can set a ATR multiplier factor, to increase margin between each GRID level. In the same way, you can also configure the number of GRID levels (up and down) as well as the color of the drawn lines. In addition, it has a start/
29 USD
Currency StrengtT
Hafis Mohamed Yacine
What Is Currency StrengtT Indicator? A currency strengthT indicator is a graphical tool that shows the strength of a currency. Common indicators usually show the strength of a currency in relation to another currency, however, with some calculations it is possible to find the absolute strength of each individual currency. Therefore, a currency strength matrix indicator (or meter) is a tool that tries to express the absolute strength of a currency, so that you can compare this strength with
30 USD
Banev EA
Akram Azizi
This Expert uses multiple indicators and special algorithm to choose the entry points and provide the maximum Gain with the minimum Risk . Run the BackTest and check the efficienty of the product. Working Conditions : This EA works on all Pairs on 15M Timeframe. With 1000 $ Balance Input Parameters : Trading Mode : Choose between 3 modes. AutoManagement : The lot will increase with the increasing of the balance. Trading Lot : The Lot is set manually. Take Profit : Set it by points.
66 USD
Please contact me at telegram  https://t.me/smartforex7 After purchasing SmartForex Indicator then Use This Indicator...................... SMART EXIT PROFIT LINE Indicator is very Helpful with SmartForex Indicator ........................................ SMART EXIT PROFIT LINE Indicator Attach with SmartForex Indicator after then Red Line Show Exit buy Profit , Green Line show Exit Sell Profit................
FREE
Breakout Box
Claus Dietrich
4.38 (29)
BREAKOUT-SESSION-BOX LONDON EU US ASIA Open watch the expectation of a volatile movement above or under the opening range We take the high of the range as Entry for a long trade and SL will be the low of the range and vice versa the low of the range as Entry for a short trade and the high for SL The size of the range is the distance to the TP (Take Profit) The range of the opening hours should not be larger than about 1/3 of the average daily range 4 breakout examples are already predefined:
FREE
Remora fish
Marta Gonzalez
You know you are not a shark but maybe you can be a   remora fish. You just have to locate a shark and feed on the remains. This system uses an indicator that detects the movements of the shark and positions itself in favor of it, taking advantage of its capture. This system analyzes the market looking for the waves that the shark produces in the forex sea when it attacks the market. Once the shark attack is located, it enters the market to catch a piece of the catch. All operations have th
30 USD
The Nihilist 5.0 Indicator includes Forexalien and Nihilist Easy Trend trading strategies and systems. It is composed of an MTF Dashboard where you can analyze the different input possibilities of each strategy at a glance. It has an alert system with different types of configurable filters. You can also configure which TF you want to be notified on your Metatrader 4 platform and Mobile application The indicator has the option to view how could be a TP and SL by using ATR or fixed points, even
299 USD
Trade Stats
Johannes Schoeman
Does your trading consist of Multiple EA's, Multiple time frames an no clear indication of how each individual strategy or time frame is performing, then this indicator will help. Assign the EA Magic number to this indicator and track it's performance on the chart by selecting on chart the period, today, week, month year or all history to view. Easy visual colour changing header to display the performance of the EA for the respective periods.    Minimize the panel to reduce chart clutter. Add yo
40 USD
The Icarus Reversals(TM) Indicator is a powerful tool to identify high-probability reversal points, across all instruments.  The Reversals Indicator provides traders and investors with a simple-to-use and highly dynamic insight into points of likely price-action reversals.  Generated by a unique proprietary code-set, the Reversals Indicator generates long and short trade signals, which can be customised for all inputs, allowing for the complete optimisation fitted to any trader or investor style
89 USD
Smart Channel is a non-redrawing channel indicator based on moving averages. The indicator is used to identify trends in financial markets and indicates the direction of price movement. Smart Channel, in fact, is a miniature trading strategy, since, regardless of the construction methods, it uses the tactics of rebounding from the boundaries of the built channel, and the boundaries themselves are used as guidelines for the correct placement of stop loss and take profit orders. The key diffe
88 USD
The indicator sends messages to e-mail and mobile terminal when the price approaches the horizontal levels and trend lines that are drawn using the handy panel! The levels and trend lines are deleted and placed to the chart using one click on the panel, and they can be dragged on the chart by mouse! It is possible to set the interval between messages in the settings, the interval is applied to each object separately! Indicator Settings ===*** Main settings ***=== - below is the list of the mai
40 USD
MT5-Version Fibonacci-Bollinger-Bänder MT4 Fibonacci Bollinger Bands ist ein hochgradig anpassbarer Indikator, der Unterstützungs- und Widerstandsbereiche anzeigt. Dieser Indikator kombiniert die Logik für die Bollinger-Bänder mit dem Fibonacci-Level. Fibonacci-Bollinger-Bänder sind der     Erste   Indikator auf dem Markt, der es dem Benutzer ermöglicht, bis zu 12 Fibonacci-Levels, den Typ des gleitenden Durchschnitts und die für die Berechnungen zu verwendende Preisdatenquelle zu 100% anzupasse
129 USD
1.Determine the trend size based on the chart cycle.   An uptrend near the highest price in a period of time.   A trend down near the lowest price in a period of time. 2.   short-term trends.   Oversold and long;   Overbought, short. 3. Unwind positions based on overbought and oversold and profit points. real-time signal: https://www.mql5.com/zh/signals/1538661?source=Site+Signals+My EA Settings: You need to load EA into the currency pair to trade (M15 time range). The best performing symbol : E
399 USD
For this set of indicators 1. General information     - Calculates with high performance mathematical algorithms.     - Calculated from the price of candles     - The entry point of this order is filtered by the train EMA and the oscillator.     - Calculate the integrity of the candle 2. How does it work?     - You can see two types of order entry points: the notification on the monitor and the arrow.     - You can trust 75-95 percent of this entry point. 3. Settings     - A complete candle
99 USD
HeikenashiSmoothing
Rodolfo Leonardo De Morais
Heiken ashi Smoothing in separate window MTF The color of the Heiken-Ashi candles depend on their shadows. The advantage of the Heiken-Ashi chart is that the trend is determined very simply, the upward-facing sails are blue, and the downward-tendency sails are red. For profitable trading it is necessary to use it with the standard candles (make analyzes) and with the other indicators. Indicator Parameters TimeFrame - Graphic time being 0 = Current graph time, 1 = M1, 5 = M5, 15 = M15, 30 = M30
30 USD
Grid MATR
Abraham Correa
X-axis lines prevail in grid manner, ruled by Average True Range. There’s an evitable change in specific periods of time! MATR means “multiplying average true range” in order to find the boundaries of the Grid expansion. It’ll stretch, shrink, and evolve with 4 timely choices of grid states! This origin code recognizes the participation on a chart, noticing the development in volume! Matter a fact, strategy testing this indicator would allow you to review the history of the price pathing way w
50 USD
TrendSys
Maryna Shulzhenko
Trend Sys, an indicator designed to detect trends in price movement and allows you to quickly determine the direction of the trend. The best way to trade Trend Sys is to enter the market when Trend Sys peaks and goes the other way. This is a sign of a trend reversal. I hope you enjoy this indicator and leave your comments to make it even better. Good luck and happy trading.
56 USD
Top Gun
Lucky Susandji
PART #3 : TOOLS TREND MA  The tool makes it easy to get the fastest information about the movement of the pair and a measure of the strength of the momentum that is causing the trend [UPTREND | DOWNTREND]. Also when an asset is overbought or oversold that causes a reversal. Serves to provide active signals that provide recommendations for the momentum of a trend that is predicted through directional arrows. Settings adapt to individual observations & choices. Its creation is specialized
68 USD
RBCI hist
Sergey Zhukov
The RBCI hist indicator is an adaptive trend histogram, that eliminates noise using a Low-pass filter, which passes the lower frequencies and cuts off hight frequencies of the price fluctuations. The signal (depending on the strategy chosen by trader) is the intersection of the zero line by the indicator, as well as the change in the histogram color. The change in the histogram color serves as an early signal for opening positions towards the trend. The position of the indicator relative to the
30 USD
Strong Retracement Points Pro demo edition! SRP (Strong Retracement/Reversal Points) is a powerful and unique support and resistance indicator. It displays the closest important levels which we expect the price retracement/reversal! If all level are broken from one side, it recalculates and draws new support and resistance levels, so the levels might be valid for several days depending on the market! If you are still hesitating to start using this wonderful tool, you can check this link to see h
100 USD
ON THIS LINK YOU CAN FIND NEW VERSION  https://www.mql5.com/en/market/product/53022 https://www.mql5.com/en/market/product/53022 /-/-/-/-/-   /-/-/-/-/-   /-/-/-/-/-   /-/-/-/-/-   /-/-/-/-/-   /-/-/-/-/-   /-/-/-/-/-   /-/-/-/-/-   /-/-/-/-/-   /-/-/-/-/-   /-/-/-/-/-   /-/-/-/-/-   /-/-/-/-/-   /-/-/-/-/- /-/-/-/-/-   /-/-/-/-/-   /-/-/-/-/-   /-/-/-/-/-   /-/-/-/-/-   /-/-/-/-/-   /-/-/-/-/-   /-/-/-/-/-   /-/-/-/-/-   /-/-/-/-/-   /-/-/-/-/-   /-/-/-/-/-   /-/-/-/-/-   /-/-/-/-/- /-/-/-
FREE
Käufer dieses Produkts erwarben auch
RelicusRoad Pro
Relicus LLC
4.94 (87)
JETZT 147 $ (602 $ RABATT) - UNBEGRENZTE KONTEN - PREISERHÖHUNGEN BEIM NÄCHSTEN UPDATE - VERGESSEN SIE NICHT, EINE 5-STERNE-BEWERTUNG ZU VERLASSEN RelicusRoad Benutzerhandbuch + Schulungsvideos + Zugang zur privaten Discord-Gruppe + VIP-Status EINE NEUE ART, DEN MARKT ZU BETRACHTEN RelicusRoad ist der weltweit leistungsstärkste Handelsindikator für Forex, Futures, Kryptowährungen, Aktien und Indizes und gibt Händlern alle Informationen und Tools, die sie benötigen, um profitabel zu bleib
147 USD
Advanced Supply Demand
Bernhard Schweigert
4.94 (285)
Derzeit 33% Rabatt! Die beste Lösung für jeden Anfänger oder erfahrenen Händler! Dieser Indikator ist ein einzigartiges, qualitativ hochwertiges und erschwingliches Trading-Tool, da wir eine Reihe von proprietären Funktionen und eine neue Formel integriert haben. Mit diesem Update werden Sie in der Lage sein, doppelte Zeitrahmenzonen anzuzeigen. Sie können nicht nur einen höheren TF (Zeitrahmen) anzeigen, sondern sowohl den Chart-TF als auch den höheren TF: SHOWING NESTED ZONES. Alle Supply Dema
148 USD
Gold Stuff
Vasiliy Strukov
4.89 (147)
Gold Stuff-Ein Trendindikator, der speziell für Gold entwickelt wurde, kann auch auf allen Finanzinstrumenten verwendet werden. Der Indikator wird nicht neu gezeichnet und verzögert sich nicht. Empfohlener Zeitrahmen H1. Nach diesem Indikator geschrieben EA Gold Stuff Berater, können Sie es in meinem Profil finden. WICHTIG! Kontaktieren Sie mich sofort nach dem Kauf, um Anweisungen und Bonus zu erhalten! DATEN Draw Arrow - inkl.aus. zeichnen von Pfeilen in einem Diagramm. Alerts-inkl.aus.
50 USD
DERZEIT 26% RABATT Die beste Lösung für jeden Newbie oder Expert Trader! Dieser Indikator ist ein einzigartiges, qualitativ hochwertiges und erschwingliches Trading-Tool, da wir eine Reihe von proprietären Funktionen und eine neue Formel integriert haben. Mit nur EINEM Chart können Sie die Währungsstärke für 28 Forex-Paare ablesen! Stellen Sie sich vor, wie sich Ihr Handel verbessern wird, weil Sie in der Lage sind, den genauen Auslösungspunkt eines neuen Trends oder einer Scalping-Gelegenh
148 USD
Ultimate Sniper Dashboard
Hispraise Chinedum Abraham
4.78 (18)
Ermäßigt auf $299! Die Preise können in Zukunft steigen! Lesen Sie die Beschreibung unten! Bestes Einstiegssystem für Ultimate Sniper Dashboard: ULTIMATIVE DYNAMISCHE EBENEN. (Bitte überprüfen Sie meine Produkte) Das Ultimate Sniper Dashboard funktioniert NUR auf Live-Märkten aufgrund der MT4 Multicurrency Testlimits. Wir stellen Ihnen das Ultimate-Sniper Dashboard vor! Unser bestes, das sowohl HA-Sniper, MA-Sniper und viele spezielle Modi enthält. Das Ultimate Sniper Dashboard ist ein
299 USD
A top and bottom indicator that can intuitively identify the trend of the band. It is the best choice for manual trading, without redrawing or drifting. How to get this indicator for free: Learn more For any novice and programming trading friend, you can write the signal into the EA to play freely. Array 3 and array 4, for example, 3>4 turns green, 3<4 turns red. If you don't understand, please contact me. Original price of USD 198 ( current price of USD 69 ) - Next update price increase- unlimi
69 USD
Italo Volume Indicator
Italo Santana Gomes
4.96 (69)
BUY INDICATOR AND GET EA FOR FREE AS A BONUS + SOME OTHER GIFTS! ITALO VOLUME INDICATOR  is the best volume indicator ever created, and why is that? The Indicator works on all time-frames and assets, indicator built after 6 years of experience on forex and many other markets. You know many volume indicators around the internet are not complete, does not help, and it's difficult to trade, but the Italo Volume Indicator is different , the Italo Volume Indicator shows the wave volume, when market
65 USD
Scalper Vault
Oleg Rodin
5 (11)
Scalper Vault ist ein professionelles Scalping-System, das Ihnen alles bietet, was Sie für erfolgreiches Scalping benötigen. Dieser Indikator ist ein komplettes Handelssystem, das von Forex- und Binäroptionshändlern verwendet werden kann. Der empfohlene Zeitrahmen ist M5. Das System liefert Ihnen genaue Pfeilsignale in Richtung des Trends. Es liefert Ihnen auch Top- und Bottom-Signale und Gann-Marktniveaus. Die Indikatoren bieten alle Arten von Warnungen, einschließlich PUSH-Benachrichtigungen.
65 USD
Owl smart levels
Sergey Ermolov
5 (7)
Indikator-Leitfaden  |  Owl Smart Levels-Strategie  |   MT5-Version  |  Wie installiert man?   |   FAQ Der   Owl Smart Levels Indikator   ist ein komplettes Handelssystem innerhalb eines Indikators, der so beliebte Marktanalysetools wie die   fortschrittlichen Fraktale von Bill Williams , Valable ZigZag, das die   richtige Wellenstruktur   des Marktes aufbaut, und   Fibonacci-Levels , die die genauen Einstiegslevels markieren, enthält in den Markt und Orte, um Gewinne mitzunehmen. Eine detailli
97 USD
Entry Points Pro
Yury Orlov
4.72 (214)
Dies ist ein Indikator für MT4, der genaue Signale für den Einstieg in einen Handel ohne Repainting (Neuzeichnen) liefert. Er kann auf alle Finanzwerte angewendet werden: Forex, Kryptowährungen, Metalle, Aktien, Indizes. Er liefert ziemlich genaue Schätzungen und sagt Ihnen, wann es am besten ist, eine Position zu eröffnen und zu schließen. Sehen Sie sich das Video (6:22) mit einem Beispiel für die Verarbeitung nur eines Signals an, das sich für den Indikator gelohnt hat! Die meisten Händler ver
125 USD
Ultimate Dynamic Levels
Hispraise Chinedum Abraham
4.86 (7)
Derzeit auf Urlaub Rabatt bei $ 399! Die Preise können in Zukunft steigen. Lesen Sie die Beschreibung unten!  Einführung von Ultimate Dynamic Levels - der BESTE Einstiegsindikator für das Ultimate Sniper Dashboard! Extrem risikoarme, rechtzeitige Einstiege und hohe RR!! Finden Sie das Ultimate Sniper Dashboard HIER. Die wichtigste Fähigkeit sowohl für Anfänger als auch für Profis ist es, genau zu erkennen, wo und wann ein Markt am wahrscheinlichsten dreht, und wie man sicher einsteigt und mi
199 USD
Werden Sie Breaker Trader und profitieren Sie von Änderungen der Marktstruktur, wenn sich der Preis umkehrt. Der Order Block Breaker Indikator zeigt an, wann sich eine Trend- oder Preisbewegung der Erschöpfung nähert und bereit ist, sich umzukehren. Es weist Sie auf Änderungen in der Marktstruktur hin, die normalerweise auftreten, wenn eine Umkehrung oder ein größerer Rückzug bevorsteht. Der Indikator verwendet eine proprietäre Berechnung, die Ausbrüche und Preisdynamik identifiziert. Jedes
49 USD
ICT, SMC, SMART MONEY CONCEPTS, SMART MONEY, Smart Money Concept, Support and Resistance, Trend Analysis, Price Action, Market Structure, Order Blocks, BOS/CHoCH,   Momentum Shift, HH/LL/HL/LH,    Fair Value Gap, FVG,  Premium  &   Discount   Zones, Fibonacci Retracement, OTE, Buy Side Liquidity, Sell Side Liquidity, BSL/SSL Taken, Equal Highs & Lows, MTF, Multiple Time Frame, BigBar, HTF OB, HTF Market Structure,  Liquidity Voids, Long Wicks, Candle Timer, Fractals, ZigZag, Time Zone, Market Se
63 USD
Derzeit 20% Rabatt! Die beste Lösung für jeden Neueinsteiger oder Expert Händler! Dieses Dashboard arbeitet mit 28 Währungspaaren. Es basiert auf 2 unserer Hauptindikatoren (Advanced Currency Strength 28 und Advanced Currency Impulse). Es bietet einen hervorragenden Überblick über den gesamten Forex-Markt. Es zeigt die Werte der Advanced Currency Strength, die Veränderungsrate der Währungen und die Signale für 28 Devisenpaare in allen (9) Zeitrahmen. Stellen Sie sich vor, wie sich Ihr Hande
199 USD
DERZEIT 31% RABATT! Die beste Lösung für jeden Newbie oder Expert Trader! Dieser Indikator ist ein einzigartiges, qualitativ hochwertiges und erschwingliches Handelsinstrument, da wir eine Reihe von proprietären Funktionen und eine geheime Formel eingebaut haben. Mit nur EINEM Chart liefert er Alerts für alle 28 Währungspaare. Stellen Sie sich vor, wie sich Ihr Handel verbessern wird, weil Sie in der Lage sind, den genauen Auslösepunkt eines neuen Trends oder einer Scalping-Gelegenheit zu e
88 USD
Dieser Indikator ist eine hervorragende Kombination aus unseren 2 Produkten Advanced Currency IMPULSE with ALERT  +   Currency Strength Exotics . Es funktioniert für alle Zeitrahmen und zeigt grafisch Impulse der Stärke oder Schwäche für die 8 wichtigsten Währungen plus ein Symbol! Dieser Indikator ist darauf spezialisiert, die Beschleunigung der Währungsstärke für beliebige Symbole wie Gold, Exotische Paare, Rohstoffe, Indizes oder Futures anzuzeigen. Als erster seiner Art kann jedes Sym
149 USD
PRO Renko System ist ein hochpräzises Handelssystem, das speziell für den Handel mit RENKO-Charts entwickelt wurde. Dies ist ein universelles System, das auf verschiedene Handelsinstrumente angewendet werden kann. Das System neutralisiert effektiv so genannte Marktgeräusche, die Ihnen Zugang zu genauen Umkehrsignalen geben. Der Indikator ist sehr einfach zu bedienen und hat nur einen Parameter, der für die Signalerzeugung verantwortlich ist. Sie können das Tool einfach an jedes Handelsinstr
75 USD
Italo Trend Indicator
Italo Santana Gomes
4.75 (28)
BUY INDICATOR AND GET EA FOR FREE AS A BONUS + SOME OTHER GIFTS! ITALO TREND INDICATOR  is the best trend indicator on the market, the Indicator works on all time-frames and assets, indicator built after 6 years of experience on forex and many other markets. You know many trend indicators around the internet are not complete, does not help, and it's difficult to trade, but the Italo Trend Indicator is different , the Italo Trend Indicator shows the signal to buy or sell, to confirm the signal t
65 USD
Trend Screener
STE S.S.COMPANY
4.75 (57)
Trendindikator, bahnbrechende, einzigartige Lösung für Trendhandel und -filterung mit allen wichtigen Trendfunktionen in einem Tool! Es handelt sich um einen 100 % nicht neu zu malenden Multi-Timeframe- und Multi-Währungs-Indikator, der für alle Symbole/Instrumente verwendet werden kann: Forex, Rohstoffe, Kryptowährungen, Indizes und Aktien. Trend Screener ist ein effizienter Trendfolgeindikator, der Pfeiltrendsignale mit Punkten im Diagramm liefert. Die Funktionen, die im Trendanalysator-Indika
50 USD
Cycle Sniper
Elmira Memish
4.6 (30)
NEW YEAR SALE PRICE FOR LIMITED TIME!!! Please contact us after your purchase and we will send you the complimentary indicators to complete the system. Cycle Sniper is not a holy grail but when you use it in a system which is explained in the videos, you will feel the difference. If you are not willing to focus on the charts designed with Cycle Sniper and other free tools we provide, we recommend not buying this indicator. We recommend watching the videos about the indiactor and system before
200 USD
Supply and Demand Dashboard PRO
Bernhard Schweigert
4.79 (19)
Derzeit 20% reduziert! Dieses Dashboard ist eine sehr leistungsfähige Software, die mit mehreren Symbolen und bis zu 9 Zeitrahmen arbeitet. Es basiert auf unserem Hauptindikator (Beste Bewertungen: Advanced Supply Demand ).   Das Dashboard gibt einen guten Überblick. Es zeigt: Gefilterte Angebots- und Nachfragewerte einschließlich der Zonenstärkebewertung, Pips-Abstände zu/und innerhalb von Zonen, Es hebt verschachtelte Zonen hervor, Es gibt 4 Arten von Alarmen für die gewählten Symbole in
199 USD
AW Trend Predictor
Alexander Nechaev
4.82 (28)
Die Kombination von Trend- und Aufschlüsselungsebenen in einem System. Ein fortschrittlicher Indikatoralgorithmus filtert Marktrauschen, bestimmt den Trend, Einstiegspunkte sowie mögliche Ausstiegsniveaus. Indikatorsignale werden in einem Statistikmodul aufgezeichnet, das es Ihnen ermöglicht, die am besten geeigneten Tools auszuwählen, die die Wirksamkeit der Signalhistorie zeigen. Der Indikator berechnet Take-Profit- und Stop-Loss-Marken. Handbuch und Anleitung ->   Hier   / MT5-Version ->   H
55 USD
Trend Scanner GS
Vasiliy Strukov
5 (15)
Trend Scanner scannt Markttrends aus Multi-Symbolen und Multi-Time-Frames und zeigt sie auf einem beweglichen Panel auf dem Chart an, den er zur Analyse verwendet. Der Händler kann mehrere Paare seiner Wahl zur Anzeige auswählen. Trend Scanner ist ein großartiges Tool, um die Richtung des Trends zu sehen, und kann für den manuellen Handel oder den EA-Handel verwendet werden, indem nur Kauf- oder Verkaufsaufträge gemäß dem Trend zugelassen werden. Echtzeit-Ergebnisse können hier eingesehen wer
50 USD
Currency Strength Exotics
Bernhard Schweigert
5 (23)
Stärke von 8 Währungen plus EIN EXOTISCHES Paar oder Rohstoffe oder Indexe! Jedes Produkt kann als 9. Linie hinzugefügt werden. Fügen Sie Rohstoffe, Indexes oder exotische Währungen hinzu (Gold, Silber, Öl, DAX, US30, MXN, TRY, CNH ...). Eine neue noch nie dagewesene TRADING STRATEGIE  !!! Dieser Indikator ist einzigartig, weil wir eine Reihe von proprietäre Funktionen und neue Formeln eingebaut haben. Es funktioniert für alle Zeitrahmen. Basierend auf neuen zugrunde liegenden Algorithmen ist
128 USD
Please send me Direct message on MQL5 CHAT after purchasing the Indicator for Training and Installation Support There are some additional files that is important to use with the Indicator . So be sure to contact me after purchasing the Indicator So that I can add you for training and support . If you find any difficulty with installation then send me Direct message here So that I can connect with you via Anydesk or Teamview for the product installation. " Smart Order Block Indicator " to find
249 USD
M1 Arrow
Oleg Rodin
5 (6)
Eine Intraday-Strategie, die auf zwei Grundprinzipien des Marktes basiert. Der Algorithmus basiert auf der Analyse von Volumina und Preiswellen mit zusätzlichen Filtern. Der intelligente Algorithmus des Indikators gibt nur dann ein Signal, wenn sich zwei Marktfaktoren zu einem vereinen. Der Indikator berechnet Wellen eines bestimmten Bereichs auf dem M1-Diagramm unter Verwendung der Daten des höheren Zeitrahmens. Und um die Welle zu bestätigen, verwendet der Indikator eine Volumenanalyse. Dieser
65 USD
Forex Master Pattern MT4
Alberto Gauer Borrego
4.62 (13)
The Forex Master Pattern  is an alternative form of technical analysis that provides a framework which will help you to find and follow the hidden price pattern that reveals the true intentions of financial markets. This algorithm here does a good job detecting the Phase 1 of the Forex Master Pattern cycle, which is the contraction point (or Value).  On Phase 2 we get higher timeframe activation (also called Expansion), which is where price oscillates above and below the average price defined
49 USD
Strong Support
Vasiliy Strukov
5 (14)
Unterstützungs- und Widerstandsniveaus sind seit der Antike ein mächtiges Werkzeug für die Marktanalyse. Strong Support Der Indikator baut Unterstützungsniveaus auf lokalen Preistiefs und Widerstandsniveaus auf lokalen Preishochs auf.  Meine anderen Entwicklungen finden Sie hier Es wird empfohlen, in Verbindung mit einem Trendindikator wie Gold Stuff zu verwenden, um den Trend zu handeln und gleichzeitig Konsolidierungs- oder Umkehrzonen zu definieren sowie Stop-Loss und Take-Profit auf Unt
50 USD
Dieses Dashboard ist ein Warntool zur Verwendung mit dem Indikator für die Umkehrung der Marktstruktur. Sein Hauptzweck besteht darin, Sie auf Umkehrmöglichkeiten in bestimmten Zeitrahmen und auch auf die erneuten Tests der Warnungen (Bestätigung) aufmerksam zu machen, wie es der Indikator tut. Das Dashboard ist so konzipiert, dass es auf einem eigenen Chart sitzt und im Hintergrund arbeitet, um Ihnen Benachrichtigungen zu Ihren ausgewählten Paaren und Zeitrahmen zu senden. Es wurde entwickelt,
49 USD
Cycle Finder Pro
Raymond Gilmour
5 (8)
Update - Version 4.0 now includes trend change signal. Indicator will tell you the current trend on all charts. Cycle Finder Pro is a chart reading indicator and is designed for trend and pattern traders . Chart reading is time consuming and complex and requires knowledge of price action , cyclicity,  and time frame correlation . Cycle Finder Pro reads all this in one simple indicator so you can spot trend and chart patterns much easier and much faster.  To know if a trend exists on a chart you
48 USD
Weitere Produkte dieses Autors
Der R Wolfe Wave-Indikator analysiert die Preisbewegung und wandelt die gesammelten Daten in ein leistungsstarkes technisches Werkzeug für Wolfe Wave-Chartmuster um. Im Wesentlichen kann das R-Wolfe-Wellen-Chartmuster entweder zinsbullisch oder bärisch sein und Händlern helfen, Kauf- und Verkaufsgeschäfte ohne nachlaufende Indikatoren zu eröffnen. Wichtige Punkte Identifiziert starke Wolfe Wave-Muster Für fortgeschrittene Trader Funktioniert für jedes Währungspaar Es lohnt sich, Ihre Indikato
FREE
R 2EMA Color
Rwy Ksyby
5 (2)
Der R 2EMA Color Indikator für MT4 liefert solide Handelssignale basierend auf dem Crossover von 2 EMAs. Wichtige Punkte Wenn der Preis die beiden grünen EMAs kreuzt und über ihnen schließt, erzeugt dies ein Kaufhandelssignal. Wenn der Preis die beiden roten EMAs kreuzt und über ihnen schließt, entsteht ein Verkaufssignal. Der R 2EMA Color Forex Indikator macht es noch einfacher festzustellen, wann es Zeit zum Kaufen und Verkaufen ist Ein Kaufsignal tritt auf, wenn die 2 EMA-Linien grün wer
FREE
Der R Silver Trend Indikator ist ein trendfolgender Handelsindikator, der den aktuellen Trend direkt auf dem Aktivitätsdiagramm von Metatrader 4 anzeigt. Es zeichnet zwei Arten von Kerzen: Blau steht für bullische Kursbewegungen. Rot für rückläufige Preisbewegung. Der Handel mit dem R Silver Trend Indikator ist selbst für absolute Anfänger recht einfach und kann für Scalping (M1, M5), Daytrading (M5, M15, M30) und Swingtrading (H1, H4, D1) Währungen verwendet werden. Grundlegende Handelss
FREE
Der R Wavy Dash Indikator verwandelt Preisdaten in einen hervorragenden Trendfolgesignalindikator, der für den Einstieg und Ausstieg aus dem Handel funktioniert. Es erscheint im Hauptdiagramm als farbige Signallinie und kann als eigenständiges Handelstool verwendet werden. Der R Wavy Dash Indikator ist sehr zuverlässig, leicht und wird Ihre Handelsplattform nicht verlangsamen. Wichtige Punkte Trendsignalanzeige Anfängerfreundlich Nicht neu lackieren Es lohnt sich, Ihre Indikatorsammlung zu
FREE
Der R Show Ticks-Indikator für Metatrader 4 zeigt die Aufwärts-/Abwärts-Ticks in Echtzeit im Haupthandelsfenster. Die zentralen Thesen Ein weißer Pfeil ist ein Aufwärtstrend. Ein roter Pfeil ist ein Abwärtsstrich. Der Indikator funktioniert für jedes Währungspaar und jeden Zeitrahmen Ihrer Wahl. Indikatorspezifikationen Handelsplattform: Entwickelt für Metatrader 4 (MT4) Währungspaare: Funktioniert für jedes Paar Zeitrahmen: Funktioniert für jeden Zeitrahmen Eingabeparameter: Eingabes
FREE
Der R Alligator Indikator wurde von Bill Williams eingeführt, er folgt dem Trend mit Hilfe von 3 geglätteten gleitenden Durchschnitten. Standardmäßig werden die folgenden Werte verwendet: Der geglättete gleitende Durchschnitt über 13 Perioden (bekannt als Jaw) Der geglättete gleitende Durchschnitt über 8 Perioden (bekannt als die Zähne) Der geglättete gleitende Durchschnitt über 5 Perioden (bekannt als Lips) Der R Alligator Indikator reduziert die Anzahl der falschen Trend Trades durch die
FREE
Der R Scalper Arrows Indikator bietet leicht lesbare Kauf- und Verkaufssignalpfeile für Währungspaare. Gut für die Vorhersage kurzfristiger Trends. Ein Aufwärtspfeil zeigt an, dass sich das Paar in einem kurzfristigen Aufwärtstrend befindet. Ein Abwärtspfeil zeigt an, dass sich das Paar in einem kurzfristigen Abwärtstrend befindet. Platzieren Sie für Long-Trades Ihren Stop-Loss unter Pips. Legen Sie für Short-Trades Ihren Stop-Loss über Pips fest. Ich gehe zusammen Dieser Indikator kann m
30 USD
R Chimp Scalper ist ein hervorragendes Trading-Tool für Forex-Spekulanten und Daytrader. Die Signale dieses Scalping-Indikators sind sehr klar und gut ablesbar. Zeichnen Sie in separaten Handelsfenstern grüne und rote Balken über und unter dem Nullniveau: Die grünen Balken reihen sich über dem Nullniveau auf, was auf einen bullischen Spekulationstrend hinweist. Die roten Balken reihen sich unterhalb von Null auf, was auf einen Scalping-Abwärtstrend hinweist. Indikatorwerte über dem Nullnive
30 USD
Der R 3MA Cross-Indikator ist ein beliebter Trendindikator mit Warnungen, die auf dem Crossover von 3 gleitenden Durchschnitten basieren. Er besteht aus einem schnelleren, mittleren und langsameren gleitenden Durchschnitt. Wichtige Punkte Ein Kaufalarm wird ausgelöst, wenn der schneller gleitende Durchschnitt sowohl den mittleren als auch den langsameren gleitenden Durchschnitt nach oben kreuzt. Ein Verkaufsalarm wird ausgelöst, wenn der schneller gleitende Durchschnitt sowohl den mittleren
30 USD
Dieser Indikator verwendet mehrere Indikatoren, um hochgewinnende Signaltrades zu generieren Der R-Signals-Indikator ist ein komplettes FX-Handelssystem, das genaue Kauf- und Verkaufspfeile auf dem Chart druckt. Der Indikator erscheint im Hauptfenster des MT4-Charts als farbige grüne und rote Pfeile. Die Verwendung von Signalen, die von einem einzelnen Indikator generiert werden, kann beim Handel riskant sein. Dies liegt daran, dass die Verwendung von nur einem Indikator für den Handel mehr
40 USD
Der Indikator R Stoploss Signals basiert auf einem Trend, der einem exponentiell gleitenden Durchschnitt folgt. Dieser Forex-Indikator generiert Kauf- und Verkaufssignale in Form von blauen und roten Linien, die auf dem Aktivitätsdiagramm gezeichnet werden. Blaue Linien zeigen an, dass der Trend nach oben geht, und dies ist ein Signal, das Währungspaar zu kaufen. Rot gefärbte Linien zeigen an, dass der Trend abwärts geht, und dies ist ein Signal, das Währungspaar zu verkaufen. Dieser Forex-
30 USD
Der R Inside Bar Indikator für Metatrader 4 bietet einfach zu verwendende Preisausbruchsniveaus basierend auf Inside Bars. Es funktioniert mit reiner Preisaktion und wird überhaupt nicht neu gezeichnet und erscheint im Hauptfenster des MT4-Charts in Form von zwei farbigen horizontalen Linien über und unter der eigentlichen inneren Leiste. Die grüne horizontale Linie fungiert als Widerstand und die rote Linie als Unterstützung. Long- und Short-Trade-Idee Eröffnen Sie eine Kauforder, wenn d
30 USD
Der R Delta RSI-Indikator zeichnet ein farbiges Kauf- und Verkaufshistogramm basierend auf dem Crossover eines schnellen RSI (Periode 14) und eines langsamen RSI (Periode 50) zusammen mit einem Signalpegel. Ein rot gefärbtes Histogramm zeigt an, dass der Trend bullisch ist (Kaufsignal). Ein grün gefärbtes Histogramm zeigt an, dass der Trend rückläufig ist (Verkaufssignal). Ein graues Histogramm zeigt an, dass der Trend flach oder bereichsgebunden ist (kein Signal). Dieser Forex-Indikator ka
30 USD
Der Forex-Indikator R Ease Of Movement Metatrader 4 ist ein blauer EMZ-Handelsoszillator. Es ist ein Forex-Indikator vom Oszillatortyp, der einen bullischen und bärischen Handelsbereich erzeugt. Werte über dem Nullniveau werden als bullish bezeichnet, während Werte unter dem Nullniveau als bearish bezeichnet werden. Der R Ease Of Movement-Oszillator liefert allein keine guten Ergebnisse, er muss in Verbindung mit einem trendfolgenden technischen Indikator gehandelt werden. Gute Forex-Trendind
30 USD
Auswahl:
Keine Bewertungen
Antwort auf eine Rezension