Trend Reversal Scanner MT5
- Indikatoren
- Reza Aghajanpour
- Version: 1.5
- Aktualisiert: 15 April 2024
- Aktivierungen: 20
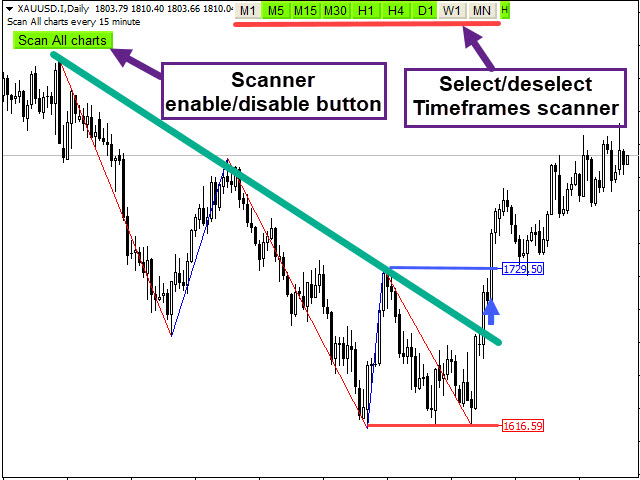
** All Symbols x All Timeframes scan just by pressing scanner button **
Introduction:
Trendlines are the most famous technical analysis in trading. Trendlines continually form on the charts of markets across all the different timeframes providing huge opportunities for traders to jump in and profit on the action. In the other hand, The trendline reversal strategy has high win rate on the price action in the market that let You catch the big fish at the edge of the waterfall.
The Trend Reversal indicator Scans All charts just by pressing one click. It has stop loss and entry point levels with using Fibonacci levels and candlestick checking to find the best entry point of trading. It finds signals immediately with alarm and notification for easy trading.It is included powerful Three Drives or 5W pattern based on RTM concepts.
Main Features:
- Detect the best and most common successful point of reversal trend
- Easy-to-use and user-friendly indicator
- NO repaint
- Scan All charts button ( Forex, Crypto, Indices and commodities )
- Select and deselect time frames button for scan (M1,M5,M15,M30,H1,H4,D1,W1,MN)
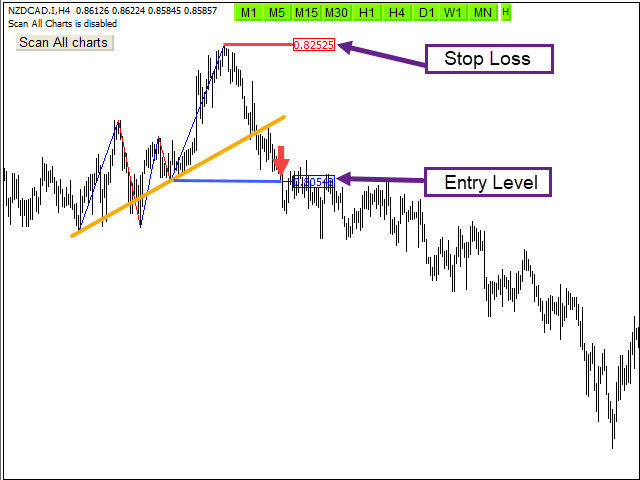
- It displays and pushes notification stop-loss, entry-point levels
- Candlestick check for the best entry point
- Use Fibonacci levels
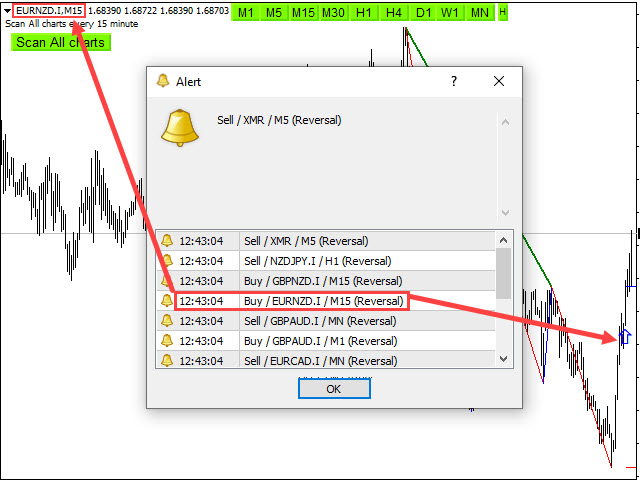
- Sending the alert and push notification
- Alert enable/disable base on your setting time
- Adjust the pattern setting
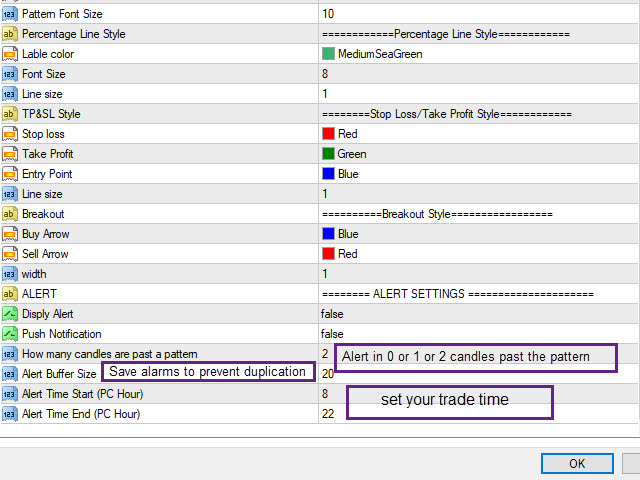
Input Parameters :
=========Scanner============
- Scan All Charts – Enable
- Scan the number of candles – Amount of history bars to evaluate
- Re-scan Timer – Re-scan all charts in all time frames after passing time
- Display Options – Display or do not SL & Entry levels
- Stop Loss levels and Breakout Style - Set the Fonts and colors of patterns
========ALERT SETTINGS ==========
- Display Alert or Push Notification – Enable or disable Alert or Push Notification
- How many candles are past a pattern – Maximum Number of candles Passed from a pattern to allow alert
- Alert Buffer Size – Maximum save alert to prevent duplicate alerts
- Alert start/end time – Determine trading hours based on the computer clock to activate and deactivate the alarm


This is a hidden gem. I came across this indicator after using Reza's "The 123 Pattern Scanner" which is nicely priced with many users and good reviews. I liked what I saw there and thought the Trend Reversal indicator might be an interesting addition to my trading environment. Not many reviews or comments at the time. I took the punt. Although having only used the Trend Reversal indicator for a short period, I'm pretty impressed. In the 9 hours since the beginning of trade today, 23 Feb 2024, the indicator made five calls on GBPUSD M1 with an 80% success rate where success is having the opportunity to quickly eliminate risk at breakeven then having the opportunity to take profits, of course depending on one's exit strategy. On another note, I wanted a shorter notification string for the 123 indicator to reduce information overflow. Reza liked that suggestion and provided a new option that day. That's what I called a great service!