• Übersicht
  • Bewertungen (5)
  • Diskussion
  • Neue Funktionen

Gartley Hunter Multi

5

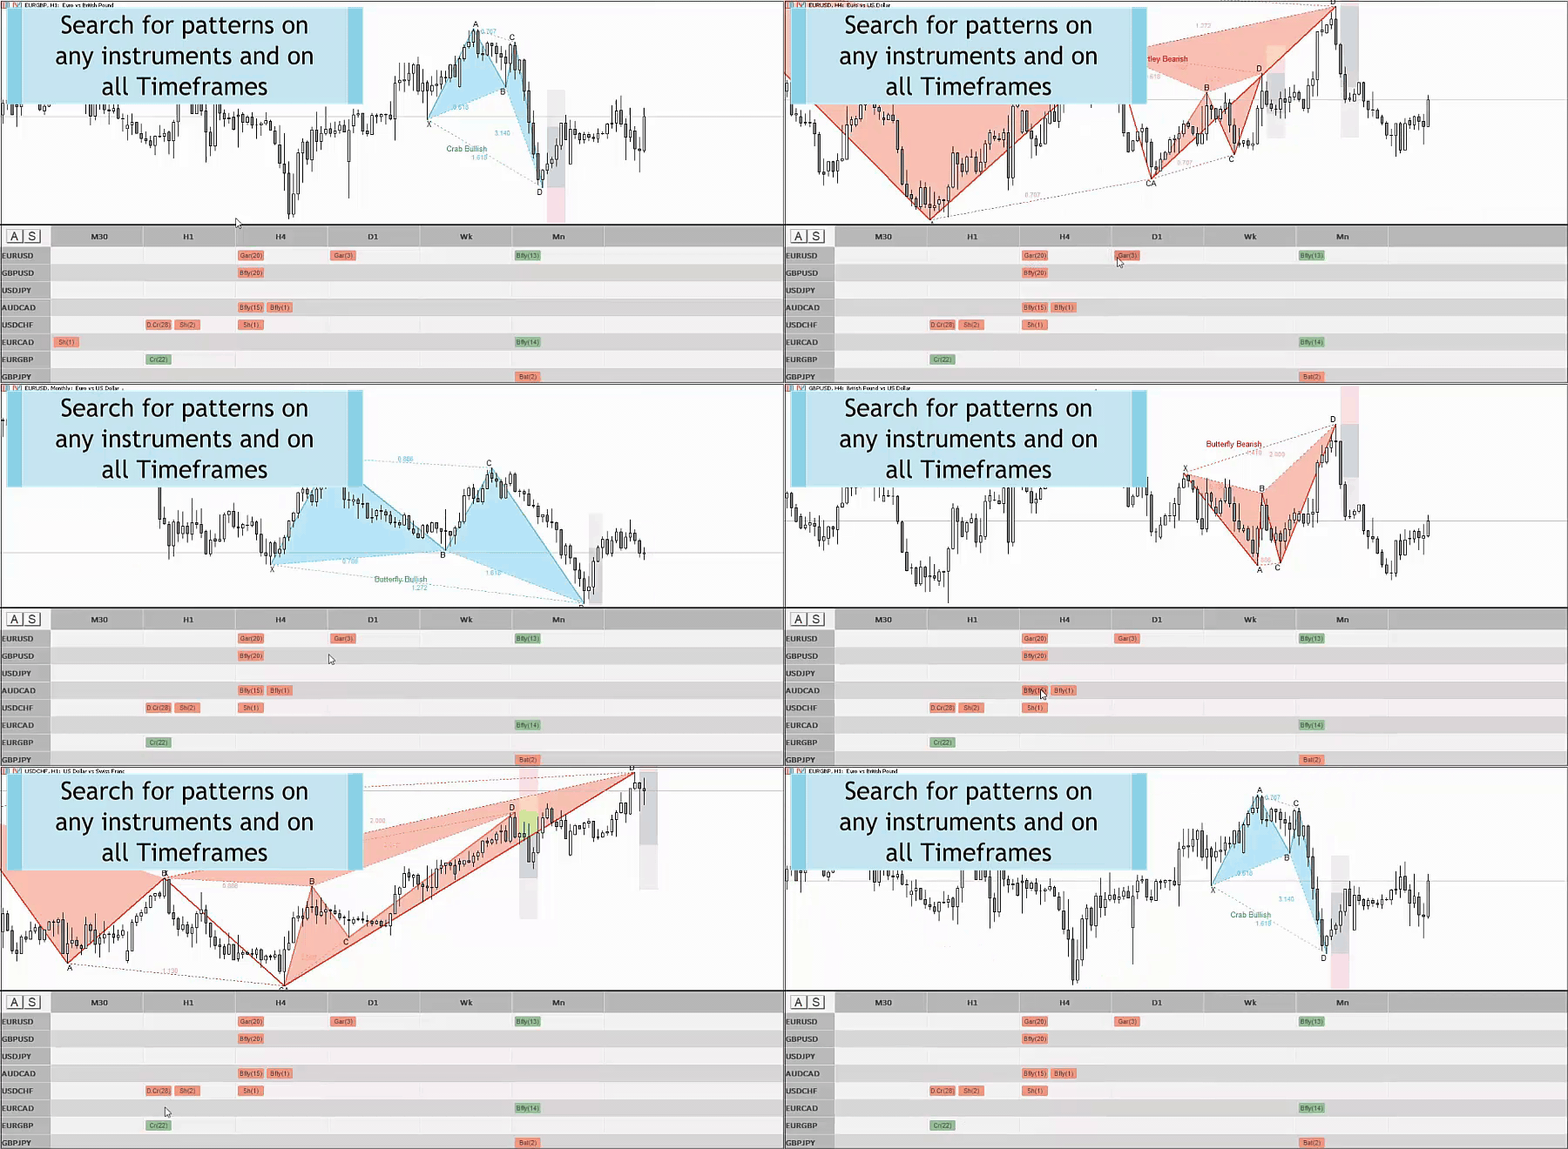
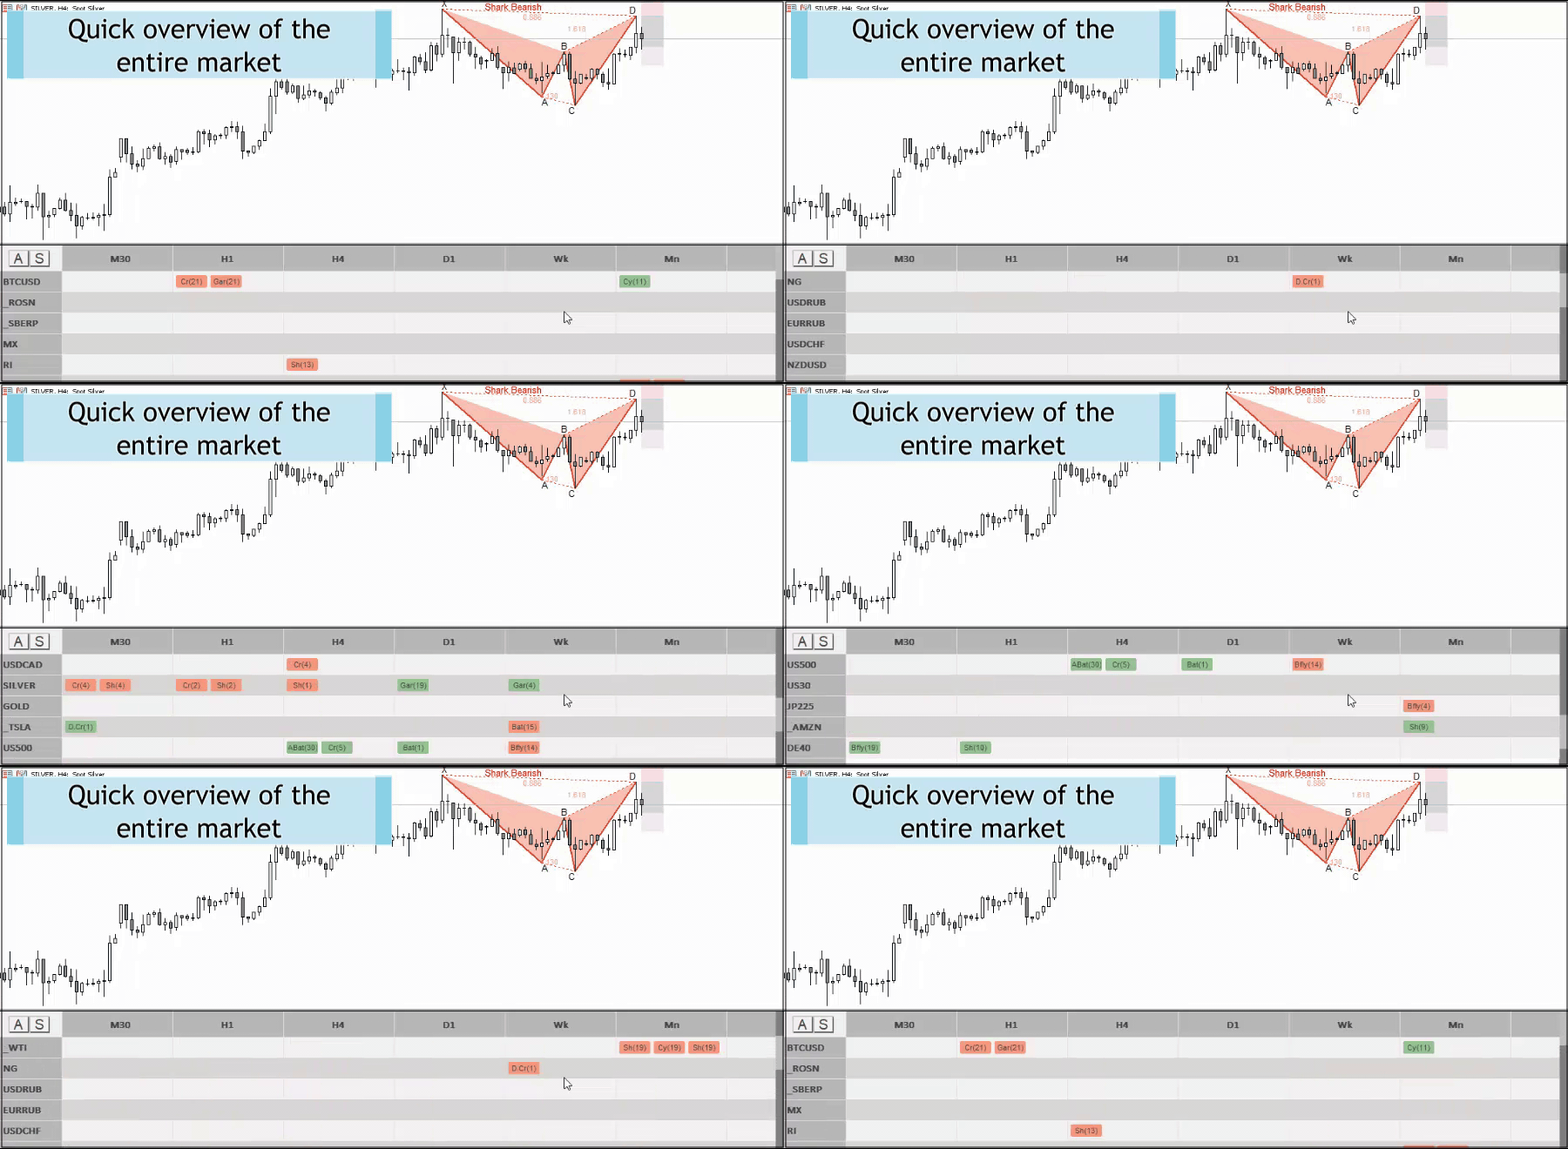
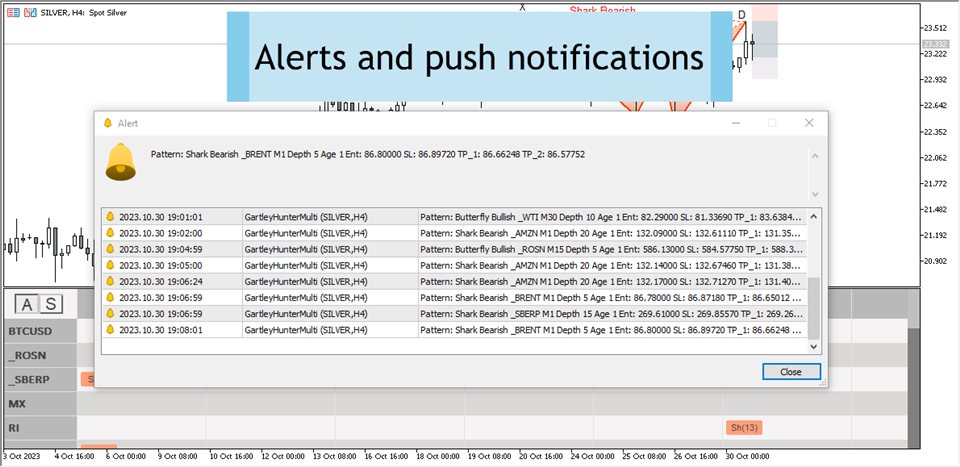
The Gartley Hunter Multi indicator is designed to search for Gartley patterns on a very large number of currency pairs (maximum 60) and on all standard time frames (m1, m5, m15, m30, H1, H4, D1, Wk, Mn) at the same time. The search is carried out automatically. After finding the pattern, the indicator will send an Alert or notification to the mobile phone.

List of patterns

At the moment, there are patterns in the indicator:

  • Alternate bat
  • Bat
  • Butterfly
  • Crab
  • Cypher
  • Deep crab
  • Gartley

Indicator control panel

The indicator is controlled by two buttons.

Button A - turns the alert on or off.

Button S - performs a single market scan. Useful on weekends when the market is closed and the information on the indicator is not updated with the arrival of new quotes.

Pattern buttons - When you click on any of the patterns on the panel on the current chart, the desired tool will open on the desired timeframe and display the desired pattern.

Important points of use

When analyzing, the indicator uses very large amounts of information, which may require free space on the C drive in the folder with the trading terminal. For example, when analyzing 30 pairs for 5 price ranges from H1 to Mn, the indicator simultaneously downloaded quotes for 11 GB of memory.

Also, be prepared that at the first start, the indicator will not display all the patterns at once until it loads all the quotes necessary for this.

External parameters

  • Symbols - Selection of instruments for analysis
  • depthStepScan - Pattern scanning step
  • minDepthScan - Start of scan range
  • maxDepthScan - End of scan range
  • uncertaintyHeadScan - Percentage of error for the body of the pattern's target candle
  • uncertaintyShadowScan - Percentage of error for the shadow of the pattern's target candle
  • usePushWithAlert - Whether or not to use push notifications with an alert
  • MaxBarAge - The maximum age of the pattern displayed in the table
  • MaxBarAgeScan - The maximum number of bars within which patterns are searched
  • Timeframes - Selection of time frames displayed on the panel
  • Patterns - Selection of patterns tracked by the indicator
  • X_A_B_C_D_color - Color of letters X-A-B-C-D
  • color_bullish_pattern_name - Name color for bullish patterns
  • color_bullish_lines - Line color for bullish patterns
  • color_bullish_triangle - Triangle color for bullish patterns
  • color_bullish_fibo - Color of fibo levels for bullish patterns
  • color_bearish_pattern_name - Name color for bearish patterns
  • color_bearish_lines - Line color for bearish patterns
  • color_bearish_triangle - Triangle color for bearish patterns
  • color_bearish_fibo - Color of fibo levels for bearish patterns
  • SL_color - Stop zone color
  • colorTakeProfitOne - Color of the first take profit zone
  • colorTakeProfitTwo - Color of the second take profit zone


Bewertungen 5
shandeth
20
shandeth 2023.01.23 10:52 
 

Очень хороший индикатор. При установке возникла некоторая сложность, которую Андрей (разработчик) оперативно помог устранить. Помогает найти точку входа и выставить приказы TP и SL. Учитывая предыдущие наработки (индикаторы), с ним не трачу много времени на анализ информации. Подключил уведомления на смартфон, торговля вообще стала без всякого напряжения. Супер. Спасибо.

Vaxik
24
Vaxik 2022.12.14 14:18 
 

Отличный индикатор. Сначала возникли трудности, но Андрей за считаные минуты помог все решить. Спасибо за проделанный труд!

Kai2905
66
Kai2905 2022.12.09 22:32 
 

Отличный индникатор, купил, работает, я доволен

Empfohlene Produkte
Tunafish EA
Ismaele Daniele Lodetti
Tunafish EA is the most efficient EA on my profile. I spent a lot of time and effort to make this software sophisticated with possibilities of high potential returns while keeping the drawdown below 25%. The algorithms of the robot provide investors of any level of training with an investment opportunity that is both safe and aggressive. Tunafish EA imitating the work of the brain, capable of learning and adapting to changing conditions and predicting situations. When applied to trading in fina
69 USD
Multi-timeframe trend indicator based on the ADX / ADXWilder indicator with Fibonacci levels The indicator shows trend areas using ADX or ADXWilder indicator data from multiple timeframes. The impulse mode of the indicator allows you to catch the beginning of a trend, and several "Screens" with different timeframes allow you to filter out market noise. Fibonacci levels are added to the price chart, which have flexible settings. How the indicator works: if PDI is greater than NDI, then   it`
35 USD
A professional tool for trading - the divergence indicator between the WPR and the price, which allows you to receive a signal about a trend reversal in a timely manner or catch price pullback movements (depending on the settings). The indicator settings allow you to adjust the strength of the divergence due to the angle of the WPR peaks and the percentage change in price, which makes it possible to fine-tune the signal strength. The indicator code is optimized and is tested very quickly as par
37 USD
A professional tool for trading - the divergence indicator between the  MACD and the price, which allows you to receive a signal about a trend reversal in a timely manner or catch price pullback movements (depending on the settings). The indicator settings allow you to adjust the strength of the divergence due to the angle of the  MACD peaks and the percentage change in price, which makes it possible to fine-tune the signal strength. The indicator code is optimized and is tested very quickly as
37 USD
The indicator detects divergence signals - the divergences between the price peaks and the MACD oscillator values. The signals are displayed as arrows in the additional window and are maintained by the messages in a pop-up window, e-mails and push-notifications. The conditions which formed the signal are displayed by lines on the chart and in the indicator window. The indicator parameters MacdFast - fast MACD line period MacdSlow - slow MACD line period MacdSignal - MACD signal line period Mac
30 USD
Premium-Level ist ein einzigartiger Indikator mit mehr als 80% Genauigkeit der richtigen Vorhersagen! Dieser Indikator wurde von den besten Trading-Spezialisten seit mehr als zwei Monaten getestet! Den Indikator des Autors finden Sie nirgendwo anders! Anhand der Screenshots können Sie sich von der Genauigkeit dieses Tools überzeugen! 1 ist ideal für den Handel mit binären Optionen mit einer Ablaufzeit von 1 Kerze. 2 funktioniert bei allen Währungspaaren, Aktien, Rohstoffen, Kryptowähr
1 100 USD
MACDivergence MTF MT5
Pavel Zamoshnikov
4.17 (6)
Advanced ideas of the popular MACD indicator: It detects and displays classic and reverse divergences (two methods of detecting divergences). It uses different color to highlight an uptrend and a downtrend. Two methods of determining a trend: а) MACD crosses the 0 level (classic signal); б) MACD crosses its own average (early signal). This is a multi-timeframe indicator: it can display MACD data from other timeframes. Two methods of drawing: classic histogram and line. It generates sound and vis
30 USD
Supertrend indicator uses a combination of a moving average and average true range to detect the trend of a trading instrument. Supertrend indicator for MetaTrader 5 easily shows the trend as a line following the price. Triple SuperTrend Histo indicator  calculate  three supertrends to show the trend as a histogram. Changing the color from red to green means you can BUY , from green to red means you can SELL . Description of the method of drawing a histogram. The price is above the EMA 20
99 USD
Trend arrow Super MT5  is an   arrow   Indicator used as an assistant tool for your trading strategy. The indicator analyzes the standard deviation of bar close for a given period and generates a buy or sell signals if the deviation increases. It good to combo with Martingale EA to follow Trend and Sellect Buy Only/Sell Only for EA work Semi-Automatic. You can use this  Indicator with any EAs in my Products.     Version for MT4 -  Trend arrow Super
250 USD
Vortex MT5
KEENBASE SOFTWARE SOLUTIONS
The Vortex Indicator was first presented by Douglas Siepman and Etienne Botes in January 2010 edition of Technical Analysis of Stocks & Commodities. Despite its based on a complex implosion phenomenon, the vortex is quite simple to interpret. A bullish signal is generated when +VI line cross above the -VI line and vice versa. The indicator is mostly used as a confirmation for trend trading strategies. The Vortex was inspired by the work of Viktor Schauberger, who studied the flow of water in tur
30 USD
Ichimoku Kinko Hyo is a purpose-built trend trading charting system that has been successfully used in nearly every tradable market. It is unique in many ways, but its primary strength is its use of multiple data points to give the trader a deeper, more comprehensive view into price action. This deeper view, and the fact that Ichimoku is a very visual system, enables the trader to quickly discern and filter "at a glance" the low-probability trading setups from those of higher probability. This i
30 USD
Gekko MACD Plus
Rodrigo Galeote
3 (2)
Type: Oscillator This is Gekko's Cutomized Moving Average Convergence/Divergence (MACD), a customized version of the famous MACD indicator. Use the regular MACD and take advantage of several entry signals calculations and different ways of being alerted whenever there is potential entry point. Inputs Fast MA Period: Period for the MACD's Fast Moving Average (default 12); Slow MA Period: Period for the MACD's Slow Moving Average (default 26); Signal Average Offset Period: Period for the Signal
50 USD
Der Indikator berechnet und zeichnet automatisch Fibonacci-Unterstützungs- und Widerstandsniveaus - eines der effektivsten Werkzeuge für die Marktanalyse. Die Berechnung verwendet die gemittelten Preisdaten für den ausgewählten Zeitraum und Zeitraum. Das Minimum und das Maximum für diesen Zeitraum gelten als Beginn und Ende der Bewegung. Fibonacci-Niveaus ermöglichen es Ihnen, potenzielle Referenzpunkte zu erkennen, um die sich die Preisbewegung verlangsamen oder umkehren kann, dh sie werden ver
30 USD
Fit line supports to extrapolation next movement of market, support for buy/sell decision. Indicator using spline algorithm to extrapolation.  You can change number of spline with parameter "PointsNumber" and number of extrapolation point with "ExtrapolateBars". Eextrapolation points will be save into csv format, with prefix in parameter "PointsPrefix", and store in folder File of Data Folder.
50 USD
Gartley Hunter MT5
Siarhei Vashchylka
5 (7)
Gartley Hunter - Indicator for finding harmonic patterns (Gartley patterns) and their projections. The indicator is equipped with an alert system. List of patterns At the moment, the indicator contains patterns:     Alternative bat     Bat     Butterfly     Crab     Cypher     Deep crab     Gartley Indicator control panel The pattern control panel is located in the lower left corner of the screen. See the picture below for a description of the panel. There are Russian and English version
149 USD
Weis Wave with Alert MT5
Panagiotis Diamantopoulos
4.92 (13)
20% Off from 499$ to 399$, offer end 31/3/2023    https://youtu.be/RjSSW0byp-I ** NEW PLUTUS SIGNALS and ALL IN ONE ** Wychoff's UpThrust + Spring, Fake Breaks and Plutus  trading signals added (for more info visit    http://www.tradethevolumewaves.com  ) (for more info visit    http://www.tradethevolumewaves.com )   Different Wave Types,  choose what your cumulative Histogram diplays: Volume, Pips, Progressive Volume Rate, Time or Emphasized Volume Waves  ** IF YOU PURCHASE DO NOT FORGET TO CO
399 USD
FXC iMACD-DivergencE MT5 Indicator This is an advanced MACD indicator that finds trend-turn divergences on the current symbol. The indicator detects divergence between the MACD and the price movements as a strong trend-turn pattern. Main features: Advanced divergence settings Price based on Close, Open or High/Low prices Give Buy/Sell open signals PUSH notifications E-mail sending Pop-up alert Customizeable Information panel Input parameters: MACD Fast-EMA: The Fast-EMA variable of the MACD
30 USD
DUCHOAN99 would like to send you the  indicator  Donchian Channels Multi Timeframe Real Value for MT5 . Please download the demo to see if the indicator helps you or not before deciding to buy this indicator. 1. KEY TAKEAWAYS Donchian Channels are a technical indicator seeks to identify bullish and bearish extremes that favor reversals as well as higher and lower breakouts, breakdowns, and emerging trends. The middle band simply computes the average between the highest high over N periods an
30 USD
Rainbow EA MT5
Jamal El Alama
Description : Rainbow EA MT5 is a simple Expert advisor based on   Rainbow MT5 indicator witch is based on Moving average with period 34. The indicator is incorporated in the EA, therefore, it is not required for the EA to operate, but if you wish, you can download it from   my product page . The Expert Advisor settings are as follows : Suitable for Timeframes up to H1 The parameters below can be set according to your trading rules. StopLoss ( Stop Loss in pips) TakeProfit ( Take Profit in pi
59 USD
Bober Real MT5
Arnold Bobrinskii
4.56 (18)
Bober Real MT5 is a fully automatic Forex trading Expert Advisor. This robot was made in 2014 year and did a lot of profitbale trades during this period. So far over 7000% growth on my personal account. There was many updates but 2019 update is the best one. The robot can run on any instrument, but the results are better with EURGBP, GBPUSD, on the M5 timeframe. Robot doesn't show good results in tester or live account if you run incorrect sets. Set files for Live accounts availible only for c
700 USD
Signalings
Maryna Shulzhenko
Signaling is a very interesting trend indicator. The Destroyer of Chaos indicator helps to identify either a new or an existing trend. One of the main definitions for monitoring the currency market is a trend, which is why this indicator was created. Its signals are based on a reliable algorithm. When used simultaneously on multiple timeframes, this indicator truly "makes the trend your friend". With it, you can follow trends on multiple timeframes in real time. One of the advantages of the indi
109 USD
SQN Max indicator for MT5 by ITC
Renaud Herve Francois Candel
Sqn Max Indicator Sqn Max is an exclusive indicator to trade the market with high effectiveness. The indicator is based on price action, volatility and trend. This indicator is as simple as possible but not too simple. The indicator can generate alerts to ease the trading process. You don't have to stay all day in front of your screen. The indicator can be used with any class of assets and with any time frame. It is possible to achieve better results trading our list of selected assets. W
397 USD
Tools zum Verdienen und Forschen. Der Kern der Handelssignale und -strategie basiert auf dem Algorithmus des Autors zur Bildung von Preisprognosemustern. Für jedes Instrument anwendbar! Ergänzt um ein Kontrollsystem basierend auf dem MA "Nine-Tailed Fox" , das das Signal so genau wie möglich für den Markt, das Instrument und den Arbeitszeitraum aktualisiert und anpasst. Zugelassen: Alle Instrumente in allen Märkten (es gibt Ausnahmen). Für wen: Hedgefonds, Fonds- und Vermögensverwalter, Anlag
25 920 USD
This is a multi-symbol and multi-timeframe table-based indicator designed for a candlestick patterns detection with 46 patterns for META TRADER 5. Each formation has own image for easier recognition. Here you find most popular formations such as "Engulfing", "Hammer", "Three Line Strike", "Piercing" or Doji - like candles. Check my full list of patterns on my screenshots below. Also you can not only switch all bearish or bullish patterns from input, but also select formation for a specified symb
30 USD
Oscilador Yacht
Ignacio Agustin Mene Franco
Package Yacht indicator 2/3 Oscillator yacht, has the strategy of breakouts with the oscillator in the levels, 1.05, 0.50, 0.00, 050 and 1.05 are 5 levels where the volume no longer gives in the period of 1.05 on the lower side, the red candle begins to form, rising ay gives long signal, where it verifies it with 3 yellow, green and red dots, the same is for short when it breaks the green level, and breaks the line changing color starts entry works for forex markets and synthetic indices all tem
80 USD
FXC iDeM-DivergencE MT5 Indicator This is an advanced DeMarker indicator that finds trend-turn divergences on the current symbol. The indicator detects divergence between the DeMarker and the price movements as a strong trend-turn pattern. Main features: Advanced divergence settings Price based on Close, Open or High/Low prices Give Buy/Sell open signals PUSH notifications E-mail sending Pop-up alert Customizeable Information panel Input parameters: DeM Period: The Period size of the DeMarke
30 USD
Advanced 4xZeovo MT5 Indicator (MetaTrader 5)   Product Description  4xZeovo is a powerful trading indicator system monitoring 24/7 financial markets. Metatrader5 tool designed to find the best buying/selling opportunities and notifies the user.    Making life easy for traders in helping with the two most difficult decisions with the use of advanced innovate trading indicators aiming to encourage users to hold the winning positions and take profit at the best times.    Equipped with a unique tra
100 USD
A professional tool for trading - the divergence indicator between the  Stochastic and the price, which allows you to receive a signal about a trend reversal in a timely manner or catch price pullback movements (depending on the settings). The indicator settings allow you to adjust the strength of the divergence due to the angle of the  Stochastic peaks and the percentage change in price, which makes it possible to fine-tune the signal strength. The indicator code is optimized and is tested ver
37 USD
Macd Rsi
Ignacio Agustin Mene Franco
macd rsi It is a macd indicator added to the rsi to capture perfect entries in the average crossovers! As seen in the indicator, it has 2 lines, one of gold color and the other violet line, where the cross of the violet with the gold downwards is a sell signal when it crosses the violet up from the gold it is a buy signal! very good to make shorts works for forex markets and synthetic indices It is used in any temporality! Good profit! World Investor.
50 USD
Win43 Scalper
Eadvisors Software Inc.
O novo s43 Scalper para Mini-Índice (WIN-IND) faz operações de curto prazo no timeframe 1min buscando pequenas variações do mercado, utiliza nova tecnologia de trade, os resultados no intraday são íncríveis, confira:      Após a instalação adicione no gráfico dos instrumentos win para visualizar os resultados no backteste. Recomendamos o timeframe de 1min.
200 USD
Käufer dieses Produkts erwarben auch
Introduction to X3 Chart Pattern Scanner X3 Cherart Pattern Scanner is the non-repainting and non-lagging indicator detecting X3 chart patterns including Harmonic pattern, Elliott Wave pattern, X3 patterns, and Japanese Candlestick patterns. Historical patterns match with signal patterns. Hence, you can readily develop the solid trading strategy in your chart. More importantly, this superb pattern scanner can detect the optimal pattern of its kind. In addition, you can switch on and off individu
250 USD
Offer 249 down from 350 for the next 3 copies. then back to 350 $ Are you tired of using outdated indicators that leave you guessing where to set your profit targets? Look no further than the AK CAP Opening Range Breakout Indicator. This powerful tool is backed by a US patent and has already helped countless traders pass funded challenges like FTMO. We use it daily on our prop traders and internal funds, and now it's available to you as well. The calculation behind the indicator is incredibly
249 USD
Relative Cyclicality
Cristian Mihail Pauna
The Relative Cyclicality indicator defines the cycles of any price evolution. This indicator is computed by applying the "Cyclicality" mathematical transformation to the classic Relative Strength Index indicator made by J. Welles Wilder. The Relative Cyclicality defines very good entry and exit trading signals near the minimal and maximal points. It is better than RSI itself due to the unicity of the minimal and maximal points on a specific time interval. The Relative Cyclicality indicator can b
300 USD
Price Cyclicality MT5
Cristian Mihail Pauna
The Price Cyclicality indicator defines the cycles of any price evolution. It shows clearly the ascending and descending intervals with asymptotic evolution near the minimal and maximal price values. The Price Cyclicality indicator can be used to generate automated entry signals near the minimal price values. Also, the Price Cyclicality indicator can be used to define limit conditions to generate automated exit signals near the maximal price values. The efficiency of this indicator was proved du
300 USD
Eazy Indicator
Isaac Agyei Poku
Forex BUY and SELL signals from the best Heiken Ashi Smoothed indicator. Draw bullish/bearish bars on the chart. Accurate trend detector. Heiken Ashi Smoothed is a simple MT5 indicator that draws bullish and bearish bars in the chart to reflect the direction of the trend. The indicator consists of orange bearish bars and green bullish bars. When the trend changes its direction, the indicator changes its color. The indicator is a modernization of the traditional Heiken Ashi indicator. Moving Aver
900 USD
Big promotion! , prices are now on discount , get your copy now  The   Rubdfx Price Tracker   that is used to show price price bound , the price almost never goes out of the channel and most of the time price will react when it touches the channel limits .It determines the best highest and lowest prices at which you can sell and buy respectively Suitable for scalping & swing trading It Draws arrows that appear after a candle close , The arrows indicate bullish or bearish pressure For bearish an
259 USD
• Non Repaint • DelayNo Lag •Pop Up notification • 98% Verified Accuracy • Real time arrows to catch spikes at least 4-8 bars We forward guide video how milk spikes  We also add in telegram group for better quality help  +see live trading results  https://youtu.be/DCG4CAWlg4I you will see an arrow signal and open trade for spike stop-loss of trade will be 8 or 10 candles if no spike exit you just need to follow spike arrow signals and for more good results follow inst
200 USD
[ MT4 Version ] Orderblock-Indikator MT5 Der Order Block Indicator MT5 ist derzeit der genaueste und anpassbarste Indikator auf dem Markt. Es wurde entwickelt, um die Analyse von Operationen basierend auf Auftragsblöcken und Angebots- und Nachfragezonen zu erleichtern. Diese Zonen sind mögliche Umkehrpunkte einer Bewegung. Orderblock Indicator MT5 hebt aktive Orderblöcke von bis zu 4 TFs gleichzeitig hervor. Gleichzeitig bietet der Order Block Indicator MT5 ein visuelles Warnsystem, mit dem Sie
224 USD
Introduction Excessive Momentum Indicator is the momentum indicator to measure the excessive momentum directly from raw price series. Hence, this is an extended price action and pattern trading. Excessive Momentum Indicator was originally developed by Young Ho Seo. This indicator demonstrates the concept of Equilibrium Fractal Wave and Practical Application at the same time. Excessive Momentum detects the market anomaly. Excessive momentum will give us a lot of clue about potential reversal and
200 USD
MT4 Version   Kill Zones   SMT Divergences Order Blocks ICT Multi TF The Order Blocks ICT Multi TF indicator is a cutting-edge tool designed to help traders make better trading decisions based on order block analysis. Order blocks are key levels on a price chart where large institutional traders placed their orders. These levels tend to act as strong support or resistance zones and often signal a potential reversal or continuation of a trend. By identifying these order blocks, traders can gain
224 USD
Introduction to EFW Analytics EFW Analytics was designed to accomplish the statement "We trade because there are regularities in the financial market". EFW Analytics is a set of tools designed to maximize your trading performance by capturing the repeating fractal geometry, known as the fifth regularity in the financial market. The functionality of EFW Analytics consists of three parts. Firstly, Equilibrium Fractal Wave Index is an exploratory tool to support your trading logic to choose which r
200 USD
VTrende Pro
Andrey Dyachenko
VTrende Pro - MTF indicator for trend trading with a display panel for MT5 *** Videos can be translated into any language using subtitles (video language - Russian) Although the signals of the VTrende Pro indicator can be used as signals of a full-fledged trading system, it is recommended to use them in conjunction with the Bill Williams TS. VTrende Pro is an extended version of the VTrende indicator. Difference between Pro version and VTrende: - Time zones - Signal V - signal 1-2 waves
697 USD
This is my own modified version of the RMI indicator. Its one of the best indicators i've found to take small profits from the market and i've been able to make it slightly better by modifying and fine tuning some parts Default settings works best for M1 timeframe The Relative Momentum Index calculates a ratio of upwards changes to downwards changes in prices over N-period bars. The RMI values range between 0 and 100. 30 and 70 are the two levels of oversold and overbought market conditions re
500 USD
Fibonacci Suavizado
Cesar Juan Flores Navarro
Indicador en MQL5, que obtiene el promedio de 10 EMAS, que son alineadas según Fibonacci, obteniendo un promedio, que sera suavizado.  Se puede ingresar un numero desde 2 a N, que multiplica a los EMA-Fibonacci. Funciona en cualquier criptomoneda, etc. etc... pudiendo calcular el futuro segun la tendencia de las EMAS. Funciona excelentemente en tramos largos, determinando exactamente el mejor inicio/salida. El precio inicial por apertura sera por un periodo de tiempo, luego aumentará.
1 000 USD
Elliott Wave Trend was designed for the scientific wave counting. This tool focuses to get rid of the vagueness of the classic Elliott Wave Counting using the guideline from the template and pattern approach. In doing so, firstly Elliott Wave Trend offers the template for your wave counting. Secondly, it offers Wave Structural Score to assist to identify accurate wave formation. It offers both impulse wave Structural Score and corrective wave Structure Score. Structural Score is the rating to sh
200 USD
Robos
Namu Makwembo
5 (2)
Big promotion on the Robos, Get yours now Robos Indicator The   ROBOS   indicator is a multi timeframe oscillator that targets the   overbought   and   oversold  regions of a price chart, a signal is indicated by the two lines crossing, compatible with all tradable instruments Latest Release The latest release is the version 4.0 #What's new in version 4.0 ? Features Extreme oversold and overbought levels ROBOS version  4.0  comes with cool new feature , the ability to target only
249 USD
MT4 Version SMT Divergences MT5 SMT Divergences is one of the most innovative indicators in the market. It offers the possibility of analyzing price divergences between 2 pairs. These divergences highlight and help to foresee what banks and institutions are planning to do. SMT divergences also provides you with a kill zones indicator and the possibility of filtering divergences occurring during these kill zones.  This indicator is specially powerful if applied in 2 highly correlated pairs. A pr
224 USD
Description Very precise patterns to detect: entry signals as well as breakout, support and resistance reversal patterns. It points out zones in which, with a high probability, institutional orders with the potential to change the price’s direction and keep moving towards it, have been placed. Support:   We create great tools for the entire trading community. Most of them are free. If you believe in what we do  Support Us Here.   KEY LINKS:   Indicator Manual  -  All Products  How is this ind
280 USD
All in One package includes the  Oscillator Predictor ,  MACD Predictor ,  Thrust Scanner  and  Advanced Fibonacci  indicators which are mandatory for applying  Dinapoli  trade plans.  Please visit below links for detailed explanations of indicators. Advanced Fibonacci Indicator =>  https://www.mql5.com/en/market/product/52835 Thrust Scanner Indicator =>  https://www.mql5.com/en/market/product/52829 Overbought /Oversold Predictor indicator => https://www.mql5.com/en/market/product/52628 Mac
240 USD
Outside The Box
Innovicient Limited
The Outside The Box (OTB) is a complete trading system that provides the user with immense trading ability by highlighting on the chart areas where the trader should prepare to Re-enter the trend after pullbacks (Pullback trading strategy) Take partial/complete profit(Profit taking strategy), and Trade breakouts (Stock breakout strategy) - We have updated the indicator to show/hide Micro breakout areas around the major breakouts (Micro Breakouts).  The above is supported by an alert system to no
250 USD
Elliot Waves Analyzer Pro
Viktor Weidenthal
3.67 (3)
Elliot Waves Analyzer Pro calculates Elliot Waves to Help Identify Trend direction and Entry Levels. Mainly for Swing Trading Strategies. Usually one would open a Position in trend direction for Wave 3 or a Correction for Wave C . This Indicator draws Target Levels for the current and next wave. Most important Rules for Elliot Wave Analysis are verified by the Indicator.  The Pro version analyzes Multiple Timeframes and shows the Subwaves and Target-Levels.   For an Overview  " Elliot Waves Anal
220 USD
Smooth price for Monarch
Konstantin Gruzdev
5 (1)
The Smooth Price technical indicator is used for plotting a smoothed line as close to the price of the financial instrument as possible, and serves to eliminate its noise components. The indicator is part of the Monarch trading system, but here it is presented as an independent technical analysis tool. The indicator is based on the cluster digital filter , which, unlike the ClusterSMA , is applied directly to the price time series. Smooth Price does not redraw (except the very last, zero bar) an
999 USD
Adaptive Cyclicality
Cristian Mihail Pauna
5 (1)
The Adaptive Cyclicality indicator defines the cycles of any price evolution. This indicator is computed by applying the "Cyclicality" mathematical transformation to the Adaptive Moving Average function introduced by Perry J. Kaufmann. The Adaptive Cyclicality defines very good entry and exit trading signals near the minimal and maximal points. It is a very accurate indicator that can be used on any market and any timeframe. The Adaptive Cyclicality indicator can be used to generate automated en
300 USD
Seconds Charts
Aleksandr Goryachev
Micro  ******************* Секундные графики MT5 ********************** Более точного инструмента для входа в сделку вы не найдёте. Входные параметры: Timeframe, sek - период построения графика, секунды Displayed bars - отображаемые бары Step of price levels, pp, 0-off - шаг отрисовки ценовых уровней, пункты Scale points per bar, 0-off - масштаб в пунктах на бар Show lines - отображение текущих уровней Show comment - отображение комментария Standard color scheme - стандартная цветовая сх
1 500 USD
Incinerat8
Paulos Ngwenya
5 (1)
This algorithm uses real time data to generate signals with an accuracy rate of 80%. It shows entries and where you should place both the stoploss and the take profit for each trade. It determines trend! It can even help you to become a signal provider! And it can generate up to 8 signals a day! You get access to a free forex trading community  Operates on any broker compatible to synthetic indices and forex   if you need any assistance whatsapp +2774 35 35 744 or telegram link @pipsempire01
400 USD
Prices move for many reasons and these can vary from one operator to another: software, private and institutional traders simultaneously contribute to the formation of the price, making predictive art very difficult. However, there are measurable factors that bind the price to an underlying trend in line with the physical reality that the financial asset represents: these are the macroeconomic indicators. Large investors use this information wisely to set their strategies. Understanding these m
249 USD
Boom and Crash Ultra
Munyaradzi Isaac Butau
This is an indicator meant to catch trends as they are coming from a retracement .it can be used for any symbol . We can use this indicator to catch spikes or sculp for Boom , Crash ,Range Break . it offers a sell signal and buy signal and an exit signal which can also be used to enter price reversal if you see fit the indicator has a higher time frame filter system which can go up to 2 levels of time filtering which will give you more accurate signals based on the trend ,this feature can be tur
200 USD
How to use Pair Trading Station Pair Trading Station is recommended for H1 time frame and you can use it for any currency pairs. To generate buy and sell signal, follow few steps below to apply Pair Trading Station to your MetaTrader terminal. When you load Pair Trading Station on your chart, Pair Trading station will assess available historical data in your MetaTrader platforms for each currency pair. On your chart, the amount of historical data available will be displayed for each currency pai
280 USD
The Price Prediction Line is a very accurate indicator predicting the next price movement of any market in any timeframe. There is no repaint of the indicator when a new interval arrives, and the indicator can be used by anyone to automate with iCustom function. The Price Prediction Line shows clearly the ascending and descending intervals and, most important, comparatively with other signal lines from the market, the Price Prediction Line signal arrives much earlier giving us a better profit e
200 USD
[ MT4 Version ] Supply and Demand Multitimeframe Supply and Demand Multitimeframe is the first indicator in the market that combines multiple aspects like trading volume, price structure and momentum to identify Supply and Demand zones for every asset. The Supply and Demand indicator analyzes simultaneously up to 4 different TFs and represents their information in the current graph. Its interactive UI highlights everytime the price enters a Supply or Demand zone even if the zones are not visible
224 USD
Weitere Produkte dieses Autors
Gartley Hunter Multi MT4
Siarhei Vashchylka
5 (2)
The Gartley Hunter Multi indicator is designed to search for Gartley patterns on a very large number of currency pairs (maximum 60) and on all standard time frames (m1, m5, m15, m30, H1, H4, D1, Wk, Mn) at the same time. The search is carried out automatically. After finding the pattern, the indicator will send an Alert or notification to the mobile phone. List of patterns At the moment, there are patterns in the indicator: Alternate bat Bat Butterfly Crab Cypher Deep crab Gartley Indicator cont
199 USD
Price Action Finder MT5
Siarhei Vashchylka
5 (7)
The Price Action finder indicator displays Price action patterns on the price chart. Pattern List: Pin Bar (Pin) Outside bar (OB) Inside bar (IB) PPR Force bar The hanged man (HM) Inverted hammer (HR) Filter For novice traders, in the new version of the indicator, we have added a trend filter taken from Elder's Three Screens system. Now it can be enabled in the external parameters of the indicator. The trend filter is configured for each price range separately. External parameters: FB  -  Dis
99 USD
Price action finder
Siarhei Vashchylka
5 (4)
The Price Action finder indicator displays Price action patterns on the price chart. Pattern List: Pin Bar (Pin) Outside bar (OB) Inside bar (IB) PPR Force bar The hanged man (HM) Inverted hammer (HR) Filter For novice traders, in the new version of the indicator, we have added a trend filter taken from Elder's Three Screens system. Now it can be enabled in the external parameters of the indicator. The trend filter is configured for each price range separately. External parameters: FB  -  Dis
99 USD
The Price Action Finder Multi indicator is a multi-currency and multi-timeframe indicator. It searches for patterns of the Price Action system on all standard time frames at once and on a large (up to 60) number of instruments (currencies, stocks, metals, etc.). The resulting patterns are placed by the indicator in a table at the bottom of the screen. Patterns: At the moment, the indicator contains the following patterns: Outside bar , Inside bar , Pin bar , Force bar , PPR , as well as the In
149 USD
Gartley Hunter MT5
Siarhei Vashchylka
5 (7)
Gartley Hunter - Indicator for finding harmonic patterns (Gartley patterns) and their projections. The indicator is equipped with an alert system. List of patterns At the moment, the indicator contains patterns:     Alternative bat     Bat     Butterfly     Crab     Cypher     Deep crab     Gartley Indicator control panel The pattern control panel is located in the lower left corner of the screen. See the picture below for a description of the panel. There are Russian and English version
149 USD
The Price Action Finder Multi indicator is a multi-currency and multi-timeframe indicator. It searches for patterns of the Price Action system on all standard time frames at once and on a large (up to 60) number of instruments (currencies, stocks, metals, etc.). The resulting patterns are placed by the indicator in a table at the bottom of the screen. Patterns: At the moment, the indicator contains the following patterns: Outside bar , Inside bar , Pin bar , Force bar , PPR , as well as the In
149 USD
Elliott Wave Helper
Siarhei Vashchylka
4.75 (4)
Elliott Wave Helper - A panel for marking Elliott wave  and technical analysis. Wave Analysis: Allows you to build a wave analysis in a few clicks with the definition of the type and order of waves. - Choice of color, style and font of waves is available. - Marking of impulses, triangles, zigzags, flats, simple and complex combinations is available. Special wave font is supported. To activate it, you need to do the following: Download the font following the link: https://traderevolution.ru/upl
99 USD
The Fractal Advanced indicator is an advanced version of the Fractals indicator by Bill Williams. It is equipped with sound alerts, a large number of customizations and the ability to hide the indicator by pressing hotkeys. Hotkeys Fractal - By holding down the Shift key and scrolling with the mouse, you can increase and decrease the number of fractals on the current chart. The key combination Shift + A completely removes fractals from the chart. Alligator - Using the key combination Shift + S
69 USD
Gartley Hunter MT4
Siarhei Vashchylka
5 (2)
Gartley Hunter - Indicator for finding harmonic patterns (Gartley patterns) and their projections. The indicator is equipped with an alert system. List of patterns At the moment, the indicator contains patterns:     Alternative bat     Bat     Butterfly     Crab     Cypher     Deep crab     Gartley Indicator control panel The pattern control panel is located in the lower left corner of the screen. See the picture below for a description of the panel. There are Russian and English versions.
149 USD
Elliott Wave Helper MT4
Siarhei Vashchylka
5 (5)
Elliott Wave Helper - A panel for marking Elliott wave  and technical analysis. Wave Analysis: Allows you to build a wave analysis in a few clicks with the definition of the type and order of waves. - Choice of color, style and font of waves is available. - Marking of impulses, triangles, zigzags, flats, simple and complex combinations is available. Special wave font is supported. To activate it, you need to do the following: Download the font following the link: https://traderevolution.ru/upl
99 USD
Trading Helper
Siarhei Vashchylka
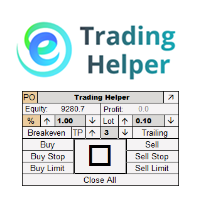
Trading Helper is a program for money managing and trading. It has pending and immediate orders and equipped with the functions of trailing stop, breakeven and take profit. The panel is designed for trading only on currency pairs and only on dollar accounts. Before starting trading, it is recommended to choose the method of calculating the trading volume that you will use. % - If this button is pressed, the program will select a trading volume based on the risk inherent in it. The percenta
99 USD
Trader Evolution MT4
Siarhei Vashchylka
5 (1)
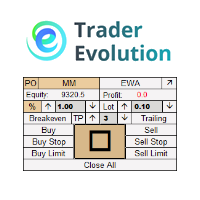
Trader evolution - A program for money management, technical analysis and counting waves. The panel is designed for trading only on currency pairs and only on dollar accounts. The control panel of the program consists of two tabs between which the user can switch. The first tab "MM" (Money manager) is responsible for money management, and the second "EWA" (Elliott wave analyzer) for counting waves and building technical analysis. Money management (activated by pressing the MM button on the pa
189 USD
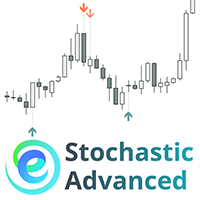
Stochastic Advanced MT4 - An indicator that displays Stochastic indicator signals for several timeframes at once. Signals are displayed as arrows on the price chart without the presence of the lower indicator panel. The appearance, type and color of the arrows can be configured in the external parameters of the indicator. T rading signals: The indicator duplicates the signals of the Stochastic indicator according to the following criteria: A long signal comes if the main Stochastic line reverses
59 USD
Trading History MT4
Siarhei Vashchylka
5 (1)
Trading History - A panel for trading on the history of quotes in strategy tester . It involves working with pending and immediate orders, equipped with trailing stop, breakeven and takeprofit functions. It is an analogue of the panel for real trading Trading Helper . Attention! The demo version only works on the GBPJPY currency pair Before starting trading, it is recommended to choose the method of calculating the trading volume that you will use. % - If this button is pressed, the program
99 USD
Trader Evolution
Siarhei Vashchylka
5 (2)
Trader evolution - A program for money management, technical analysis and counting waves. The panel is designed for trading only on currency pairs and only on dollar accounts. The control panel of the program consists of two tabs between which the user can switch. The first tab "MM" (Money manager) is responsible for money management, and the second "EWA" (Elliott wave analyzer) for counting waves and building technical analysis. Money management (activated by pressing the MM button on the pan
189 USD
Stochastic Advanced MT5
Siarhei Vashchylka
5 (1)
Stochastic Advanced MT4 - An indicator that displays Stochastic indicator signals for several timeframes at once. Signals are displayed as arrows on the price chart without the presence of the lower indicator panel. The appearance, type and color of the arrows can be configured in the external parameters of the indicator. T rading signals: The indicator duplicates the signals of the Stochastic indicator according to the following criteria: A long signal comes if the main Stochastic line reverses
59 USD
Auswahl:
shandeth
20
shandeth 2023.01.23 10:52 
 

Очень хороший индикатор. При установке возникла некоторая сложность, которую Андрей (разработчик) оперативно помог устранить. Помогает найти точку входа и выставить приказы TP и SL. Учитывая предыдущие наработки (индикаторы), с ним не трачу много времени на анализ информации. Подключил уведомления на смартфон, торговля вообще стала без всякого напряжения. Супер. Спасибо.

Vaxik
24
Vaxik 2022.12.14 14:18 
 

Отличный индикатор. Сначала возникли трудности, но Андрей за считаные минуты помог все решить. Спасибо за проделанный труд!

Kai2905
66
Kai2905 2022.12.09 22:32 
 

Отличный индникатор, купил, работает, я доволен

nawafalazemi
444
nawafalazemi 2022.12.01 22:44 
 

slow i want help me

Siarhei Vashchylka
4262
Antwort vom Entwickler Siarhei Vashchylka 2022.12.01 23:16
Please add me on telegram so I can understand what is the problem: https://t.me/traderevolution
EEWA
71
EEWA 2022.11.27 10:48 
 

Хороший индикатор. Сканирует сразу много пар и присылает уведомления на телефон. Я добавил 20 пар, по описанию можно до 60 пар. Рекомендую!

Antwort auf eine Rezension
Version 1.1 2022.11.28
Fixed bug of not displaying some instruments