• Übersicht
  • Bewertungen (3)
  • Diskussion (4)

The 123 Pattern Strategy With Fibonacci MT5

3.5

Current Price $30 Minimum Possible BUT Future Price $100!

YES, It Can be used on All Markets and All Timeframes.

The MT4 Version is Here: https://www.mql5.com/en/market/product/89027?source=Site+Profile+Seller

For Support Join Telegram: https://t.me/dubaiforexgroup

What is 123 Pattern Strategy?

123 pattern Strategy is a Pure Price Action Strategy that does not use any technical indicators, It’s a simple Pattern But Yet very Powerful, Used by a lot of Pro Traders All around the world.

The Concept behind the 123 pattern falls under two scenarios:

1-      Continuation 123 Pattern:

-          The Price should be in a Trend "Up or Down".

-          The Price Pulls back.

-          Traders then Look for reasons to enter at the Pull back to catch the trend.

2-      Reversal 123 Pattern:

-          The Price should be Oversold Or Overbought.

-          The Price Fails To create New High Or New Low.

-          At the Level of Failure the Traders look for reasons to enter.

The power of the 123 Pattern strategy is that its very Simple and easy to understand, evolves only Price action, No technical Indicators.

 How much Does it Cost?

The Lowest Price that Any Indicator on MQL5 Site can Cost is $30 Of Which they will Take 20%!

So basically the cost is Minimum Possible!

Knowing the The Right Pricing of this Indicator is $100 .. (Will It be changed to $100 in the future Highly Likely).

So Its Good chance for you to get It Now!

 What's the formula used?

The indicator has a Smart algorithm that scans the chart to find the Best 123 Patterns, using the Fibonacci Golden Zone, to find the precise pullbacks and precise take profit levels.

What's Fibonacci Golden Zone?

It’s a well-known Strategy among Professional Price action traders, the Concept of this strategy is the following:

The trader will draw Fibonacci levels and mark the levels between 0.382 and 0.786 as the Golden Zone.

Any Pullback to this Zone is Considered very important, because the Golden Zone is considered as a Zone (Area) of value where the price has higher chances to Reverse.

How can I use this indicator as a trader?

1-     Install the Indicator in your chart.

2-     The Indicator will Alert you to Meta Trader and your phone when new 123 patterns are detected and show you exactly where to Enter and where to put the Stop Loss and the Take Profits.

3-     All you have to do is Take the Trades whenever you get Alerted.

Can this Indicator Alert me on Terminal-Email-Phone when 123 Pattern is detected?

Yes...

How to integrate 123 Pattern Strategy in my trading?

The most important thing when it comes to trading is the Analysis of the chart, Imagine you can skip that part and let the Algorithm take care of that for you!

This Algorithm has embedded instruction to find the best 123 patterns and refine them using the Fibonacci levels, to get the best results out of your trading.

So why not Add this strategy to your trading Arsenal!

Removing the human error by using a complex algorithm formula will help not only save the traders time but increase accuracy of entries and  exists signals.

Does it have the Hide and Show Button with Hot key?

Yes.. you can click the button and use X keyboard to Hide/Show the Patterns.

What can I control in this indicator?

This indicator offers full control over everything:

1-     Complete control over the appearance and colors.

2-     Complete control over the Alerts.

3-     Control to show or hide the TPs and SLs.

4-     Control the Fibonacci Levels for the TPs and choose your own TP levels.

Tips:

1. Use On 15 Minutes Timeframe.

2. Use Active Trading Technics Like Moving SL to BE when Profit Reaches TP2.

3. This is a manual Trading strategy so you still need to filter the good signals from the bad.

4. Sometime the signal comes late I call it late Signal and I just Skip It! (After all we have to respect the original Strategy, signal at the close of the Candle).

Leave a review please.

Hit me with suggestions, and ideas for improvement.

Add me @: https://www.mql5.com/en/users/dubaiforexgroup  I will be happy to answer any questions :)

Bewertungen 3
nolimitzfx
113
nolimitzfx 2022.12.18 20:06 
 

Based on what I see on my charts it looks very solid. Remember it does what it is supposed to do - find the 123 pattern - NOW how much knowledge in general you have about trading, chart reading, support - resistance, candle patterns, chart patterns ect will determine if you can use this (or any indicator) to profitability. There is no win all trades indicator. I bought this and it does work. If you have experience with the 123 pattern and are well versed at trading you will like this indicator as well. Good job to the creator!

Empfohlene Produkte
Welcome to the Ultimate Harmonic Patterns recognition indicator  The Gartley, Bat, and Cypher patterns are popular technical analysis tools used by traders to identify potential reversal points in the market. Our Ultimate Harmonic Patterns recognition Indicator is a powerful tool that uses advanced algorithms to scan the markets and identify these patterns in real-time. With our Ultimate Harmonic Patterns recognition Indicator, you can quickly and easily identify potential trading opportunit
59 USD
The indicator detects important peaks and troughs (extremes) on the chart. These points can be used to plot support/resistance levels and trend lines, as well as any other graphical analysis. These points can serve as reference points for setting trading orders. The indicator does not redraw . Settings: Size_History  - the size of the calculated history. Num_Candles_Right  - number of candles to the right of the peak or trough. Num_Candles_Left  - number of candles to the left of the pea
75 USD
The Fibonacci series.  This number sequence is formed as each subsequent number is a sum of the previous two. it turns out that it refers to its neighbors in the ratio 0.618 and 1.618 The most commonly used method for measuring and forecasting the length of the price movement is along the last wave, which ended in the opposite direction The Fibonacci Waves indicator could be used by traders to determine areas where they will wish to take profits in the next leg of an Up or Down trend.
40 USD
This plots  Fibonacci deviation levels above and below a moving average of the price. Companion indicator to the " Golden Bull Wave Trader "  expert advisor which uses volume\price trend to determine price reversals. https://www.mql5.com/en/market/product/56291 The expert advisor and this indicator were created in order to: Identify ideal and repeatable trade entries with high level of certainty Create a day trading strategy which doesn’t require a hard SL and TP Use alternate risk management me
30 USD
This is a well-known ZigZag indicator. But it differs by the fact that its plot is based on values of the middle line which is set by a user. It can display Andrews’ Pitchfork and standard or Bobokus Fibo levels. NO REPAINTING. Parameters Period МА — middle line period. Default value is 34. Minimum value is 4. Maximum value is set at your discretion. Used to calculate price — type of price used for the midline calculations. The averaging method — type of smoothing for the middle line. Turning
40 USD
This indicator will detect harmonic patterns that are drawn on the chart by manual and automatic methods. You can see user manual from this link: https://www.mql5.com/en/blogs/post/719257 There is a free MT4 version to try this product. You can use it to detect Gartley and Nenstar patterns: https://www.mql5.com/en/market/product/30181 You can buy the full MT5 version from: https://www.mql5.com/en/market/product/70105 Notes Indicator has control panel and it will save every (chart & timeframe)
88 USD
Introduction to X3 Chart Pattern Scanner X3 Cherart Pattern Scanner is the non-repainting and non-lagging indicator detecting X3 chart patterns including Harmonic pattern, Elliott Wave pattern, X3 patterns, and Japanese Candlestick patterns. Historical patterns match with signal patterns. Hence, you can readily develop the solid trading strategy in your chart. More importantly, this superb pattern scanner can detect the optimal pattern of its kind. In addition, you can switch on and off individu
250 USD
Bei diesem Indikator handelt es sich um Wimpel , bei denen es sich um Fortsetzungsmuster handelt, die durch konvergierende Trendlinien im Zusammenhang mit einer Preiskonsolidierungsperiode gekennzeichnet sind. Trades werden mit einer Breakout-Periode neben dem Formations-Breakout signalisiert. [ Installationsanleitung | Update-Anleitung | Fehlerbehebung | FAQ | Alle Produkte ] Einfach zu verwenden Anpassbare Farben und Größen Es implementiert Breakout-Signale Es implementiert Warnungen aller Ar
49 USD
ArcTracer
Syed Oarasul Islam
This Indicator draws Fibonacci Arc levels in two different ways. You can select whether to draw Fibonacci Arc levels based on your favourite ZigZag settings or you can let the indicator to draw Arc levels based on given number of bars or candles.  You can also set Mobile and Email notification for your favourite Arc levels individually. With this indicator you will not have to feel lonely as the it can generate Voice alerts, which will keep you focused on your trading and remove boredom.  Produc
60 USD
LineaMMSuavizado
Cesar Juan Flores Navarro
Se considera la secuencia de la serie Fibonacci (2,3,5,8,13) que sera multiplicado por un periodo (11 o 33 o 70 etc.), de las 5 lineas se sacara una sola que sera contendrá el máximo y mínimo de las 5, a esta linea se le aplicara un suavizador de 3....y a esta linea suavizada se le volverá a aplicar un suavizador de 3. obteniéndose 2 lineas suavizadas. A simple vista se ve las intersecciones que hacen las lineas que pueden ser usadas para comprar o vender. Cambien se puede usar con apoyo de otro
120 USD
Mean Reversion Supply Demand Indicator Mean Reversion Supply Demand is the indicator to detect the important supply demand zone in your chart. The concept of supply demand trading relies on the quantity mismatching between buying and selling volumes in the financial market. Typically, supply demand zone serves to predict the turning point. The wave pattern, for any supply demand zone to work as an successful trade, looks like the price must touch the base zone, move away and then return to zone
80 USD
Торговля пивотами: 1.pp pivot 2. r1 r2 r3, s1 s2 s3 Necessary for traders: tools and indicators Waves automatically calculate indicators, channel trend trading Perfect trend-wave automatic calculation channel calculation , MT4 Perfect trend-wave automatic calculation channel calculation , MT5 Local Trading copying Easy And Fast Copy , MT4 Easy And Fast Copy , MT5 Local Trading copying For DEMO Easy And Fast Copy , MT4 DEMO Easy And Fast Copy , MT5 DEMO Empfehlen dringend Trendindikatoren,
FREE
The indicator builds a graphical analysis based on the Fibonacci theory. Fibo Fan is used for the analysis of the impulses and corrections of the movement. Reversal lines (2 lines at the base of the Fibonacci fan) are used to analyze the direction of movements. The indicator displays the of 4 the target line in each direction. The indicator takes into account market volatility. If the price is above the reversal lines, it makes sense to consider buying, if lower, then selling. You can op
97 USD
Dies ist wahrscheinlich der vollständigste Indikator für die automatische Erkennung der harmonischen Preisbildung, den Sie für die MetaTrader-Plattform finden können. Es erkennt 19 verschiedene Muster, nimmt Fibonacci-Projektionen genauso ernst wie Sie, zeigt die potenzielle Umkehrzone (PRZ) an und findet geeignete Stop-Loss- und Take-Profit-Werte. [ Installationsanleitung | Update-Anleitung | Fehlerbehebung | FAQ | Alle Produkte ] Es erkennt 19 verschiedene harmonische Preisbildungen Dar
149 USD
The Premier League indicator links the price in a cyclical-wave relationship. Crossing points can be used as potential market reversal points. Thus, all crossing points will be optimal points at which the movement changes taking into account the indicator period. But do not forget that the approach must be complex, the indicator signals require additional information to enter the market.
79 USD
Dieser Indikator ermittelt Keile , bei denen es sich um Fortsetzungsmuster handelt, die durch konvergierende Trendlinien im Zusammenhang mit einer Preiskonsolidierungsperiode gekennzeichnet sind. Es signalisiert Trades mit einem Donchian-Breakout neben dem Formations-Breakout. [ Installationsanleitung | Update-Anleitung | Fehlerbehebung | FAQ | Alle Produkte ] Einfach zu verwenden Anpassbare Farben und Größen Es implementiert Breakout-Signale Es implementiert Warnungen aller Art Optimale Nutz
49 USD
WanaScalper
Isaac Wanasolo
1 (1)
A scalping indicator based on mathematical patterns, which on average gives signals with relatively small SL, and also occasionally helps to catch big moves in the markets (more information in the video) This indicator has three main types of notifications: The first type warns of a possible/upcoming signal on the next bar The second type indicates the presence of a ready signal to enter the market/open a position The third type is for SL and TP levels - you will be notified every time price r
1 350 USD
WAPV Weis Wave Chart Forex
Eduardo Da Costa Custodio Santos
Der Weis Wave Chart Forex für MT5 ist ein Preis- und Volumenindikator. Die Lesart von Preis und Volumen wurde durch Richard Demille Wyckoff auf der Grundlage der drei von ihm geschaffenen Gesetze verbreitet: Angebot und Nachfrage, Ursache und Wirkung und Aufwand vs. Ergebnis. Bereits 1900 verwendete R.Wyckoff das Wellendiagramm in seinen Analysen. Viele Jahre später, um 1990, automatisierte David Weis das Wellendiagramm von R. Wyckoff, und heute bringen wir Ihnen die Entwicklung des Wellendiagra
100 USD
Matreshka
Dimitr Trifonov
Matreshka self-testing and self-optimizing indicator: 1. Is an interpretation of the Elliott Wave Analysis Theory. 2. Based on the principle of the indicator type ZigZag, and the waves are based on the principle of interpretation of the theory of DeMark. 3. Filters waves in length and height. 4. Draws up to six levels of ZigZag at the same time, tracking waves of different orders. 5. Marks Pulsed and Recoil Waves. 6. Draws arrows to open positions 7. Draws three channels. 8. Notes support and re
245 USD
Good Time
Sergey Sapozhnikov
5 (1)
Indicator for Highlighting Any Time Periods such as Trade Sessions or Week Days We do we need it? Looking through the operation results of my favorite Expert Advisor in the strategy tester I noticed that most deals it opened during the Asian session were unprofitable. It would be a great idea to see it on a graph, I thought. And that was the time I bumped into the first problem - viewing only the Asian session on a chart. And hiding all the others. It is not a problem to find the work schedule o
30 USD
All Harmonics 26
Alexey Isavnin
3.8 (5)
Harmonic patterns are characteristic series of price movements with respect to Fibonacci levels, which statistically precede price reversals. This indicator searches for harmonic patterns. It is capable of recognising 26 classical and non-classical harmonic patterns : Classical Gartley Butterfly Alternate Butterfly Bat Alternate Bat Crab Deep Crab Three Drives Non-classical Shark Alternate Shark Cypher 5-0 Anti Gartley Anti Butterfly Anti Alternate Butterfly Anti Bat Anti Alternate Bat Anti Crab
90 USD
Think of an indicator that instantly shows you all supports, resistances and turncoats and can send a notification to your phone or an alarm on your computer. In addition to all these, it groups how many times it has entered each field and, accordingly, the strength of the field. Supply Demand And Turncoat is at your service. Setup for any TimeFrame and Chart you want and enjoy easy trading. Features: Ability to select the fields to be shown (weak, untested, turncoat, verified, proven) Merge fie
30 USD
Double HMA MTF for MT5
Pavel Zamoshnikov
5 (2)
This is an advanced multi-timeframe version of the popular Hull Moving Average (HMA) Features Two lines of the Hull indicator of different timeframes on the same chart. The HMA line of the higher timeframe defines the trend, and the HMA line of the current timeframe defines the short-term price movements. A graphical panel with HMA indicator data from all timeframes at the same time . If the HMA switched its direction on any timeframe, the panel displays a question or exclamation mark with a tex
30 USD
SmartFibonacci
Abdurahim Aras
Get ready to meet the smartest Fibonacci. It draws the most accurate lines and takes position in the appropriate place. He will always give you advice. Only $ 1000 Please enter recommended settings Trailing_Value: 150 Current_Value: 125 Take_Profit: 250 Stop_Loss: 250 Start_Time:09:00 Stop_Time:22:00 Fibo_Period=100 Magic_Number: 2020 Contact: arasinvestment@gmail.com Abdurahim ARAS International Trade Expert A Markets-Introductr Broker
150 USD
The   Supply and Demand Zones indicator   is one of the best tools we have ever made. This great tool automatically draws supply and demand zones, the best places for opening and closing positions. It has many advanced features such as multi timeframe zones support, displaying the width of zones, alert notifications for retouched zones, and much more. Because of market fractality, this indicator can be used for any kind of trading. Whether you are a positional, swing, or intraday trader does no
99 USD
KT Renko Patterns MT5
KEENBASE SOFTWARE SOLUTIONS
KT Renko Patterns scans the Renko chart brick by brick to find some famous chart patterns that are frequently used by traders across the various financial markets. Compared to the time-based charts, patterns based trading is easier and more evident on Renko charts due to their uncluttered appearance. KT Renko Patterns features multiple Renko patterns, and many of these patterns are extensively explained in the book titled Profitable Trading with Renko Charts by Prashant Shah. A 100% automate
180 USD
FibExtender
Syed Oarasul Islam
This Indicator draws Fibonacci Extension levels in two different ways. You can select whether to draw Fibonacci Extension levels based on your favourite ZigZag settings or you can let the indicator to draw Fibonacci Extension  level based on given number of Bars or Candles.  You can also set Mobile and Email notification for your favourite Extension  levels individually. With this indicator you will not have to feel lonely as the it can generate Voice alerts, which will keep you focused on your
60 USD
"The trend is your friend" is one of the best known sayings in investing, because capturing large trendy price movements can be extremely profitable. However, trading with the trend is often easier said than done, because many indicators are based on price reversals not trends. These aren't very effective at identifying trendy periods, or predicting whether trends will continue. We developed the Trendiness Index to help address this problem by indicating the strength and direction of price trend
49 USD
KDJ Index 4   交易实用必备工具指标 波浪自动计算指标,通道趋势交易 完美的趋势-波浪自动计算通道计算 , MT4版本 完美的趋势-波浪自动计算通道计算 , MT5版本 本地跟单复制交易 Easy And Fast Copy , MT4版本 Easy And Fast Copy , MT5版本 本地跟单复制交易 模拟试用 Easy And Fast Copy , MT4 模拟账号运行 Easy And Fast Copy , MT5 模拟账号运行 "Cooperative QQ:556024  "  "Cooperation wechat:556024"  "Cooperative email:556024@qq.com" 强烈推荐趋势指标, 波浪的标准自动计算   和   波浪的标准自动计算MT5版本     KDJ指标又叫 随机指标 ,是一种相当新颖、实用的技术分析指标,它起先用于期货市场的分析,后被广泛用于股市的中短期趋势分析,是期货和股票市场上最常用的技术分析工具。 随机指标KDJ一般是用于股票分析的统计体系,根据统计学原理,通过一个特定的周期(常为9日、9周等
30 USD
MultiFiboDynamic
Andrey Spiridonov
4 (3)
MultiFiboDynamic is a powerful, professional indicator for estimating the most important support and resistance levels. The main advantage is that it plots the Fibonacci levels at all timeframes simultaneously, which allows the trader to see the full picture of the possible price movement of the trading instrument! Advantages of the indicator The indicator is perfect for scalping and trading binary options. Suitable for beginners and experienced traders. Works on all timeframes. Works on any f
FREE
Käufer dieses Produkts erwarben auch
Gold Stuff mt5
Vasiliy Strukov
4.97 (89)
Gold Stuff mt5-Ein Trendindikator, der speziell für Gold entwickelt wurde, kann auch auf allen Finanzinstrumenten verwendet werden. Der Indikator wird nicht neu gezeichnet und verzögert sich nicht. Empfohlener Zeitrahmen H1. WICHTIG! Kontaktieren Sie mich sofort nach dem Kauf, um Anweisungen und Bonus zu erhalten! DATEN Draw Arrow - inkl.aus. zeichnen von Pfeilen in einem Diagramm. Alerts-inkl.aus.akustische Warnungen. E - mail notification-inkl.aus. benachrichtigungen per E-Mail. Puch-
50 USD
Trend Screener Pro MT5
STE S.S.COMPANY
4.97 (35)
Trendindikator, bahnbrechende, einzigartige Lösung für Trendhandel und -filterung mit allen wichtigen Trendfunktionen in einem Tool! Es handelt sich um einen 100 % nicht neu zu malenden Multi-Timeframe- und Multi-Währungs-Indikator, der für alle Symbole/Instrumente verwendet werden kann: Forex, Rohstoffe, Kryptowährungen, Indizes und Aktien. Trend Screener ist ein effizienter Trendfolgeindikator, der Pfeiltrendsignale mit Punkten im Diagramm liefert. Die Funktionen, die im Trendanalysator-Indika
50 USD
Dies ist ein Indikator für MT5, der genaue Signale für den Einstieg in einen Handel ohne Repainting (Neuzeichnen) liefert. Er kann auf alle Finanzwerte angewendet werden: Forex, Kryptowährungen, Metalle, Aktien, Indizes. Er liefert ziemlich genaue Schätzungen und sagt Ihnen, wann es am besten ist, eine Position zu eröffnen und zu schließen. Sehen Sie sich das Video (6:22) mit einem Beispiel für die Verarbeitung nur eines Signals an, das sich für den Indikator gelohnt hat! Die meisten Händler ver
125 USD
ICT, SMC, SMART MONEY CONCEPTS, SMART MONEY, Smart Money Concept, Support and Resistance, Trend Analysis, Price Action, Market Structure, Order Blocks, BOS/CHoCH,   Momentum Shift, HH/LL/HL/LH,    Fair Value Gap, FVG,  Premium  &   Discount   Zones, Fibonacci Retracement, OTE, Buy Side Liquidity, Sell Side Liquidity, BSL/SSL Taken, Equal Highs & Lows, MTF, Multiple Time Frame, BigBar, HTF OB, HTF Market Structure,  Liquidity Voids, Long Wicks, Candle Timer, Fractals, ZigZag, Time Zone, Market S
60 USD
Advanced Supply Demand MT5
Bernhard Schweigert
4.36 (11)
Derzeit 33% Rabatt! Die beste Lösung für jeden Anfänger oder erfahrenen Händler! Dieser Indikator ist ein einzigartiges, qualitativ hochwertiges und erschwingliches Trading-Tool, da wir eine Reihe von proprietären Funktionen und eine neue Formel integriert haben. Mit diesem Update werden Sie in der Lage sein, doppelte Zeitrahmenzonen anzuzeigen. Sie können nicht nur einen höheren TF (Zeitrahmen) anzeigen, sondern sowohl den Chart-TF als auch den höheren TF: SHOWING NESTED ZONES. Alle Supply Dema
199 USD
Royal Scalping Indicator M5
Vahidreza Heidar Gholami
5 (8)
Royal Scalping Indicator is an advanced price adaptive indicator designed to generate high-quality trading signals. Built-in multi-timeframe and multi-currency capabilities make it even more powerful to have configurations based on different symbols and timeframes. This indicator is perfect for scalp trades as well as swing trades. Royal Scalping is not just an indicator, but a trading strategy itself. Features Price Adaptive Trend Detector Algorithm Multi-Timeframe and Multi-Currency Trend Low
149 USD
Werden Sie Breaker Trader und profitieren Sie von Änderungen der Marktstruktur, wenn sich der Preis umkehrt. Der Order Block Breaker Indikator zeigt an, wann sich eine Trend- oder Preisbewegung der Erschöpfung nähert und bereit ist, sich umzukehren. Es weist Sie auf Änderungen in der Marktstruktur hin, die normalerweise auftreten, wenn eine Umkehrung oder ein größerer Rückzug bevorsteht. Der Indikator verwendet eine proprietäre Berechnung, die Ausbrüche und Preisdynamik identifiziert. Jedes
49 USD
Royal Wave Pro M5
Vahidreza Heidar Gholami
5 (2)
Royal Wave is a Trend-Power oscillator which has been programmed to locate and signal low-risk entry and exit zones. Its core algorithm statistically analyzes the market and generates trading signals for overbought, oversold and low volatile areas. By using a well-designed alerting system, this indicator makes it easier to make proper decisions regarding where to enter and where to exit trades. Features Trend-Power Algorithm Low risk Entry Zones and Exit Zones Predictions for Overbought and Over
129 USD
Matrix Arrow Indicator MT5
Juvenille Emperor Limited
5 (11)
Matrix Arrow Indicator MT5   ist ein einzigartiger 10-in-1-Trend, der zu   100 % nicht neu gezeichnet   werden kann. Multi-Timeframe-Indikator, der für alle Symbole/Instrumente verwendet werden kann:   Forex ,   Rohstoffe ,   Kryptowährungen ,   Indizes ,   Aktien .  Der  Matrix Arrow Indicator MT5  wird den aktuellen Trend in seinen frühen Stadien bestimmen und Informationen und Daten von bis zu 10 Standardindikatoren sammeln, die sind: Durchschnittlicher Richtungsbewegungsindex (ADX) Rohstoff
75 USD
Trend Scanner mt5 GS
Vasiliy Strukov
5 (5)
Trend Scanner scannt Markttrends aus Multi-Symbolen und Multi-Time-Frames und zeigt sie auf einem beweglichen Panel auf dem Chart an, den er zur Analyse verwendet. Der Händler kann mehrere Paare seiner Wahl zur Anzeige auswählen. Trend Scanner ist ein großartiges Tool, um die Richtung des Trends zu sehen, und kann für den manuellen Handel oder den EA-Handel verwendet werden, indem nur Kauf- oder Verkaufsaufträge gemäß dem Trend zugelassen werden. Echtzeit-Ergebnisse können hier eingesehen wer
50 USD
Der ADR-Umkehrindikator zeigt Ihnen auf einen Blick, wo der Preis derzeit im Verhältnis zu seiner normalen durchschnittlichen Tagesspanne gehandelt wird. Sie erhalten sofortige Benachrichtigungen per Pop-up, E-Mail oder Push, wenn der Preis seine durchschnittliche Spanne und darüber liegende Niveaus Ihrer Wahl überschreitet, sodass Sie schnell in Pullbacks und Umkehrungen einsteigen können. Der Indikator zeichnet horizontale Linien auf dem Chart an den durchschnittlichen täglichen Range-Extreme
49 USD
Dieses Dashboard ist ein Warntool zur Verwendung mit dem Indikator für die Umkehrung der Marktstruktur. Sein Hauptzweck besteht darin, Sie auf Umkehrmöglichkeiten in bestimmten Zeitrahmen und auch auf die erneuten Tests der Warnungen (Bestätigung) aufmerksam zu machen, wie es der Indikator tut. Das Dashboard ist so konzipiert, dass es auf einem eigenen Chart sitzt und im Hintergrund arbeitet, um Ihnen Benachrichtigungen zu Ihren ausgewählten Paaren und Zeitrahmen zu senden. Es wurde entwickelt,
49 USD
AW Trend Predictor MT5
Alexander Nechaev
5 (23)
Die Kombination von Trend- und Aufschlüsselungsebenen in einem System. Ein fortschrittlicher Indikatoralgorithmus filtert Marktrauschen, bestimmt den Trend, Einstiegspunkte sowie mögliche Ausstiegsniveaus. Indikatorsignale werden in einem Statistikmodul aufgezeichnet, das es Ihnen ermöglicht, die am besten geeigneten Tools auszuwählen, die die Wirksamkeit der Signalhistorie zeigen. Der Indikator berechnet Take-Profit- und Stop-Loss-Marken. Handbuch und Anleitung ->   HIER   / MT4-Version ->   H
55 USD
Owl Smart Levels MT5
Sergey Ermolov
5 (1)
Indikator-Leitfaden  |  Owl Smart Levels-Strategie  |   MT4-Version  |  Wie installiert man?   |   FAQ Der Owl Smart Levels Indikator ist ein komplettes Handelssystem innerhalb eines Indikators, der so beliebte Marktanalysetools wie die fortschrittlichen Fraktale von Bill Williams , Valable ZigZag, das die richtige Wellenstruktur des Marktes aufbaut, und Fibonacci-Levels , die die genauen Einstiegslevels markieren, enthält in den Markt und Orte, um Gewinne mitzunehmen. 7 tage Promotion - bis zu
92 USD
Stargogs Spike Catcher
Lorenzo Edward Beukes
5 (6)
Stargogs Spike Catcher V3 This Indicator is Developed To milk the BOOM and CRASH indices . Send me Message if you need any help with the indicator.  CHECK OUT THE STARGOGS SPIKE CATCHER EA/ROBOT V3: CLICK HERE ALSO CHECK OUT SECOND TO NONEFX SPIKE CATCHER:   CLICK HERE STARGOGS SPIKE CATCHER V3 WHATS NEW! Brand New Strategy. This is the Indicator you need for 2023. The Indicator Gives you an Entry at a time when conditions are met and you should use TP & SL. New Trendline that changes color in
100 USD
Blahtech Supply Demand MT5
Blahtech Limited
4.45 (11)
Supply Demand uses previous price action to identify potential imbalances between buyers and sellers. The key is to identify the better odds zones, not just the untouched ones. Blahtech Supply Demand indicator delivers functionality previously unavailable on any trading platform. This 4-in-1 indicator not only highlights the higher probability zones using a multi-criteria strength engine, but also combines it with multi-timeframe trend analysis, previously confirmed swings and engulfing detecto
142 USD
Support And Resistance Screener ist ein Level-Indikator für MetaTrader, der mehrere Tools innerhalb eines Indikators bietet. Die verfügbaren Werkzeuge sind: 1. Marktstruktur-Screener. 2. Bullische Pullback-Zone. 3. Bärische Pullback-Zone. 4. Tägliche Pivot-Punkte 5. wöchentliche Pivots-Punkte 6. monatliche Pivots-Punkte 7. Starke Unterstützung und Widerstand basierend auf harmonischem Muster und Volumen. 8. Zonen auf Bankebene. ZEITLICH BEGRENZTES ANGEBOT: HV Support and Resistance Indicator ist
50 USD
** All Symbols x All Timeframes scan just by pressing scanner button ** *** Contact me after the purchase to send you instructions and add you in "ABCD scanner group" for sharing or seeing experiences with other users. Introduction This indicator scans AB=CD retracement patterns in all charts. The ABCD is the basic foundation for all harmonic patterns and highly repetitive with a high success rate . The ABCD Scanner indicator is a scanner reversal ABCD pattern that helps you identify when the pr
39 USD
Market Structure MT5
Reza Aghajanpour
5 (1)
**   All Symbols   x   All Timeframes   scan just by pressing scanner button ** *** Contact me immediately after the purchase to send you instructions and add you in "Market Structure group" for sharing or seeing experiences with other users. CURRENT PRICE $39..... Future Price $200 Introduction: Market structure is important for both new and professional traders since it can influence the liquidity and price action of a market. It’s also one of the most commonly used techniques to understand tr
39 USD
Das RSI / TDI-Warnungs-Dashboard ermöglicht es Ihnen, RSIs (von Ihnen wählbar) für jedes wichtige Paar, das Sie handeln, sofort zu überwachen. Sie können es auf zwei Arten verwenden: 1. Wählen Sie mehrere Zeitrahmen aus und der Strich zeigt Ihnen, wenn es mehrere Zeitrahmen gibt, die über die normalen Handelsbedingungen hinausgehen. Ein großartiger Indikator dafür, dass der Preis in letzter Zeit stark nach oben gedrückt hat, da er über mehrere Zeiträume hinweg ein überkauftes oder überver
49 USD
Strong Support mt5
Vasiliy Strukov
5 (5)
Unterstützungs- und Widerstandsniveaus sind seit langem ein mächtiges Werkzeug für die Marktanalyse. Der Strong Support Indikator baut Unterstützungsniveaus auf lokalen Preistiefs und Widerstandsniveaus auf lokalen Preishochs auf. Meine anderen Entwicklungen finden Sie hier Es wird empfohlen, in Verbindung mit einem Trendindikator wie Gold Stuff zu verwenden, um den Trend zu handeln und gleichzeitig Konsolidierungs- oder Umkehrzonen zu definieren sowie Stop-Loss und Take-Profit auf Unterstü
50 USD
PZ Trend Trading MT5
PZ TRADING SLU
3.25 (4)
Trend Trading ist ein Indikator, der so weit wie möglich von den Markttrends profitiert, indem er Pullbacks und Breakouts zeitlich festlegt. Sie findet Handelsmöglichkeiten, indem sie analysiert, was der Preis während etablierter Trends tut. [ Installationsanleitung | Update-Anleitung | Fehlerbehebung | FAQ | Alle Produkte ] Handeln Sie mit Zuversicht und Effizienz an den Finanzmärkten Profitieren Sie von etablierten Trends, ohne ins Wanken zu geraten Profitable Pullbacks, Ausbrüche und vor
125 USD
Sind Sie es leid, Unterstützungs- und Widerstandslinien zu zeichnen? Der Unterstützungswiderstand ist ein Multi-Zeitrahmen-Indikator, der Unterstützungs- und Widerstandslinien mit einer sehr interessanten Wendung automatisch erkennt und zeichnet: Wenn das Preisniveau im Laufe der Zeit getestet wird und seine Bedeutung zunimmt, werden die Linien dicker und dunkler. [ Installationsanleitung | Update-Anleitung | Fehlerbehebung | FAQ | Alle Produkte ] Steigern Sie Ihre technische Analyse über Nacht
99 USD
Market Profile defines a number of day types that can help the trader to determine market behaviour. A key feature is the Value Area, representing the range of price action where 70% of trading took place. Understanding the Value Area can give traders valuable insight into market direction and establish the higher odds trade. It is an excellent addition to any system you may be using. Blahtech Limited presents their Market Profile indicator for the MetaTrader community. Inspired by Jim Dalton’s
142 USD
Der Forex TPA Indikator deckt die wahren Aktionen der Marktmacher auf, immer dann wenn sie passieren. "Kämpfe nicht gegen die Marktmacher an, sondern folge ihnen", ist wohl der beste Rat, den ein Trader bekommen kann. Der TPA Indikator zeigt jedesmal seine Signale an wenn die Bullen definitiv stärker sind als die Bären und umgekehrt. Dieser Indikator wurde VON Tradern FÜR Trader gemacht und ist 100% NICHT NACHZEICHNEND! Signale werden STRENG am Schluss einer Kerze  generiert. Das sagen unsere Ku
168 USD
Die beste Lösung für jeden Newbie oder Expert Trader! Dieser Indikator ist ein einzigartiges, qualitativ hochwertiges und erschwingliches Trading-Tool, da wir eine Reihe von proprietären Funktionen und eine neue Formel integriert haben. Mit nur EINEM Chart können Sie die Währungsstärke für 28 Forex-Paare ablesen! Stellen Sie sich vor, wie sich Ihr Handel verbessern wird, weil Sie in der Lage sind, den genauen Auslösungspunkt eines neuen Trends oder einer Scalping-Gelegenheit zu erkennen. Be
128 USD
** All Symbols x All Timeframes scan just by pressing scanner button ** ***Contact me after purchase to send you instructions and add you in "123 scanner group" for sharing or seeing experiences with other users. After 15 years of experience in the markets and 3 years of programming, Winner indicator is ready. I would like to share with you! Introduction The 123 Pattern Scanner indicator with a special enhanced algorithm is a very repetitive common pattern finder with a high success rate . Inte
39 USD
Italo Volume Indicator MT5
Italo Santana Gomes
5 (9)
BUY INDICATOR AND GET EA FOR FREE AS A BONUS + SOME OTHER GIFTS! ITALO VOLUME INDICATOR  is the best volume indicator ever created, and why is that? The Indicator works on all time-frames and assets, indicator built after 6 years of experience on forex and many other markets. You know many volume indicators around the internet are not complete, does not help, and it's difficult to trade, but the Italo Volume Indicator is different , the Italo Volume Indicator shows the wave volume, when market
65 USD
MACD Intraday Trend PRO ist ein Indikator, der durch eine Adaption des ursprünglichen MACD von Gerald Appel in den 1960er Jahren entwickelt wurde. Im Laufe der Jahre des Handels wurde beobachtet, dass wir durch die Änderung der Parameter des MACD mit Fibonacci-Proportionen eine bessere Darstellung der Kontinuität der Trendbewegungen erreichen, wodurch es möglich ist, den Beginn und das Ende eines Preistrends effizienter zu erkennen. Aufgrund seiner Effizienz bei der Erkennung von Kurstrends
77 USD
**   All Symbols   x   All Timeframes   scan just by pressing scanner button ** *** Contact me after the purchase to send you instructions and add you in "Order Block group" for sharing or seeing experiences with other users. CURRENT PRICE $39..... Future Price $200 Introduction: The central banks and financial institutions mainly drive the market,   Order block is considered a market behavior that indicates accumulation of orders from banks and institutions, then   the market tends to make a sh
39 USD
Weitere Produkte dieses Autors
Current Price $30 Minimum Possible  BUT   Future Price   $199 ! YES, It Can be used on All Markets and All Timeframes. The  MT5 Version here:    https://www.mql5.com/en/market/product/78559?source=Site +Profile+Seller For   Support   And To get   FREE Book   On how to Use this Indicator Join Telegram: :  https://t.me/dubaiforexgroup What's Support Resistance Levels Finder? Its an Indicator that uses complex Algorithm with a very smart formula, to calculate the historical levels of Support and
30 USD
Current Price $30 Minimum Possible BUT  Future Price $89! YES, It Can be used on All Markets and All Timeframes. The  MT5 Version here:  https://www.mql5.com/en/market/product/82822?source=Site +Profile+Seller For   Support   And To get   FREE Book   On how to Use this Indicator Join Telegram:   :  https://t.me/dubaiforexgroup What's The Trend Finder Multi Timeframes?   Its an Indicator that uses complex Algorithm with a very smart formula, combining Structure with average true range and moving
30 USD
This Tool is 100% Better Than the Tradingview Risk/Reward tool! And YES It works on All Markets! What is The Risk to Reward Ratio Tool? The risk/reward ratio measures the difference between a trade entry point to a stop-loss and a sell or take-profit order. Comparing these two provides the ratio of profit to loss, or reward to risk. You might already be Familiar with the Trading view risk/reward tool, Well our Tool can do better than that, Because our Risk To Reward Ratio Tool can do all of the
30 USD
Current Price $30 Minimum Possible BUT  Future Price $89! YES, It Can be used on All Markets and All Timeframes. The  MT5 Version here:    https://www.mql5.com/en/market/product/78564?source=Site +Profile+Seller For   Support   And To get   FREE Book   On how to Use this Indicator Join Telegram:   :  https://t.me/dubaiforexgroup What is Candle Stick Patterns Finder? Its a Complex Algorithm that calculates and detect the historical and current Candle Stick Patterns using a very smart formula and
30 USD
Current Price $30 Minimum Possible BUT Future Price $199! YES, It Can be used on All Markets and All Timeframes. The  MT4 Version here:  https://www.mql5.com/en/market/product/77944?source=Site +Profile+Seller For   Support   And To get   FREE Book   On how to Use this Indicator Join Telegram :  https://t.me/dubaiforexgroup What's Support Resistance Levels Finder? Its an Indicator that uses complex Algorithm with a very smart formula, to calculate the historical levels of Support and Resistance
30 USD
Current Price $30 Minimum Possible BUT  Future Price $89! YES, It Can be used on All Markets and All Timeframes. The  MT4 Version here:  https://www.mql5.com/en/market/product/82214?source=Site +Profile+Seller For   Support   And To get   FREE Book   On how to Use this Indicator Join Telegram:   :  https://t.me/dubaiforexgroup What's The Trend Finder Multi Timeframes?   Its an Indicator that uses complex Algorithm with a very smart formula, combining Structure with average true range and moving
30 USD
Current Price $30 Minimum Possible BUT Future Price $89! YES, It Can be used on All Markets and All Timeframes. The MT4 Version is Here:   https://www.mql5.com/en/market/product/90162?source=Site +Market+Product+Page For Support Join Telegram:   https://t.me/dubaiforexgroup What is VWAP Indicator Strategy? VWAP Indicator Strategy is a Pure Price Action Strategy that uses Structure and Support and Resistance Levels to follow Trend, Used by a lot of Pro Traders All around the world. The Concept be
30 USD
Current Price $30 Minimum Possible  BUT   Future Price   $100 ! YES, It Can be used on All Markets and All Timeframes. The MT5 Version is Here:  https://www.mql5.com/en/market/product/89028?source=Site +Profile+Seller For Support Join Telegram:  https://t.me/dubaiforexgroup What is 123 Pattern Strategy? 123 pattern Strategy is a Pure Price Action Strategy that does not use any technical indicators, It’s a simple Pattern But Yet very Powerful, Used by a lot of Pro Traders All around the world.
30 USD
RSI Crossover alert Indicator:  is an indicator that calculates the Precise Entry and Exits for your strategy, using an automated Complex algorithm to alert you at the crossing of the price and the RSI lines. My mission is to help you become a       Professional Trader , In the      shortest period of time  possible, by giving you a complete      FREE Trading system , This system has 3  Main strategies  Moving average Strategy ,   Support and Resistance with Candlestick Strategy  and  MACD Stra
FREE
Please Leave a 5 Stars Rating I am sure you will like it 100% This indicator is intended to forex day traders which can be used on MT5 platform: 1- Live spread indication on the screen:   * Help avoid  taking trades on pairs with large spread.   * Help also exposing your broker spread and if the spread is to high maybe its time to find another broker. 2- Live candle count down on all time frames and all currency pairs:    * Precise timing of the entries for example if you enter trades
FREE
Current Price $30 Minimum Possible BUT  Future Price $89! YES, It Can be used on All Markets and All Timeframes. The  MT5 Version here:   https://www.mql5.com/en/market/product/78567?source=Site +Profile+Seller For Support And To get FREE Book On how to Use this Indicator Join Telegram:  https://t.me/dubaiforexgroup What's MACD Lines Crossover alert Indicator? Its an indicator that calculates the Precise Entry and Exits for your strategy, using an automated algorithm to alert you with crossing
30 USD
Current Price $30 Minimum Possible BUT Future Price $89! YES, It Can be used on All Markets and All Timeframes. The MT5 Version is Here:  https://www.mql5.com/en/market/product/90164?source=Site +Profile+Seller For Support Join Telegram: https://t.me/dubaiforexgroup What is VWAP Indicator Strategy? VWAP Indicator Strategy is a Pure Price Action Strategy that uses Structure and Support and Resistance Levels to follow Trend, Used by a lot of Pro Traders All around the world. The Concept behind th
30 USD
Current Price $30 Minimum Possible BUT  Future Price $89! YES, It Can be used on All Markets and All Timeframes. The  MT5 Version here:    https://www.mql5.com/en/market/product/78635?source=Site +Profile+Seller For   Support   And To get   FREE Book   On how to Use this Indicator Join Telegram:   :  https://t.me/dubaiforexgroup Moving Average Lines Crossover alert Indicator? Its an indicator that calculates the Precise Entry and Exits for your strategy, using an automated Complex algorithm to a
30 USD
Current Price $30 Minimum Possible BUT  Future Price $90! YES, It Can be used on All Markets and All Timeframes. The  MT4 Version here: Coming Soon... For   Support   And To get   FREE Book   On how to Use this Indicator Join Telegram:   :  https://t.me/dubaiforexgroup What is The Trend Finder Multi Timeframes? It‘s an Indicator that uses a complex Algorithm with a very smart formula, combining Structure with average true range and moving averages to find the best accurate trends on All Markets
30 USD
Current Price $30 Minimum Possible BUT  Future Price $89! YES, It Can be used on All Markets and All Timeframes. The  MT4 Version here:     https://www.mql5.com/en/market/product/77989?source=Site +Profile+Seller For   Support   And To get   FREE Book   On how to Use this Indicator Join Telegram:  https://t.me/dubaiforexgroup What's MACD Lines Crossover alert Indicator? Its an indicator that calculates the Precise Entry and Exits for your strategy, using an automated algorithm to alert you with
30 USD
All the tools that i have in my account are dedicated for day trading and they are all free. Please give the tool 5 stars rating i am sure you will like it 100% This is an Alert panel which will alerts you by pop up in the screen of the chart or by phone notification and also by Email if you wish. Its very easy to use just select the line that you want above or below the current price drag it to the level u wish and check the type of notification you wish to get. once the price reaches the level
FREE
This Tool is 100% Better Than the TradingView Risk/Reward tool! And YES It works on All Markets! What is The Risk to Reward Ratio Tool? The risk/reward ratio measures the difference between a trade entry point to a stop-loss and a sell or take-profit order. Comparing these two provides the ratio of profit to loss, or reward to risk. You might already be Familiar with the Trading view risk/reward tool, Well our Tool can do better than that, Because our Risk To Reward Ratio Tool can do all of the
30 USD
Current Price $30 Minimum Possible BUT  Future Price $89! YES, It Can be used on All Markets and All Timeframes. The  MT4 Version here:  https://www.mql5.com/en/market/product/77949?source=Site +Profile+Seller For   Support   And To get   FREE Book   On how to Use this Indicator Join Telegram:   :  https://t.me/dubaiforexgroup What is Candle Stick Patterns Finder? Its a Complex Algorithm that calculates and detect the historical and current Candle Stick Patterns using a very smart formula and d
30 USD
What is The Currency Strength Meter? It's a unique Algorithm that measures the strength of each one of the 8 major currencies Individually, and provides you with an easy to understand visual Indication in the form of a well organised table. How Much Does it Cost? The Lowest Price that Any Indicator on MQL5 Site can Cost is $30 Of Which they will Take 20%! So basically the cost is Minimum Possible! Knowing the The Right Pricing of this Indicator can go up to $90 .. (Will It be changed to $90 in
30 USD
All the tools that i have in my account are dedicated for day trading and they are all free. Please give the tool 5 stars rating i am sure you will like it 100% This is an Alert panel which will alerts you by pop up in the screen of the chart or by phone notification and also by Email if you wish. Its very easy to use just select the line that you want above or below the current price drag it to the level u wish and check the type of notification you wish to get. once the price reaches the level
FREE
This indicator will show you the tp and sl values in dollars and in pips on mt4 platform. very useful to know how much money you will win or lose. just drug it into the chart and it will be loaded and run on the open of trades. Please Leave a 5 Stars Rating I am sure you will like it 100% dont forget to rate me as well  check the rest of the free indicators, most of these indicators are for day tradind.
FREE
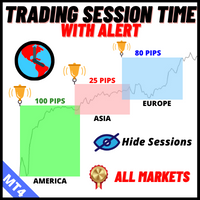
What is The Trading Session Time with Alert? Its A Visual Representation of the market session, Along with the number of Pips gained during the sessions and also offers you the possibility to alert you before every session start, The Algorithm is made for Serious trading who like to organize their trading, This Algorithm is enhanced and easily costumed, and you can even control to show only one session or two depends on your interest.  How Much Does it Cost? The Lowest Price that Any Indicator
30 USD
All the tools that I have in my account are dedicated for day trading and they are all free. Please give the tool 5 stars rating I am sure you will like it 100% This indicator has 5 EMA and a show and hide indicator button. very useful if you working with other indicators at the same time  hope you all the best please do check the rest of the tools that I have in here and rate me 5 stars ;)
FREE
All the tools that I have in my account are dedicated for day trading and they are all free. Please give the tool 5 stars rating I am sure you will like it 100% Spread - displays current spread in the chart window. Get Alert when the spread is higher than certain value. keep an open eye on the spread. please do check the rest of the tools that I have in here and rate me 5 stars ;)
FREE
Current Price $30 Minimum Possible BUT  Future Price $89! YES, It Can be used on All Markets and All Timeframes. The  MT4 Version here:  https://www.mql5.com/en/market/product/78637?source=Site +Profile+Seller For   Support   And To get   FREE Book   On how to Use this Indicator Join Telegram:   :  https://t.me/dubaiforexgroup Moving Average Lines Crossover alert Indicator? Its an indicator that calculates the Precise Entry and Exits for your strategy, using an automated Complex algorithm to ale
30 USD
What is The Trading Session Time with Alert? Its A Visual Representation of the market session, Along with the number of Pips gained during the sessions and also offers you the possibility to alert you before every session start, The Algorithm is made for Serious trading who like to organize their trading, This Algorithm is enhanced and easily costumed, and you can even control to show only one session or two depends on your interest.  How Much Does it Cost? The Lowest Price that Any Indicato
30 USD
Please Leave a 5 Stars Rating I am sure you will like it 100% Live Account Report Statistics this will show you complete trading report with out the need to go the history this indicator will open in separate window just below the chart you can use the minimize button to hide it and you can maximize as you wish it has a calculate button to use in case you like to refresh the report you can use only one box to get full trading activity report you can change the colors of the txt to any color in t
FREE
All the tools that I have in my account are dedicated for day trading and they are all free. Please give the tool 5 stars rating I am sure you will like it 100% Spread - displays current spread in the chart window. Get Alert when the spread is higher than certain value. keep an open eye on the spread. please do check the rest of the tools that I have in here and rate me 5 stars ;)
FREE
Moving Average Price Crossover alert Indicator:  is an indicator that calculates the Precise Entry and Exits for your strategy, using an automated Complex algorithm to alert you at the crossing of the price and the moving average line. My mission is to help you become a       Professional Trader , In the       shortest period of time  possible, by giving you a complete       FREE Trading system , This system has 3  Main strategies  Moving average Strategy ,    Support and Resistance with Candle
30 USD
RSI Crossover alert Indicator:  is an indicator that calculates the Precise Entry and Exits for your strategy, using an automated Complex algorithm to alert you at the crossing of the price and the RSI lines. My mission is to help you become a      Professional Trader , In the     shortest period of time  possible, by giving you a complete     FREE Trading system , This system has 3  Main strategies  Moving average Strategy ,   Support and Resistance with Candlestick Strategy  and  MACD Strateg
30 USD
Auswahl:
marcofi
86
marcofi 2023.01.11 15:15 
 

slow indicator on the chart, delaying price data when plotted on the chart

Issam Kassas
29820
Antwort vom Entwickler Issam Kassas 2023.01.11 17:31
I would say it gas to do with your computer power, Analysing the chart and looking for such kind of data and drawing the whole set ups will definitely take a lot of processing power from ur computer. So I would suggest that u use it on much powerful computer.
Or decrease the number of bars scanned at least to get it Analyse less data and make it faster.
On my computer even with 10000 bars it's working fast with no issues whatsoever!
nolimitzfx
113
nolimitzfx 2022.12.18 20:06 
 

Based on what I see on my charts it looks very solid. Remember it does what it is supposed to do - find the 123 pattern - NOW how much knowledge in general you have about trading, chart reading, support - resistance, candle patterns, chart patterns ect will determine if you can use this (or any indicator) to profitability. There is no win all trades indicator. I bought this and it does work. If you have experience with the 123 pattern and are well versed at trading you will like this indicator as well. Good job to the creator!

faithdefender
1480
faithdefender 2022.12.17 01:27 
 

Very dissapointed in this indicator so far. I give it a three only because the price was fair. However, trying to find trades on the MT5 was (so far) not prosperous and beneficial. For example, looking back at a past opportunity provided by the indicator, the trade was WAY out of control. The entry was @ 3978.-the stop was at 3948. and the T1 was at 3991. While the indicator did pull it off, that seems a bit too risky for R and R. . My second complaint at the moment is the indicator does not always remove from the screen. When try to remove it. The indicator is removed, but the Hide/Show 123 box is not removed. I have sent a pic to the Vendor in the comments section so he is aware. It always sucks to be the first to buy an indicator b/c you are the experiment. If things change I will update my review. To be fair, this is my 3rd 123 indicator from MQL and the other 2 were nothing to write home about. But as I said, this was priced fairly. (sort of)

Issam Kassas
29820
Antwort vom Entwickler Issam Kassas 2022.12.17 08:01
First of all!
Thank you so much for the review It means a lot for me, and thro these reviews we work together and create a better Indicators that will hopefully serve a lot of people.
Pls Give me time to address your two Concerns:
1. The Late Entry Signal.
2. The Button Removal from the chart.
-------------------------------------------------------------------------------------------------------------
1. The Late Entry Signal: I will mention here 4 important points: A. This Strategy based on the original 123 and Fibos levels: I can not by any means deviate from the original strategy, and one of the rules are Enter at the Close of the Candle after the breaking below or above point 2, with that being said I replicate the same exact scenario of real manual trading style, So if the Entery is far from the point 2 OFC the Stop loss is going to be huge, Again in a typical manual trading scenario the pro traders will just skip that one Because the RRR (Risk to Reward Ratio) is not worth it! I have mentioned this in my videos and also in the description under the Tips. B. This is not a Robot but Its an indicator: This point is very much related to the above mentioned point, the Idea of this indicator is to replicate a pro trader chart scanning (unbiased analysis) and provide it to the user on a silver plate! Just to Explain Further This is no different than any other indicator like MACD RSI MAs... It Provide you with data and its up to you to Decide to take it or not, We dont Promise Treasures and holly grills, Part of it is the bad entries that you should Simply Avoid-Skip-Ignore, Well in a Robot trading the Robot does not understand whether Its bad entry or not, In that case that would be problematic, but In our case we do know bad entry and all we have to do again is just Ignore It! C. The Take Profits Placements: The Take Profit levels By default are based on max 1:1.5 RRR (Risk to reward Ratio), this Strategy is able to Provide more than that, that's why I left the choice in the settings for the user to choose their suitable Take Profit Levels. D. This is a manual trading strategy: I cant emphasis enough on this Point, In the MACD strategies you are using the macd data to look for entries, so you dont blame the creator of the macd for the losing trades or the late signals, but instead what you do is you ignore the late signals and you take the loses in good faith, The indicator is no different, Its a tool that provide you with data, this data is exactly how a pro trader find trades using the 123 strategy+Fibos.
-------------------------------------------------------------------------------------------------------------------------------------------------------------
2. The Button removal from the chart:
This one is on me, Its my Fault and Pls Accept my apologies for that from my heart and i promise it will be solved in the next update! (this issue is only for the MT5 users, this issues does not exist in the MT4 version).
---------------------------------------------------------------------------------------------------------------------------------------------------------------- Conclusion:
As creators not only me, we are trying to provide value we have no bad intentions, totally the opposite we are trying to help you have a better trading experience, and we work really hard for that, sometimes we dont even sleep! we are honest and geniun, and we are not greedy we try to provide high quality value at the lowest Price Possible! So Pls Help us Help you But at least:
1. Understand our Products before you review us.
2. when you review us be Fair with us Pls.
Thank you!
Antwort auf eine Rezension