• Übersicht
  • Bewertungen
  • Diskussion

RaysFX ADMI

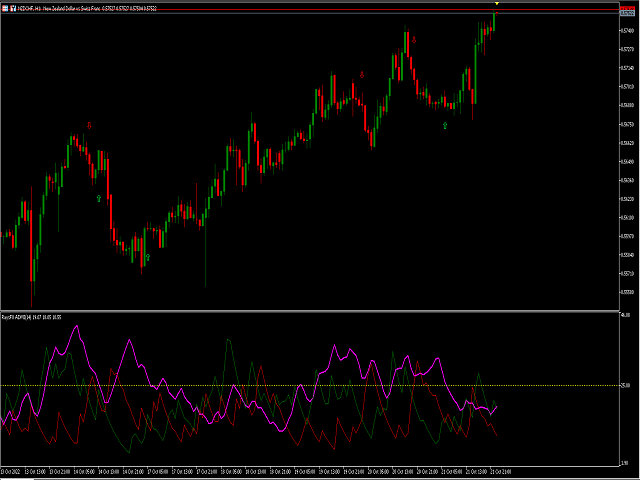
RaysFX (Average Directional Movement Index)


Technical indicator (ADX) helps to determine the market trend. It was developed and described in detail by Welles Wilder.
The simplest trading method based on the system of directional movement implies comparison of two direction indicators: the 14-period +DI one and the 14-period -DI.
To do this, one either puts the charts of indicators one on top of the other, or +DI is subtracted from -DI.
W. Wilder recommends buying whenever the +DI crosses above the -DI, and selling when -DI crosses above the +DI.
In addition to these simple commercial rules, Wells Wilder offered the extreme point rule. It is used to eliminate false signals and decrease the number of deals. According to the principle of extreme points, the "extreme point" occurs when +DI and -DI cross each other. If +DI raises higher than -DI, this point will be the maximum price of the day when they cross. If +DI is lower than -DI, this point will be the minimum price of the day they cross.
The extreme point is used then as the market entry level. Thus, after the signal to buy (+DI is above -DI) one must wait till the price exceeds the extreme point, and only then buy. However, if the price fails to exceed the level of the extreme point, one should retain the short position.


Empfohlene Produkte
Owl Smart Levels MT5
Sergey Ermolov
4.47 (36)
MT4-Version  |  FAQ Der Owl Smart Levels Indikator ist ein komplettes Handelssystem innerhalb eines Indikators, der so beliebte Marktanalysetools wie die fortschrittlichen Fraktale von Bill Williams , Valable ZigZag, das die richtige Wellenstruktur des Marktes aufbaut, und Fibonacci-Levels , die die genauen Einstiegslevels markieren, enthält in den Markt und Orte, um Gewinne mitzunehmen. Detaillierte Strategiebeschreibung Anleitung zur Verwendung des Indikators Berater-Assistent im Handel Owl H
Little Swinger    (Best choice for passive income lovers) Developed by RobotechTrading   key features: Financial Freedom Back testing results will match with real live trading results Proper TP and SL Controlled Risk Highly Optimized settings Running on our Real Live Accounts Little Risk, Little Drawdown, Little Stress, Little BUT stable income, just set and forget. Strategy: Not Indicator based No Martingale  No Grid  No Repaint strategy Safe and Secure calculation of Live data and than t
Indicador que calcula o volume real e a porcentagem da agressão vencedora num determinado período de tempo. Podendo o usuário escolher entre as opções : 3 vezes por segundo ; 2 vezes por segundo ; 1 vez por segundo ; 1 vez a cada 2 segundos ; Exemplo 1: Se o usuário optar pela opção 2 vezes por segundo, o indicador vai mostrar na tela 2 vezes em um segundo a quantidade de contratos negociados (volume real) e quantos por cento a agressão vencedora foi superior a perdedora nesse período. Ou seja,
One of the most famous phrases in the trading world is "The Trend Is Your Friend". Trading following the current trend is one of the most successful ways in terms of probability. The hard part of it is to recognize when the market is trending or not. that's the role of our indicator we called The Trend Is Your Friend Until It Is Not. Apart from its big name it is really easy to use and see when the market is trending or ranging. Through a little window of 3 colors you will identify if the ma
Point Black
Ignacio Agustin Mene Franco
Black Card Pack indicator 5/1 point black It has the strategy of professional bollingers where each arrow gives you a different entry signal. It is used to operate in m1 and in d1 It is used for scalping and intraday, modified for forex markets ! suitable for all pairs modified for synthetic index markets suitable for all pairs! Ideal for volatility and jumps!
Supertrend indicator uses a combination of a moving average and average true range to detect the trend of a trading instrument. Supertrend indicator for MetaTrader 5 easily shows the trend as a line following the price. Triple SuperTrend Histo indicator  calculate  three supertrends to show the trend as a histogram. Changing the color from red to green means you can BUY , from green to red means you can SELL . Description of the method of drawing a histogram. The price is above the EMA 20
Signal Noise Indicator
Alex Conselvan De Oliveira
The Signal Noise Indicator is a non-parameterized oscillator generated by high, low and close noises. Input Period: Reference period of the Low Pass Filter, used for the signal detection. Values High Noise: maximum high noise; Power High Noise: high signal strength, showed when the smallest noise occurs in the same signal direction; Low Noise: maximum low noise; Power Low Noise: low signal strength, showed when the smallest noise occurs in the same signal direction; Close Noise: noise value
Advanced Stochastic Scalper ist ein Oszillator mit dynamischen überkauften und überverkauften Niveaus, während diese Niveaus im Standard-Stochastic-Oszillator statisch sind und sich nicht ändern. Dadurch kann sich Advanced Stochastic Scalper an den sich ständig ändernden Markt anpassen. Wenn ein Kauf- oder Verkaufssignal erscheint, wird ein Pfeil auf dem Chart gezeichnet und eine Warnung ausgelöst, die es Ihnen ermöglicht, rechtzeitig eine Position zu eröffnen und nicht ständig an Ihrem PC zu s
Indicator Arrow II EA
Nikolai Starkovskii
Ich präsentiere Ihnen einen zuverlässigen Berater, der klare, transparente Signale erzeugt, die vom Pfeilindikator „Indicator Arrows II“ ( https://www.mql5.com/ru/code/12465 ) ausgehen. Laden Sie diesen Indikator von Codebase herunter und installieren Sie ihn im Ordner „Indikatoren“. Optimaler Zeitrahmen H1. Ich habe den Berater ausgestattet mit: Schutzstopps (SL/TP), der Möglichkeit des Testens mehrerer Währungen, Handel von einem Diagramm aus (geben Sie die Liste der Währungen in den Ei
FREE
Renko System
Marco Montemari
This indicator can be considered as a trading system. It offers a different view to see the currency pair: full timeless indicator, can be used for manual trading or for automatized trading with some expert advisor. When the price reaches a threshold a new block is created according to the set mode. The indicator beside the Renko bars, shows also 3 moving averages. Features renko mode median renko custom median renko 3 moving averages wicks datetime indicator for each block custom notificatio
HAshi-E ist eine verbesserte Methode zur Analyse von Heiken-Ashi-Signalen. Unterrichtung: Heiken-Ashi wird besonders für seine Fähigkeit geschätzt, kurzfristige Volatilität herauszufiltern, was es zu einem bevorzugten Instrument für die Identifizierung und Verfolgung von Trends macht. Es hilft bei der Entscheidungsfindung in Bezug auf Einstiegs- und Ausstiegspunkte und unterstützt bei der Unterscheidung zwischen falschen Signalen und echten Trendumkehrungen. Im Gegensatz zu traditionellen C
Gecko EA MT5
Profalgo Limited
5 (1)
NEW PROMO: Only a few copies copies available at 349$ Next price: 449$ Make sure to check out our " Ultimate EA combo package " in our   promo blog ! Gecko runs a simple, yet very effective, proven strategy.  It looks for important recent support and resistance levels and will trade the breakouts.  This is a "real" trading system, which means it will use a SL to protect the account.  It also means it will not use any dangerous techniques like martingale, grid or averaging down. The EA shows its
The Qv² Trend is an indicator that aims to identify trends. Buying trend signals are indicated by arrows pointing up. Selling trend signals are indicated by arrows pointing down. It can be used in all deadlines. It can be used in all pairs. I use it on the H1 with a period of 24. Important Recommendation: Make sure you trade in trend market. Good Trades, in trend market
This indicator scans the 1-3 Trendline pattern . The indicator is a 100 % non repaint low risk breakout system . The patterns are formed around swing high and swing lows which make them a low risk pattern with high reward. PATTERN BACKGROUND The 1-3 Trendline Breakout pattern is formed by four(4) points which are composed of three (3) primary points and the pattern neck. A trendline is always formed by the point 1 and the neck of the pattern . When price breaks out of the trendline formed ,
Exclusive FOREX account HEDGE FuzzyLogicTrendEA is based on fuzzy logic strategy based on  analysis 5 indicators and filters. When the EA analysis all this indicators, it decides, based on its fuzzy strategy, which trade will be better: sell or buy. As additional functions, it´s possible defines spread maximum, stop loss and others. Recomm. Symbol: EURUSD, AUDUSD, GBPUSD, NZDUSD, USDCAD, AUDCAD, EURCAD e USDJPY Recomm. timeframe: H1. Backtest were done on EURUSD, H1, 01/07/2023 - 26/0
WAPV Weis Wave Chart MT5
Eduardo Da Costa Custodio Santos
Das Weis Wave Chart für MT5 ist ein Preis- und Volumenindikator. Die Lesart von Preis und Volumen wurde durch Richard Demille Wyckoff auf der Grundlage der drei von ihm geschaffenen Gesetze verbreitet: Angebot und Nachfrage, Ursache und Wirkung und Aufwand vs. Ergebnis. Bereits 1900 verwendete R.Wyckoff das Wellendiagramm in seinen Analysen. Viele Jahre später, um 1990, automatisierte David Weis das Wellendiagramm von R. Wyckoff, und heute bringen wir Ihnen die Entwicklung des Wellendiagramms vo
Bandas Bolinger Profesional
Ignacio Agustin Mene Franco
Bolinger Professional Bands, Last indicator of the Safari Pack. in this last indicator we find a unique programming of bolinger bands where you can better catch the rebounds on the bands above and below, works for forex currency markets! synthetic index markets and also crypto! It works in all temporalities and all pairs! Good profit! World Inversor!!!!!
The indicator detects divergence signals - the divergences between the price peaks and the MACD oscillator values. The signals are displayed as arrows in the additional window and are maintained by the messages in a pop-up window, e-mails and push-notifications. The conditions which formed the signal are displayed by lines on the chart and in the indicator window. The indicator parameters MacdFast - fast MACD line period MacdSlow - slow MACD line period MacdSignal - MACD signal line period Mac
All about time and price by ICT. This indicator provides a comprehensive view of ICT killzones, Silver Bullet times, and ICT Macros, enhancing your trading experience.  In those time windows price either seeks liquidity or imbalances and you often find the most energetic price moves and turning points. Features: Automatic Adaptation: The ICT killzones intelligently adapt to the specific chart you are using. For Forex charts, it follows the ICT Forex times: In EST timezone: Session: Asia: 20h00-0
Real MACD for MT5
Steven Van Ingelgem
The built-in MACD does not properly display all the different aspects of a real MACD. These are: The difference between 2 moving averages A moving average of (1) A histogram of the difference between (1) and (2) With this indicator you can also tweak it as much as you want: Fast Period (default: 12) Slow Period (default: 26) Signal Period (default: 9) Fast MA type (default: exponential) Slow MA type (default: exponential) Signal MA type (default: exponential) Fast MA applied on (default: close)
Price Action Trender
Blessing Takura Chirewa
This robot is based on an MACD strategy for trending markets. The description of the strategy can be found on the attached youtube video. The video explains the strategy and shows a basic backtest and optimisation on a few symbols. It is advised to carry out a a backetst and optimisation of your own before using the robot. The video can be found at >> https://www.youtube.com/watch?v=wU_XCM_kV0Y&nbsp ;
this indicator works on all pairs of Binary.com. we recommend using it on the M5 and M15 timeframe. when a blue arrow appears you must take the purchase and red you sell. you will withdraw your profit at the next resistance or support zone. please use risk management. its very important! without this, you can't make money on long term. if there any question ask it. 
The indicator plots three consecutive channels by Close prices and checks if they match the scheme shown in the screenshots. The length of each channel is not fixed and is selected by the program within the range ChMin and ChMax . When the match is found, a signal is formed (an appropriately colored arrow). A possible stop loss level is displayed as a diamond. A signal may be accompanied by a pop-up window, a push notification and/or an email. The indicator works by Open prices. Parameters ChM
HiLo Activator Plus
Rodrigo Galeote
5 (1)
HiLo Activator is one of the most used indicators to determine trend. Find it here with the ability to customize period and colors. This indicator also plots up and down arrows when there is a change on the trend, indicating very strong entry and exit points. HiLo fits well to different types of periods for day trading. You can easily understand when it is time to buy or sell. It works pretty good also for other periods like daily and monthly signalizing long-term trends. The use of the indicato
Madx Cobra   Madx Cobra Indicator. Create to traders both experienced and inexperienced to use it because it is a basic indicator How to use : Setting Indicator 1. MA Fast  : Moving Average fast (10) 2. MA Slow :  Moving Average Slow control trend markets.(200) 3. ADX : Control trend(5) 4. For alert you can set to alert Next bar or instant bars.  When arrow sky blue show or arrow up, you can entry order "Buy" or "Long" and arrow red show or arrow down, you can entry order "Sell" or "Short"
MAO Trade X MT5 is an EA based on Moving Average Oscillator. Moving Average Oscillator parameters such as FastEMA, SlowEMA, MACDSMA, BuyShift, BuyValue, SellShift and SellValue can be adjusted. MAO Trade X MT5 applies BTN TECHNOLOGY's state-of-the-art intelligent technology to help you create optimal results for your trades. May your dreams come true through MAO Trade X MT5. Good luck. === Inquiries === E-Mail:support@btntechfx.com
Dieser Indikator verfolgt den Markttrend mit einer unübertroffenen Zuverlässigkeit, indem plötzliche Schwankungen und Marktgeräusche ignoriert werden. Es wurde entwickelt, um Intraday-Charts und kleine Zeitfenster im Trend zu handeln. Die Gewinnquote liegt bei 85%. [ Installationsanleitung | Update-Anleitung | Fehlerbehebung | FAQ | Alle Produkte ] Erstaunlich einfach zu handeln Finden Sie überverkaufte / überkaufte Situationen Genießen Sie jederzeit einen rauschfreien Handel Vermeiden Sie es,
Ichimoku Aiko MTF
Michael Jonah Randriamampionontsoa
Ichimoku Aiko MTF is a collection of technical indicators that show support and resistance levels, as well as momentum and trend direction. It is a multi-timeframe indicator so you don't need to change the chart timeframe when you want to see the ichimoku clouds on a higher timeframe.  eg. The chart timeframe is M15 and you want to see on the M15 timeframe chart the H1 ichimoku indicators (the ichimoku in Metatrader can't do that) that's why you need to use Ichimoku Aiko MTF.
1. What is it The classic Bollinger Bands and the Bollinger Bands indicator built into the system,  they have the same mean period and deviation period.  And the method of average is just the simple moving average method.  The deviation method used is just the standard deviation method.  All this limits our research because: Sometimes we would like to have longer period averages + shorter period deviations. Sometimes we want moving averages that are not limited to simple moving averages but als
To download MT4 version please click here . - This is the exact conversion from TradingView: "Linear Regression Candles" By "ugurvu". - The overall look of the indicator is like Heiken Ashi. - It can be used as a trend confirmation indicator to detect the right trend direction. - This indicator lets you read the buffers for Candles' OHLC. - This is a non-repaint and light processing load indicator - You can message in private chat for further changes you need. Thanks
Käufer dieses Produkts erwarben auch
Atomic Analyst MT5
Issam Kassas
4.22 (9)
Zunächst einmal ist es erwähnenswert, dass dieser Handelsindikator nicht neu malt, nicht neu zeichnet und keine Verzögerung aufweist, was ihn sowohl für manuellen als auch für Roboterhandel ideal macht. Der Atom-Analyst ist ein PA-Preisaktionsindikator, der die Stärke und das Momentum des Preises nutzt, um einen besseren Vorteil auf dem Markt zu finden. Ausgestattet mit fortschrittlichen Filtern, die helfen, Rauschen und falsche Signale zu entfernen, und das Handelspotenzial zu erhöhen. Durch
Zunächst einmal ist es wichtig zu betonen, dass dieses Handelssystem ein Nicht-Repainting-, Nicht-Redrawing- und Nicht-Verzögerungsindikator ist, was es sowohl für manuelles als auch für automatisches Trading ideal macht. Das "Smart Trend Trading System MT5" ist eine umfassende Handelslösung, die für neue und erfahrene Trader maßgeschneidert ist. Es kombiniert über 10 Premium-Indikatoren und bietet mehr als 7 robuste Handelsstrategien, was es zu einer vielseitigen Wahl für verschiedene Marktbe
Quantum Trend Sniper
Bogdan Ion Puscasu
5 (36)
Wir stellen vor       Quantum Trend Sniper Indicator   , der bahnbrechende MQL5-Indikator, der die Art und Weise, wie Sie Trendumkehrungen erkennen und handeln, verändert! Entwickelt von einem Team erfahrener Händler mit über 13 Jahren Handelserfahrung,       Quantum Trend Sniper-Indikator       wurde entwickelt, um Ihre Trading-Reise mit seiner innovativen Methode zur Identifizierung von Trendumkehrungen mit extrem hoher Genauigkeit auf ein neues Niveau zu heben. ***Kaufe Quantum Trend Snipe
Trend Screener Pro MT5
STE S.S.COMPANY
4.89 (61)
Nutzen Sie die Macht des Trendhandels mit Trend Screener Indicator: Ihrer ultimativen Trendhandelslösung, die auf Fuzzy-Logik und einem System mit mehreren Währungen basiert! Steigern Sie Ihren Trendhandel mit Trend Screener, dem revolutionären Trendindikator mit Fuzzy-Logik. Es handelt sich um einen leistungsstarken Trendfolgeindikator, der über 13 Premium-Tools und -Funktionen sowie 3 Handelsstrategien kombiniert und ihn zu einer vielseitigen Wahl macht, um Ihren Metatrader in einen Trendanaly
FX Power MT5 NG
Daniel Stein
5 (4)
Erhalten Sie Ihr tägliches Marktupdate mit Details und Screenshots über unser Morning Briefing hier auf mql5 und auf Telegram ! FX Power MT5 NG ist die nächste Generation unseres langjährig sehr beliebten Währungsstärkemessers FX Power. Und was bietet dieser Stärkezähler der nächsten Generation? Alles, was Sie am ursprünglichen FX Power geliebt haben PLUS GOLD/XAU-Stärkeanalyse Noch präzisere Berechnungsergebnisse Individuell konfigurierbare Analysezeiträume Anpassbares Berechnungslimit für noc
Advanced Supply Demand MT5
Bernhard Schweigert
4.53 (15)
Derzeit 33% Rabatt! Die beste Lösung für jeden Anfänger oder erfahrenen Händler! Dieser Indikator ist ein einzigartiges, qualitativ hochwertiges und erschwingliches Trading-Tool, da wir eine Reihe von proprietären Funktionen und eine neue Formel integriert haben. Mit diesem Update werden Sie in der Lage sein, doppelte Zeitrahmenzonen anzuzeigen. Sie können nicht nur einen höheren TF (Zeitrahmen) anzeigen, sondern sowohl den Chart-TF als auch den höheren TF: SHOWING NESTED ZONES. Alle Supply Dema
RelicusRoad Pro MT5
Relicus LLC
4.81 (21)
Jetzt 147 US -Dollar (nach ein paar Aktualisierungen auf 499 US -Dollar) - Unbegrenzte Konten (PCs oder MACs) RelicusRoad Benutzerhandbuch + Schulungsvideos + Zugang zur privaten Discord-Gruppe + VIP-Status EINE NEUE ART, DEN MARKT ZU BETRACHTEN RelicusRoad ist der weltweit leistungsstärkste Handelsindikator für Forex, Futures, Kryptowährungen, Aktien und Indizes und gibt Händlern alle Informationen und Tools, die sie benötigen, um profitabel zu bleiben. Wir bieten technische Analysen un
Zunächst einmal ist es wichtig zu betonen, dass dieses Handelstool ein Nicht-Repaint-, Nicht-Redraw- und Nicht-Verzögerungsindikator ist, was es ideal für professionelles Trading macht. Der Smart Price Action Concepts Indikator ist ein sehr leistungsstarkes Werkzeug sowohl für neue als auch erfahrene Händler. Er vereint mehr als 20 nützliche Indikatoren in einem und kombiniert fortgeschrittene Handelsideen wie die Analyse des Inner Circle Traders und Strategien des Smart Money Concepts. Diese
Dies ist ein Indikator für MT5, der genaue Signale für den Einstieg in einen Handel ohne Repainting (Neuzeichnen) liefert. Er kann auf alle Finanzwerte angewendet werden: Forex, Kryptowährungen, Metalle, Aktien, Indizes. Er liefert ziemlich genaue Schätzungen und sagt Ihnen, wann es am besten ist, eine Position zu eröffnen und zu schließen. Sehen Sie sich das Video (6:22) mit einem Beispiel für die Verarbeitung nur eines Signals an, das sich für den Indikator gelohnt hat! Die meisten Händler ver
AW Trend Predictor MT5
AW Trading Software Limited
4.76 (54)
Die Kombination von Trend- und Aufschlüsselungsebenen in einem System. Ein fortschrittlicher Indikatoralgorithmus filtert Marktrauschen, bestimmt den Trend, Einstiegspunkte sowie mögliche Ausstiegsniveaus. Indikatorsignale werden in einem Statistikmodul aufgezeichnet, das es Ihnen ermöglicht, die am besten geeigneten Tools auszuwählen, die die Wirksamkeit der Signalhistorie zeigen. Der Indikator berechnet Take-Profit- und Stop-Loss-Marken. Handbuch und Anleitung ->   HIER   / MT4-Version ->   H
FX Volume MT5
Daniel Stein
4.94 (17)
Erhalten Sie Ihr tägliches Marktupdate mit Details und Screenshots über unser Morning Briefing hier auf mql5 und auf Telegram ! FX Volume ist der ERSTE und EINZIGE Volumenindikator, der einen ECHTEN Einblick in die Marktstimmung aus Sicht eines Brokers bietet. Es bietet fantastische Einblicke in die Positionierung von institutionellen Marktteilnehmern, wie z.B. Brokern, auf dem Forex-Markt, viel schneller als COT-Berichte. Diese Informationen direkt auf Ihrem Chart zu sehen, ist der wahre Game
The Volume by Price Indicator for MetaTrader 5 features Volume Profile and Market Profile TPO (Time Price Opportunity). Get valuable insights out of currencies, equities and commodities data. Gain an edge trading financial markets. Volume and TPO histogram bar and line charts. Volume Footprint charts. TPO letter and block marker charts including split structures. Versatile segmentation and compositing methods. Static, dynamic and flexible ranges with relative and/or absolute visualizations. Lay
Wir stellen vor       Quantum Breakout PRO   , der bahnbrechende MQL5-Indikator, der die Art und Weise, wie Sie mit Breakout-Zonen handeln, verändert! Entwickelt von einem Team erfahrener Händler mit über 13 Jahren Handelserfahrung,       Quantum Breakout PRO       ist darauf ausgelegt, Ihre Handelsreise mit seiner innovativen und dynamischen Breakout-Zone-Strategie auf ein neues Niveau zu heben. Der Quantum Breakout Indicator zeigt Ihnen Signalpfeile auf Breakout-Zonen mit 5 Gewinnzielzone
ICT, SMC, SMART MONEY CONCEPTS, SMART MONEY, Smart Money Concept, Support and Resistance, Trend Analysis, Price Action, Market Structure, Order Blocks, BOS/CHoCH,   Breaker Blocks ,  Momentum Shift,   Supply&Demand Zone/Order Blocks , Strong Imbalance,   HH/LL/HL/LH,    Fair Value Gap, FVG,  Premium  &   Discount   Zones, Fibonacci Retracement, OTE, Buy Side Liquidity, Sell Side Liquidity, BSL/SSL Taken, Equal Highs & Lows, MTF Dashboard, Multiple Time Frame, BigBar, HTF OB, HTF Market Structure
Auto Order Block with break of structure based on ICT and Smart Money Concepts Futures Break of Structure ( BoS )             Order block ( OB )            Higher time frame Order block / Point of Interest ( POI )    shown on current chart           Fair value Gap ( FVG ) / Imbalance   ,  MTF      ( Multi Time Frame )    Volume Imbalance     ,  MTF          vIMB Gap’s Equal High / Low’s     ,  MTF             EQH / EQL Liquidity               Current Day High / Low           HOD /
TPSpro TRENDPRO  - is a trend indicator that automatically analyzes the market and provides information about the trend and each of its changes, as well as giving signals for entering trades without redrawing! The indicator uses each candle, analyzing them separately. referring to different impulses - up or down impulse. Exact entry points into transactions for currencies, crypto, metals, stocks, indices!  -  Version MT4                  DETAILED DESCRIPTION        /       TRADING SETUPS       
TrendMaestro5
Stefano Frisetti
note: this indicator is for METATRADER4, if you want the version for METATRADER5 this is the link:  https://www.mql5.com/it/market/product/108106 TRENDMAESTRO recognizes a new TREND in the bud, he never makes mistakes. The certainty of identifying a new TREND is priceless. DESCRIPTION TRENDMAESTRO identifies a new TREND in the bud, this indicator examines the volatility, volumes and momentum to identify the moment in which there is an explosion of one or more of these data and therefore the mome
IX Power MT5
Daniel Stein
5 (1)
IX Power   bringt die unschlagbare Präzision von FX Power endlich auch zu Nicht-Forex-Symbolen. Es bestimmt präzise die Intensität von kurz-, mittel- und langfristigen Trends in Ihren Lieblingsindizes, Aktien, Rohstoffen, ETFs und sogar Kryptowährungen. Sie können   alles analysieren, was   Ihr Terminal zu bieten hat. Probieren Sie es aus und erleben Sie, wie   sich Ihr Timing   beim Handel   deutlich verbessert . IX Power Hauptmerkmale 100% präzise, nicht nachpinselnde Berechnungsergebni
Werden Sie Breaker Trader und profitieren Sie von Änderungen der Marktstruktur, wenn sich der Preis umkehrt. Der Order Block Breaker Indikator zeigt an, wann sich eine Trend- oder Preisbewegung der Erschöpfung nähert und bereit ist, sich umzukehren. Es weist Sie auf Änderungen in der Marktstruktur hin, die normalerweise auftreten, wenn eine Umkehrung oder ein größerer Rückzug bevorsteht. Der Indikator verwendet eine proprietäre Berechnung, die Ausbrüche und Preisdynamik identifiziert. Jedes
Quantum Heiken Ashi PRO MT5
Bogdan Ion Puscasu
4.5 (8)
Wir stellen den   Quantum Heiken Ashi PRO   vor Die Heiken-Ashi-Kerzen wurden entwickelt, um klare Einblicke in Markttrends zu geben und sind bekannt für ihre Fähigkeit, Rauschen herauszufiltern und falsche Signale zu eliminieren. Verabschieden Sie sich von verwirrenden Preisschwankungen und begrüßen Sie eine glattere, zuverlässigere Diagrammdarstellung. Was den Quantum Heiken Ashi PRO wirklich einzigartig macht, ist seine innovative Formel, die traditionelle Candlestick-Daten in leicht lesbare
TrendLine PRO MT5
Evgenii Aksenov
4.78 (49)
The Trend Line PRO indicator is an independent trading strategy. It shows the trend change, the entry point to the transaction, as well as automatically calculates three levels of Take Profit and Stop Loss protection Trend Line PRO is perfect for all Meta Trader symbols: currencies, metals, cryptocurrencies, stocks and indices Advantages of Trend Line PRO Never redraws its signals The possibility of using it as an independent strategy It has three automatic levels Take Profit and Stop Loss lev
TrendDecoder Premium MT5
Christophe, Pa Trouillas
5 (1)
Top bewertet auf anderem MarketPlace -  Jetzt verfügbar auf METATRADER Identifizieren Sie Bereiche und die nächsten wahrscheinlichen Bewegungen     |    Erhalten Sie früheste Signale und die Stärke von Trends     |    Klare Ausstiegssignale vor Umkehrung     |    Erkennen Sie die Fibo-Levels, die der Kurs testen wird    |  Indikator, der nicht zurückverfolgt, nicht verzögert - ideal für den manuellen und automatisierten Trading - geeignet für alle Vermögenswerte und Zeiteinheiten - 50% Rabatt  
A key element in trading is zones or levels from which decisions to buy or sell a trading instrument are made. Despite attempts by major players to conceal their presence in the market, they inevitably leave traces. Our task was to learn how to identify these traces and interpret them correctly. Reversal First Impulse levels (RFI)   -  Version MT4                  INSTRUCTIONS                 RUS                 ENG                         R ecommended to use with an indicator   -  TREND PRO  
Was: $249  Now: $99   Market Profile defines a number of day types that can help the trader to determine market behaviour. A key feature is the Value Area, representing the range of price action where 70% of trading took place. Understanding the Value Area can give traders valuable insight into market direction and establish the higher odds trade. It is an excellent addition to any system you may be using. Inspired by Jim Dalton’s book “Mind Over Markets”, this indicator is designed to suit the
Dark Power MT5
Marco Solito
4.84 (56)
Dark Power  is an Indicator for intraday trading. This Indicator is based on   Trend Following  strategy, also adopting the use of an histogram to determine the right power . We can enter in good price with this Indicator, in order to follow the   strong trend   on the current instrument. The histogram is calculated based on the size of the bars and two moving averages calculated on the histogram determine the direction of the signal Key benefits Easily visible take profit/stop loss lines Int
PZ Swing Trading MT5
PZ TRADING SLU
5 (4)
Swing Trading ist der erste Indikator, der Schwankungen in Trendrichtung und mögliche Umkehrschwankungen erkennt. Es wird der in der Handelsliteratur weit verbreitete Baseline-Swing-Trading-Ansatz verwendet. Der Indikator untersucht mehrere Preis- und Zeitvektoren, um die aggregierte Trendrichtung zu verfolgen und erkennt Situationen, in denen der Markt überverkauft oder überkauft ist und zur Korrektur bereit ist. [ Installationsanleitung | Update-Anleitung | Fehlerbehebung | FAQ | Alle Produkte
Blahtech Supply Demand MT5
Blahtech Limited
4.57 (14)
Was: $299  Now: $99   Supply Demand uses previous price action to identify potential imbalances between buyers and sellers. The key is to identify the better odds zones, not just the untouched ones. Blahtech Supply Demand indicator delivers functionality previously unavailable on any trading platform. This 4-in-1 indicator not only highlights the higher probability zones using a multi-criteria strength engine, but also combines it with multi-timeframe trend analysis, previously confirmed swings
Legacy of Gann for MT5
Pavel Zamoshnikov
5 (4)
The indicator very accurately determines the levels of the possible end of the trend and profit fixing. The method of determining levels is based on the ideas of W.D.Gann, using an algorithm developed by his follower Kirill Borovsky. Extremely high reliability of reaching levels (according to K. Borovsky  - 80-90%) Indispensable for any trading strategy – every trader needs to determine the exit point from the market! Precisely determines targets on any timeframes and any instruments (forex, met
Market Structure Patterns
Samuel Manoel De Souza
4.67 (18)
Market Structure Patterns is an indicator based on smart money concepts that displays almost all of the SMC/ICT elements needed to take your trading decisions to the next level. Take advantage of the alerts , push notifications and email messages to keep informed from when an element is formed on the chart, the price crosses a level and/or enters in a box/zone. Developers can access the values of the elements of the indicator using the global variables  what allows the automation of trading deci
Golden Gate Algo MT5
James David Lane
4 (6)
40% RABATT ZU WEIHNACHTEN! PREISERHÖHUNG AUF $250 AM 1. JANUAR! Vorstellung von GoldenGate Entries: Eine hochmoderne Handelslösung! Entdecken Sie einen revolutionären Ansatz zum Handel mit GoldenGate Entries (GGE), einem fortschrittlichen Indikator, der entwickelt wurde, um Ihr Handelserlebnis zu verbessern. GGE bietet eine umfassende Palette von Funktionen, um Benutzer mit Präzision und Vertrauen in ihren Handelsentscheidungen auszustatten. Paare: Beliebig (FX - Rohstoffe - Aktien - Akti
Weitere Produkte dieses Autors
RaysFX TMAT3 è uno strumento potente che combina due tipi di medie mobili per aiutarti a identificare e seguire le tendenze del mercato. L’indicatore utilizza una media mobile triangolare centrata (TMA) e un T3 Moving Average. Queste due medie mobili lavorano insieme per fornire segnali di trading chiari e tempestivi. Quando il T3 Moving Average è inferiore alla TMA, l’indicatore considera che la tendenza del mercato sia al rialzo e genera un segnale di acquisto. Al contrario, quando il T3 Movin
RaysFX Supertrend + Alert RaysFX Supertrend   è un indicatore di tendenza superiore progettato per i trader che desiderano avere un vantaggio nel mercato. Questo indicatore utilizza una combinazione di CCI (Commodity Channel Index) e ATR (Average True Range) per identificare le tendenze del mercato e fornire segnali di trading accurati. Caratteristiche principali Indicatori CCI e ATR : Utilizza due degli indicatori più popolari e affidabili per identificare le tendenze del mercato e generare se
FREE
RaysFX Stochastic  L'indicatore RaysFX Stochastic è un indicatore personalizzato per la piattaforma MetaTrader 4. Caratteristiche principali: -Indicatori separati: L'indicatore viene visualizzato in una finestra separata sotto il grafico principale. -Livelli dell'indicatore: L'indicatore ha due livelli predefiniti, 20 e 80, che possono essere utilizzati come livelli di ipervenduto e ipercomprato. -Buffer dell'indicatore: L'indicatore utilizza quattro buffer per calcolare e memorizzare i suo
FREE
RaysFX CCI e RSI
Davide Rappa
3 (2)
Il nostro Indicatore Combinato RaysFX CCI-RSI è uno strumento unico che combina due dei più popolari indicatori di analisi tecnica: l’Indice di Forza Relativa (RSI) e l’Indice del Canale delle Materie Prime (CCI). Caratteristiche : Combinazione di CCI e RSI : L’indicatore calcola la differenza tra i valori di CCI e RSI per ogni barra del grafico. Media Mobile Semplice (SMA) : L’indicatore calcola una SMA su queste differenze e traccia due linee sul grafico. Segnali di trading : Ogni volta che qu
FREE
Questo indicatore fractal ti invierà un messaggio telefonico (tramite app mt4) non è necessaria la configurazione dell'indicatore, basta impostare l'ID del tuo smartphone e potrai ricevere il messaggio BUY o SELL in tempo reale (affidabilità 80%) per qualsiasi domanda o dubbio non esitate a contattarmi su mql5.com o telegram (link al gruppo disponibile in bio)
RaysFX   EMA  Crossover Scopri i potenziali punti di inversione del mercato con l’indicatore di Crossover EMA di RaysFX. Questo indicatore utilizza una combinazione di due medie mobili esponenziali (EMA) - una più veloce e una più lenta - per identificare i possibili punti di ingresso e uscita. Caratteristiche principali : Due EMA : Utilizza una EMA più veloce e una più lenta per catturare i movimenti di mercato a breve e lungo termine. Segnali di crossover : Genera un segnale quando l’EMA più v
FREE
RaysFX StochRSI Presentiamo un indicatore MQL4 sviluppato da RaysFX, un rinomato sviluppatore nel campo del trading algoritmico. Questo indicatore è una combinazione semplice ma potente di due indicatori popolari: RSI e Stocastico. Caratteristiche principali: RSI : Un indicatore di momentum che misura la velocità e il cambiamento dei movimenti dei prezzi. Stocastico : Un indicatore di momentum che confronta il prezzo di chiusura di un titolo con la gamma dei suoi prezzi durante un certo periodo
FREE
RaysFX Strategy è un sofisticato strumento di trading che genera segnali di ACQUISTO e VENDITA basati su una combinazione di quattro indicatori tecnici: 3 SMA (Simple Moving Average), 1 StochasticRSI , 1 Choppy, e 1 DeMarker. Only M1 TimeFrame! **Segnale di VENDITA** Quando la candela precedente è sotto i 3 SMA, sopra il livello 80 dello Stochastic, sotto il livello 38 del Choppy e sopra il livello 0.3 del DeMarker, l'indicatore genera un segnale di VENDITA, rappresentato da una freccia rossa.
Questa utility di base non agisce in automatico, ma supporterà il trader, ti aiuterà nella gestione dei lotti tramite: possibilità di impostare la size possibilità di   impostare TP e SL (in pip) Consiglio: Questo EA ti aiuterà nella gestione dei tuoi ordini ed è  ottimo abbinarlo a delgi indicatori (trovate nel nostro store molti indicatori utili, fra cui il RaysFX Strategy )
What Is MT4 Candlestick Pattern Indicator Candlestick patterns are groups of candlestick that have a meaning for the trader. These groups are usually composed of two, three, four, or five candles and indicate some form of price action happening. In many cases traders use these patterns to decide what to do next. Candlestick Pattern Indicator for MT4 is a plugin that allows you to see the most common candlestick patterns on your chart. The indicator scans the chart and detects popular patterns, m
Tra le tecniche alternative di trading più utilizzate dagli investitori, uno spazio interessante va dato alla   strategia Ichimoku cloud   che si basasulle nuvole (kumo). Queste ultime sono il vero fulcro del sistema di trading Hichimoku Kinko Hyo. Molti erroneamente pensano che l’Ichimoku Kinko Hyo sia un semplice indicatore trend following, mentre invece è un vero e proprio   sistema di trading completo . Infatti   grazie a UN SOLO grafico (sia pure molto complesso) ci dà una visione complet
Questo indicatore è studiato per analizzare: Lo Stochastic Oscillators , la Moving Averages , il MACD , il crossover MA , e per finire i Parabolic SAR. Il tutto viene racchiuso in un grafico che indicherà con frecce e spettri il momento ideale per aprire un trade. "La precisione dei segnali dipende sempre dai valori impostati, con i valori stock si ha un ottima affidabilità "
Trade Assistant MetaTrader indicator  — a multi-timeframe indicator that is based on three standard indicators:   Stochastic oscillator ,   RSI   (Relative Strength Index), and   CCI   (Commodity Channel Index). It displays current trend directions for M1, M5, M15, M30, H1, H4, D1, W1, and MN1 timeframes. When you follow such an indicator you have a clear picture of the trends across all important timeframes. It doesn't matter which timeframe you attach this indicator to. The indicator can be d
Delfino V6
Davide Rappa
Delfino V6 è un bot progettato da  @xhunterx86 in collaborazione con noi di RaysFX  per operare in modo automatizzato sul mercato finanziario. Questo EA è specializzato nelle principali coppie valutarie che si trovano in fase di lateralizzazione, utilizzando una strategia che si focalizza sulle condizioni di mercato senza tendenza. Utilizzando algoritmi e criteri specifici, Delfino V6  è progettato per identificare opportunità di trading in mercati stabili e laterali. A differenza
RaysFX  Donchian Channel Questo indicatore può essere utile per identificare i livelli di supporto e resistenza, nonché per visualizzare visivamente la gamma di prezzo di un determinato periodo. Variabili Valore Periodo 20 TimeFrame Current Mode High/Low(true) o Close (false) Modalità true Telegram:  https://t.me/SmartSaverOfficial Store:  https://www.mql5.com/it/users/rays96/seller Questo indicatore è stato Progettato da RaysFX
RaysFX Forcaster è un indicatore avanzato per MetaTrader 4, progettato per fornire previsioni accurate del mercato. Questo indicatore utilizza un algoritmo sofisticato per calcolare i valori futuri basandosi su una serie di parametri configurabili dall'utente. Caratteristiche principali: - TimeFrame : Permette all'utente di impostare il timeframe desiderato. Supporta diversi timeframes come M1, M5, M15, M30, H1, H4, D1, W1 e MN. - HalfLength : Questo parametro determina la lunghezza della met
RaysFX Engulfing RaysFX   Engulfing  è uno strumento potente per identificare i pattern di engulfing nel mercato Forex. Questi pattern sono segnali di inversione di tendenza che possono fornire opportunità di trading preziose. Caratteristiche principali : Rilevamento di pattern engulfing : L’indicatore identifica i pattern engulfing rialzisti e ribassisti, che sono segnali di possibili inversioni di tendenza. Segnali visivi : I pattern rilevati vengono evidenziati sul grafico con frecce blu e r
RaysFX DMI Presentiamo l’Oscillatore RaysFX DMI, un indicatore personalizzato per la piattaforma di trading MetaTrader 4. Questo indicatore unico è progettato per fornire segnali di trading chiari e precisi basati sull’Indice di Movimento Direzionale (DMI). Caratteristiche principali: Oscillatore DMI:   Calcola un oscillatore DMI basato su un periodo DMI specificato e un metodo di media mobile. Smoothing:   L’oscillatore DMI viene ulteriormente lisciato in base a un periodo di lisciatura e a u
RaysFX Dynamic Cycle Explorer (DCE) RaysFX Dynamic Cycle Explorer (DCE)   è un potente indicatore di trading sviluppato per la piattaforma MetaTrader 4. Progettato con l’obiettivo di fornire ai trader un vantaggio competitivo, DCE utilizza algoritmi avanzati per identificare e segnalare le opportunità di trading più promettenti. Caratteristiche principali Multi-periodo : DCE utilizza sei periodi diversi per calcolare i suoi segnali, offrendo una visione completa del mercato. Super Trend Price :
RaysFX Candlestick Signals RaysFX Candlestick Signals è un potente strumento progettato per migliorare la tua esperienza di trading su MT4. Questo indicatore personalizzato è stato sviluppato con l’obiettivo di fornire segnali di trading precisi e tempestivi basati su specifiche configurazioni di candele e l’indicatore RSI. Caratteristiche principali : Segnali di acquisto e vendita : L’indicatore genera segnali di acquisto e vendita basati su specifiche configurazioni di candele e valori dell’
RaysFX Master Inside Bars Master Inside Bars : L’indicatore identifica una serie di “Inside Bars” consecutive, formando un “Master Inside Bar”. Puoi personalizzare il numero minimo di “Inside Bars” consecutive necessarie per formare un “Master Inside Bar”, così come il colore e la larghezza dell’istogramma del “Master Inside Bar”. Inside Bars : L’indicatore identifica le “Inside Bars”, candele che si trovano completamente all’interno dell’intervallo della candela precedente. Puoi personalizzare
RaysFX Auto Fibo RaysFX Auto Fibo v2.1 è un indicatore di trading essenziale per tutti i trader che utilizzano la piattaforma MetaTrader 4. Questo strumento automaticamente disegna i ritracciamenti di Fibonacci sul tuo grafico, risparmiando tempo e fatica. Caratteristiche principali: Disegno automatico : Non dovrai più tracciare manualmente i livelli di Fibonacci. L’indicatore lo fa per te, risparmiandoti tempo e garantendo precisione. Personalizzabile : Puoi personalizzare il colore, lo stile
RaysFX Auto TrendLine Linee di tendenza automatiche : L’indicatore disegna automaticamente le linee di tendenza sul tuo grafico, risparmiandoti tempo e fatica. Personalizzabile : Periodo (nPeriod) : Questo parametro determina il numero di barre che l’indicatore considera per il calcolo delle linee di tendenza. Ad esempio, se imposti     nPeriod     a 10, l’indicatore considererà le ultime 10 barre per disegnare le linee di tendenza. Un periodo più lungo renderà l’indicatore meno sensibile
RaysFX Reversal Bar RaysFX Reversal Bar è un potente strumento di trading progettato per la piattaforma MetaTrader 4. Questo indicatore è stato sviluppato per individuare le inversioni di mercato basate su un modello di candela specifico. Caratteristiche principali: Rilevamento di inversioni : L’indicatore cerca specifici modelli di inversione di 2 barre nel mercato. Questi modelli includono una barra rialzista seguita da due barre ribassiste per un segnale di acquisto, e una barra ribassist
RaysFX 3 Stoch! Sei un trader alla ricerca di un vantaggio competitivo? L’indicatore RaysFX 3 Stoch è l’aggiunta perfetta al tuo arsenale di trading.  Caratteristiche principali: Stocastico a 3 livelli : L’indicatore RaysFX 3 Stoch utilizza tre livelli di stocastico per fornire segnali di trading accurati e tempestivi. Personalizzabile : Puoi personalizzare i periodi di K, D e Slowing, così come i periodi dei tre stocastici, per adattarsi al tuo stile di trading. Allerta integrata : L’in
RaysFX Supertrend Bar RaysFX Supertrend Bar è un indicatore personalizzato per MetaTrader 4. Utilizza l'indice di canale delle materie prime (CCI) per generare segnali di trading. L'indicatore mostra dei puntini in una finestra separata sotto il grafico principale per indicare i segnali di trading. Caratteristiche principali: Calcola il CCI per diversi periodi temporali. Visualizza puntini per indicare i segnali di trading. Permette all'utente di modificare i periodi temporali e la distanza tra
RaysFX Candlestick Exit  Il RaysFX Candlestick Exit è un indicatore di trading avanzato progettato per i trader che desiderano avere un controllo preciso sulle loro uscite di trading. Questo indicatore utilizza una combinazione di tecniche di trading per fornire segnali di uscita accurati e tempestivi. Caratteristiche principali: Range : Questo parametro consente di impostare il range di candele considerate per il calcolo dell’indicatore. Shift : Questo parametro consente di spostare l’indicato
RaysFX Intraday Fibo RaysFX Intraday Fibo è un indicatore di trading Forex di alta qualità, progettato con precisione e attenzione ai dettagli. Questo indicatore è il risultato di anni di esperienza nel trading Forex e nella programmazione MQL4, ed è stato creato con l’obiettivo di fornire ai trader un vantaggio competitivo nel mercato. Caratteristiche principali: Precisione : L’indicatore RaysFX Intraday Fibo utilizza un algoritmo avanzato per identificare i punti di ingresso e di uscita ottima
RaysFX MACD Divergence Presentiamo RaysFX MACD Divergence, un indicatore di trading avanzato progettato per i trader moderni. Questo indicatore utilizza la divergenza MACD, uno dei metodi più affidabili nel mondo del trading, per fornirti segnali di trading precisi e tempestivi. Caratteristiche principali: Divergenza MACD: L’indicatore identifica e traccia le divergenze MACD, fornendo segnali di trading potenzialmente redditizi. Personalizzabile: Puoi personalizzare i parametri dell’EMA veloce
RaysFX WPR Strategy Indicator RaysFX WPR Strategy è un indicatore di strategia di trading basato sul calcolo del WPR (Williams Percent Range). Questo indicatore utilizza tre lunghezze diverse per il calcolo del WPR e pesa i risultati per fornire un valore complessivo del WPR. Caratteristiche: - Calcola il WPR utilizzando tre lunghezze diverse (9, 33, 77) - Utilizza un sistema di pesi per combinare i tre valori del WPR in un unico valore - Genera alert in base al numero di alert impostato dall
Auswahl:
Keine Bewertungen
Antwort auf eine Rezension