• Übersicht
  • Bewertungen
  • Diskussion

WAPV Weis Wave Chart Forex

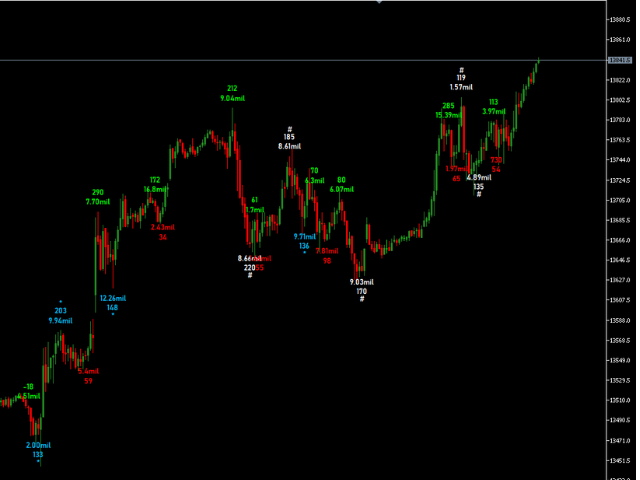
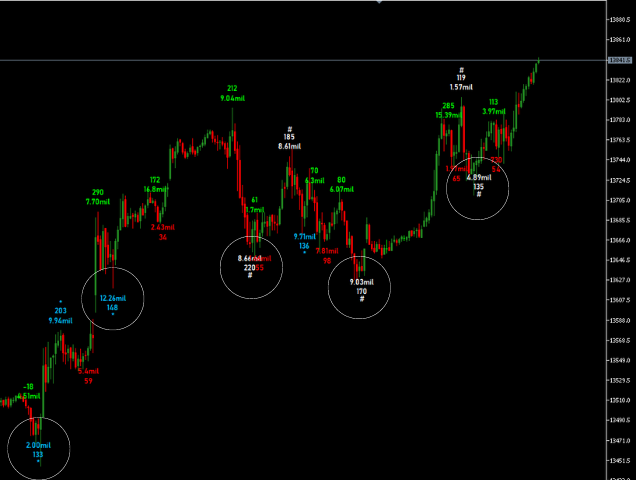
Der Weis Wave Chart Forex für MT5 ist ein Preis- und Volumenindikator. Die Lesart von Preis und Volumen wurde durch Richard Demille Wyckoff auf der Grundlage der drei von ihm geschaffenen Gesetze verbreitet: Angebot und Nachfrage, Ursache und Wirkung und Aufwand vs. Ergebnis. Bereits 1900 verwendete R.Wyckoff das Wellendiagramm in seinen Analysen. Viele Jahre später, um 1990, automatisierte David Weis das Wellendiagramm von R. Wyckoff, und heute bringen wir Ihnen die Entwicklung des Wellendiagramms von David Weis. Es zeigt die Höhe des Volumens und die Anzahl der Pips in Bezug auf die im Vermögenswert erzeugte Welle. Heute konnten wir von der Wyckoff Academy signifikant innerhalb des Wellendiagramms abbilden, und das sehen Sie in den Bildern unten.


Empfohlene Produkte
Weis Wave Double Side
Eduardo Da Costa Custodio Santos
Der Weis Wave Bouble Side Indicator für MT5 ist Teil des Toolkits (Wyckoff Academy Wave Market) Der Weis Wave Bouble Side Indicator für MT5 wurde basierend auf dem bereits etablierten Weis Wave von David Weis entwickelt. Der Weis Wave Double Side Indikator liest den Markt in Wellen, wie er gemacht wurde von R. Wyckoff im Jahr 1900. Es hilft bei der Identifizierung von Aufwand x Ergebnis, Ursache und Wirkung sowie Angebot und Nachfrage Sein Unterschied besteht darin, dass es unterhalb der Nullach
The Accumulation / Distribution is an indicator which was essentially designed to measure underlying supply and demand. It accomplishes this by trying to determine whether traders are actually accumulating (buying) or distributing (selling). This indicator should be more accurate than other default MT5 AD indicator for measuring buy/sell pressure by volume, identifying trend change through divergence and calculating Accumulation/Distribution (A/D) level. Application: - Buy/sell pressure: above
Weis Wave Double Side Alert
Eduardo Da Costa Custodio Santos
Der Weis Wave Bouble Side Indicator für MT5 ist Teil des Toolkits (Wyckoff Academy Wave Market) Der Weis Wave Bouble Side Indicator für MT5 wurde basierend auf dem bereits etablierten Weis Wave von David Weis entwickelt. Der Weis Wave Double Side Indikator liest den Markt in Wellen, wie es R. Wyckoff im Jahr 1900 tat. Es hilft bei der Identifizierung von Aufwand x Ergebnis, Ursache und Wirkung sowie Angebot und Nachfrage Sein Unterschied besteht darin, dass es unterhalb der Nullachse verwendet w
Mean Reversion Supply Demand Indicator Mean Reversion Supply Demand is the indicator to detect the important supply demand zone in your chart. The concept of supply demand trading relies on the quantity mismatching between buying and selling volumes in the financial market. Typically, supply demand zone serves to predict the turning point. The wave pattern, for any supply demand zone to work as an successful trade, looks like the price must touch the base zone, move away and then return to zone
Waves PRO
Flavio Javier Jarabeck
For those who appreciate Richard Wyckoff approach for reading the markets, we at Minions Labs designed a tool derived - yes, derived, we put our own vision and sauce into this indicator - which we called Waves PRO . This indicator provides a ZigZag controlled by the market volatility (ATR) to build its legs, AND on each ZigZag leg, we present the vital data statistics about it. Simple and objective. This indicator is also derived from the great book called " The Secret Science of Price and Volum
Key level wedge MT5
Presley Annais Tatenda Meck
The   Key level wedge MT5   indicator automatically draws rising wedge pattern and falling wedge pattern for you on the chart. This pattern is really good when used as a confirmation entry at key support & resistance, supply & demand and reversal zones. Advantages  The   Key level wedge MT5   block DOES NOT RE-PAINT, giving you confidence when a signal appears and also helps when looking back.  The   Key level wedge MT5   includes an on/off button on the chart to easily keep the charts cle
The   ICT Unicorn Model   indicator highlights the presence of "unicorn" patterns on the user's chart which is derived from the lectures of   "The Inner Circle Trader" (ICT) . Detected patterns are followed by targets with a distance controlled by the user.   USAGE (image 2) At its core, the ICT Unicorn Model relies on two popular concepts, Fair Value Gaps and Breaker Blocks. This combination highlights a future area of support/resistance. A   Bullish Unicorn Pattern   consists ou
White Weis Volume Ticks
Ricardo Almeida Branco
5 (3)
White Weis Volume This indicator shows the sum of the volume in each wave, bulish or bearish, as idealized by David Weis , but it brings an important addition , which is the marking of the bar with the highest volume of the wave (White Bar)! In coding the indicator, it was sought to optimize the code to require minimal processing during use and not to overload mt5. The indicator can be used for pre-trading analysis and study, where the trader analyzes possible points of support and resi
The best time to trade Using this Indicator is when the time reach exactly hour,half,45 minutes,15 minutes and sometimes 5 minutes.. This indicators is helpful to those who trade boom and crash indecies.How to read this indicator first you'll see Blue allow and Red allow all these allows used to indicate or to detect the spike which will happen so the allow happens soon before the spike happen.This indicator works properly only in boom and crash trading thing which you have to consider when
KT Renko Patterns MT5
KEENBASE SOFTWARE SOLUTIONS
KT Renko Patterns scans the Renko chart brick by brick to find some famous chart patterns that are frequently used by traders across the various financial markets. Compared to the time-based charts, patterns based trading is easier and more evident on Renko charts due to their uncluttered appearance. KT Renko Patterns features multiple Renko patterns, and many of these patterns are extensively explained in the book titled Profitable Trading with Renko Charts by Prashant Shah. A 100% automate
Description The indicator uses market profile theory to show the most relevant trading zones, on a daily basis. The zones to be shown are LVN (low volume nodes) and POC (point of control). An LVN zone is one which represents price areas with the least time or volume throughout the day. Typically, these areas indicate a supply or demand initiative, and in the future, they can turn into important breakout or retracement zones. A POC zone is one which represents price areas with the most time or vo
This is Gekko's Cutomized Cutomized Average Directional Index (ADX), a customized version of the famous ADX indicator. Use the regular ADX and take advantage two entry signals calculations and different ways of being alerted whenever there is potential entry or exit point. Inputs Period: Period for the ADX calculation; PlotSignalType: How will the indicator calculate entry (swing) signals: 1- ShowSwingsOnTrendLevel : Show Signals for Trend Confirmation Swings; 2- ShowSwingsOnTrendLevelDirectio
Wapv Price and volume
Eduardo Da Costa Custodio Santos
Der WAPV Price and Volume Indicator for MT5 ist Teil des Toolsets (Wyckoff Academy Wave Market) und (Wyckoff Academy Price and Volume). Der WAPV-Preis- und Volumenindikator für MT5 wurde entwickelt, um die Volumenbewegung auf dem Chart auf intuitive Weise einfach zu visualisieren. Damit können Sie die Momente des Spitzenvolumens und Momente beobachten, in denen der Markt kein professionelles Interesse hat Identifizieren Sie Momente, in denen sich der Markt durch Trägheit bewegt und nicht durch d
Weis Waves
Flavio Javier Jarabeck
3.15 (26)
The original author is David Weis, an expert in the Wyckoff Method. The Weis Wave is a modern adaptation of the 1930's Wyckoff Method, another expert in Tape Reading techniques and Chart Analysis. Weis Waves takes market volume and stacks it into waves according to price conditions giving the trader valuable insights about the market conditions. If you want to learn more about this subject you can find tons of videos in YouTube. Just look for "The Wickoff Method", "Weis Wave" and "Volume Spread
FREE
Do you use volume in your reading of the market? Certainly many traders use it, and do not imagine operating without it. The Color Histogram Volume Set indicator allows the user to choose the value that he considers interesting to monitor. When you pass this you will have visual confirmation and if you want you will also have the audible alert that is given by the indicator. Of course, there are other ways to try to find a high volume, such as assessing whether the volume
Introduction This indicator detects volume spread patterns for buy and sell opportunity. The patterns include demand and supply patterns. You might use each pattern for trading. However, these patterns are best used to detect the demand zone (=accumulation area) and supply zone (=distribution area). Demand pattern indicates generally potential buying opportunity. Supply pattern indicates generally potential selling opportunity. These are the underlying patterns rather than direct price action. T
FREE
Introduction to X3 Chart Pattern Scanner X3 Cherart Pattern Scanner is the non-repainting and non-lagging indicator detecting X3 chart patterns including Harmonic pattern, Elliott Wave pattern, X3 patterns, and Japanese Candlestick patterns. Historical patterns match with signal patterns. Hence, you can readily develop the solid trading strategy in your chart. More importantly, this superb pattern scanner can detect the optimal pattern of its kind. In addition, you can switch on and off individu
Weis Wave Result MT5
Sant Clear Ali Costa
Features 3 types of waves: bullish, bearish and unknown. The unknown tower comes when prices move in opposite the direction of the current tower. Label that shows the percentage remaining for the next tower. Allows you set the type of volume that will be accumulated in the towers, either real or tick volumes. Thus, the indicator works in any market, for example: stocks, futures, forex, commodities, etc. Allows you to set the required score for the tower exchange. Allows you to set the font size
Volume Waves
Paulo Henrique Faquineli Garcia
One of the best tools for analyzing volume, Weis Wave was devised by David Weis to facilitate reading the directional flow. For the disciples of the Wyckoff method, this means an evolution, facilitating a predictive reading of the market, always looking for Accumulation and Distribution zones for traded assets. For better understanding, in this indicator we try to cover every reading of EFFORT (traded volume) versus RESULT (price change). Thus, you can apply the indicator on the chart twice
- This is the exact conversion from TradingView: "Support/Resistance" By "BarsStallone". - This indicator lets you read the buffers for R/S values. - This is a non-repaint and light processing load indicator. - This is not a multi time frame indicator If you want the multi time frame version you should create a personal order and I deliver two files that you need them both to have the multi time frame indicator running on your system. - The MT4 version of the indicator is not light load from pr
WAPV Weis Wave Chart MT5
Eduardo Da Costa Custodio Santos
Das Weis Wave Chart für MT5 ist ein Preis- und Volumenindikator. Die Lesart von Preis und Volumen wurde durch Richard Demille Wyckoff auf der Grundlage der drei von ihm geschaffenen Gesetze verbreitet: Angebot und Nachfrage, Ursache und Wirkung und Aufwand vs. Ergebnis. Bereits 1900 verwendete R.Wyckoff das Wellendiagramm in seinen Analysen. Viele Jahre später, um 1990, automatisierte David Weis das Wellendiagramm von R. Wyckoff, und heute bringen wir Ihnen die Entwicklung des Wellendiagramms vo
Dieser Indikator zeigt Ihnen die TP- und SL-Werte (in dieser Währung), die Sie bereits für jede Order in den Charts (geschlossen zur Transaktions-/Orderzeile) festgelegt haben, was Ihnen sehr dabei helfen wird, Ihren Gewinn und Verlust für jede Order zu schätzen. Und es zeigt Ihnen auch die PIPs-Werte. das angezeigte Format ist „Währungswerte unserer Gewinn- oder Verlust-/PIPs-Werte“. Der TP-Wert wird in grüner Farbe und der SL-Wert in roter Farbe angezeigt. Bei Fragen oder weiteren Informati
Introduction to Chart Pattern MT Chart Pattern MT is a chart pattern scanner to detect the triangle pattern, falling wedge pattern, rising wedge pattern, channel pattern and so on. Chart Pattern MT uses highly sophisticated chart pattern detection algorithm. However, we have designed it in the easy to use with intuitive user interface. Chart Pattern MT will show all the patterns in your chart in the most efficient format for your trading. You do not have to do tedious manual pattern detection an
A countdown timer for the  Volume bar chart generator  and  Tick chart generator  products, which are available for download from the MQL5 Market: Tick chart generator: https://www.mql5.com/en/market/product/29215 Volume bar chart generator: https://www.mql5.com/en/market/product/47197 The counter conveniently displays the number of ticks or transactions (depending on the chart) that need to pass for a new bar to start printing. The user can set the following indicator inputs. Volume type
FREE
No Demand No Supply MT5
Trade The Volume Waves Single Member P.C.
No Demand No Supply   This indicator identifies   No Demand –No Supply candles  to your chart and plots volume bars colored according to the signal. It can be applied to all timeframes or to a specific one only. It can also be used as regular volume indicator  with exceptional future of WEIGHTED VOLUME. Furthermore is has an alert notification, sound and email when a signals occurs. The indicator does not repaint but the alert will come on two candles back due to the definition of No Demand No S
To get access to MT4 version please click here . This is the exact conversion from TradingView: "[SHK] Schaff Trend Cycle (STC)" by "shayankm". This is a light-load processing indicator. This is a non-repaint indicator. Buffers are available for processing in EAs. All input fields are available. You can message in private chat for further changes you need. Thanks for downloading
Renko Plus
Eadvisors Software Inc.
With Renko Plus you can use the features in the Indicator functionality, just add it to the Metatrader5 chart.             The Renko chart is a type of chart, developed by the Japanese, that is constructed using price movement rather than standardized prices and time intervals like most charts. It is believed to be named after the Japanese word for bricks, "renga", as the graphic looks like a series of bricks.             A new brick is created when the price moves a specified p
Simple ATR modern
Pavel Bereznichenko
Indicator  Simple ATR  Modern It is used in technical analysis to measure market volatility and show it as a level that is more understandable to the eye and not as an oscillator. ATR Daily - Blue The possibilities of using the ATR in trade can be found in the internet. It can also be used in conjunction with another author's indicator  Volatility Vision The Average True Range indicator measures market volatility. Volatility can be low while the market is growing (and vice versa). It is
The   Supply and Demand Zones indicator   is one of the best tools we have ever made. This great tool automatically draws supply and demand zones, the best places for opening and closing positions. It has many advanced features such as multi timeframe zones support, displaying the width of zones, alert notifications for retouched zones, and much more. Because of market fractality, this indicator can be used for any kind of trading. Whether you are a positional, swing, or intraday trader does no
Mean Volume indicator for MT5
Renaud Herve Francois Candel
Mean Volume Most indicators are based on price analysis. This indicator is based on volume. Volume is overlooked piece of information in most trading systems. And this is a big mistake since volume gives important information about market participants. Mean Volume is an indicator that can be used to spot when volume is above average. It usually means that institutional traders are active. Peak in volume can be used to confirm an entry since increased volume can sustain the move in one or
Käufer dieses Produkts erwarben auch
Atomic Analyst MT5
Issam Kassas
4.22 (9)
Zunächst einmal ist es erwähnenswert, dass dieser Handelsindikator nicht neu malt, nicht neu zeichnet und keine Verzögerung aufweist, was ihn sowohl für manuellen als auch für Roboterhandel ideal macht. Der Atom-Analyst ist ein PA-Preisaktionsindikator, der die Stärke und das Momentum des Preises nutzt, um einen besseren Vorteil auf dem Markt zu finden. Ausgestattet mit fortschrittlichen Filtern, die helfen, Rauschen und falsche Signale zu entfernen, und das Handelspotenzial zu erhöhen. Durch
Zunächst einmal ist es wichtig zu betonen, dass dieses Handelssystem ein Nicht-Repainting-, Nicht-Redrawing- und Nicht-Verzögerungsindikator ist, was es sowohl für manuelles als auch für automatisches Trading ideal macht. Das "Smart Trend Trading System MT5" ist eine umfassende Handelslösung, die für neue und erfahrene Trader maßgeschneidert ist. Es kombiniert über 10 Premium-Indikatoren und bietet mehr als 7 robuste Handelsstrategien, was es zu einer vielseitigen Wahl für verschiedene Marktbe
Quantum Trend Sniper
Bogdan Ion Puscasu
5 (36)
Wir stellen vor       Quantum Trend Sniper Indicator   , der bahnbrechende MQL5-Indikator, der die Art und Weise, wie Sie Trendumkehrungen erkennen und handeln, verändert! Entwickelt von einem Team erfahrener Händler mit über 13 Jahren Handelserfahrung,       Quantum Trend Sniper-Indikator       wurde entwickelt, um Ihre Trading-Reise mit seiner innovativen Methode zur Identifizierung von Trendumkehrungen mit extrem hoher Genauigkeit auf ein neues Niveau zu heben. ***Kaufe Quantum Trend Snipe
Advanced Supply Demand MT5
Bernhard Schweigert
4.53 (15)
Derzeit 33% Rabatt! Die beste Lösung für jeden Anfänger oder erfahrenen Händler! Dieser Indikator ist ein einzigartiges, qualitativ hochwertiges und erschwingliches Trading-Tool, da wir eine Reihe von proprietären Funktionen und eine neue Formel integriert haben. Mit diesem Update werden Sie in der Lage sein, doppelte Zeitrahmenzonen anzuzeigen. Sie können nicht nur einen höheren TF (Zeitrahmen) anzeigen, sondern sowohl den Chart-TF als auch den höheren TF: SHOWING NESTED ZONES. Alle Supply Dema
RelicusRoad Pro MT5
Relicus LLC
4.81 (21)
Jetzt 147 US -Dollar (nach ein paar Aktualisierungen auf 499 US -Dollar) - Unbegrenzte Konten (PCs oder MACs) RelicusRoad Benutzerhandbuch + Schulungsvideos + Zugang zur privaten Discord-Gruppe + VIP-Status EINE NEUE ART, DEN MARKT ZU BETRACHTEN RelicusRoad ist der weltweit leistungsstärkste Handelsindikator für Forex, Futures, Kryptowährungen, Aktien und Indizes und gibt Händlern alle Informationen und Tools, die sie benötigen, um profitabel zu bleiben. Wir bieten technische Analysen un
FX Power MT5 NG
Daniel Stein
5 (4)
Erhalten Sie Ihr tägliches Marktupdate mit Details und Screenshots über unser Morning Briefing hier auf mql5 und auf Telegram ! FX Power MT5 NG ist die nächste Generation unseres langjährig sehr beliebten Währungsstärkemessers FX Power. Und was bietet dieser Stärkezähler der nächsten Generation? Alles, was Sie am ursprünglichen FX Power geliebt haben PLUS GOLD/XAU-Stärkeanalyse Noch präzisere Berechnungsergebnisse Individuell konfigurierbare Analysezeiträume Anpassbares Berechnungslimit für noc
FX Volume MT5
Daniel Stein
4.94 (17)
Erhalten Sie Ihr tägliches Marktupdate mit Details und Screenshots über unser Morning Briefing hier auf mql5 und auf Telegram ! FX Volume ist der ERSTE und EINZIGE Volumenindikator, der einen ECHTEN Einblick in die Marktstimmung aus Sicht eines Brokers bietet. Es bietet fantastische Einblicke in die Positionierung von institutionellen Marktteilnehmern, wie z.B. Brokern, auf dem Forex-Markt, viel schneller als COT-Berichte. Diese Informationen direkt auf Ihrem Chart zu sehen, ist der wahre Game
Dies ist ein Indikator für MT5, der genaue Signale für den Einstieg in einen Handel ohne Repainting (Neuzeichnen) liefert. Er kann auf alle Finanzwerte angewendet werden: Forex, Kryptowährungen, Metalle, Aktien, Indizes. Er liefert ziemlich genaue Schätzungen und sagt Ihnen, wann es am besten ist, eine Position zu eröffnen und zu schließen. Sehen Sie sich das Video (6:22) mit einem Beispiel für die Verarbeitung nur eines Signals an, das sich für den Indikator gelohnt hat! Die meisten Händler ver
TPSpro TRENDPRO  - is a trend indicator that automatically analyzes the market and provides information about the trend and each of its changes, as well as giving signals for entering trades without redrawing! The indicator uses each candle, analyzing them separately. referring to different impulses - up or down impulse. Exact entry points into transactions for currencies, crypto, metals, stocks, indices!  -  Version MT4                  DETAILED DESCRIPTION        /       TRADING SETUPS       
Wir stellen vor       Quantum Breakout PRO   , der bahnbrechende MQL5-Indikator, der die Art und Weise, wie Sie mit Breakout-Zonen handeln, verändert! Entwickelt von einem Team erfahrener Händler mit über 13 Jahren Handelserfahrung,       Quantum Breakout PRO       ist darauf ausgelegt, Ihre Handelsreise mit seiner innovativen und dynamischen Breakout-Zone-Strategie auf ein neues Niveau zu heben. Der Quantum Breakout Indicator zeigt Ihnen Signalpfeile auf Breakout-Zonen mit 5 Gewinnzielzone
Bill Williams Advanced
Siarhei Vashchylka
5 (3)
Bill Williams Advanced is designed for automatic chart analysis using Bill Williams' "Profitunity" system. The indicator analyzes four timeframes at once. Manual (Be sure to read before purchasing) Advantages 1. Automatically analyzes the chart using the "Profitunity" system of Bill Williams. The found signals are placed in a table in the corner of the screen. 2. Equipped with a trend filter based on the Alligator indicator. Most of the system signals are recommended to be used only accordi
XQ Indicator MetaTrader 5
Marzena Maria Szmit
5 (1)
Step into the realm of Forex trading with confidence and precision using XQ, a cutting-edge Forex indicator designed to elevate your trading game to unprecedented heights. Whether you're a seasoned trader or just stepping into the world of currency exchange, XQ Forex Indicator empowers you with the insights and signals needed to make informed trading decisions. The signal conditions are a combination of three indicators, and XQ Forex Indicator only display  medium and long-term trends . The ind
Gartley Hunter Multi
Siarhei Vashchylka
5 (5)
Gartley Hunter Multi - An indicator for searching for harmonic patterns simultaneously on dozens of trading instruments and on all classic timeframes: (m1, m5, m15, m30, H1, H4, D1, Wk, Mn). Manual (Be sure to read before purchasing) | Version for MT4 Advantages 1. Patterns: Gartley, Butterfly, Shark, Crab. Bat, Alternate Bat, Deep Crab, Cypher 2. Simultaneous search for patterns on dozens of trading instruments and on all classic timeframes 3. Search for patterns of all possible sizes. Fr
A key element in trading is zones or levels from which decisions to buy or sell a trading instrument are made. Despite attempts by major players to conceal their presence in the market, they inevitably leave traces. Our task was to learn how to identify these traces and interpret them correctly. Reversal First Impulse levels (RFI)   -  Version MT4                  INSTRUCTIONS                 RUS                 ENG                         R ecommended to use with an indicator   -  TREND PRO  
Golden Gate Algo MT5
James David Lane
4 (6)
40% RABATT ZU WEIHNACHTEN! PREISERHÖHUNG AUF $250 AM 1. JANUAR! Vorstellung von GoldenGate Entries: Eine hochmoderne Handelslösung! Entdecken Sie einen revolutionären Ansatz zum Handel mit GoldenGate Entries (GGE), einem fortschrittlichen Indikator, der entwickelt wurde, um Ihr Handelserlebnis zu verbessern. GGE bietet eine umfassende Palette von Funktionen, um Benutzer mit Präzision und Vertrauen in ihren Handelsentscheidungen auszustatten. Paare: Beliebig (FX - Rohstoffe - Aktien - Akti
PZ Swing Trading MT5
PZ TRADING SLU
5 (4)
Swing Trading ist der erste Indikator, der Schwankungen in Trendrichtung und mögliche Umkehrschwankungen erkennt. Es wird der in der Handelsliteratur weit verbreitete Baseline-Swing-Trading-Ansatz verwendet. Der Indikator untersucht mehrere Preis- und Zeitvektoren, um die aggregierte Trendrichtung zu verfolgen und erkennt Situationen, in denen der Markt überverkauft oder überkauft ist und zur Korrektur bereit ist. [ Installationsanleitung | Update-Anleitung | Fehlerbehebung | FAQ | Alle Produkte
Professional Scalping Tool on Deriv Attention! The indicator will be sold in limited quantities!!! Description: This trading indicator is designed for professional traders focused on scalping. Designed with the market in mind, it provides highly accurate spike trading signals. It works on the M1 timeframe and supports the following symbols: Boom 300 Index, Boom 500 Index, Boom 1000 Index, Crash 300 Index, Crash 500 Index, Crash 1000 Index. Functional Features: - Direction: - Trading is ca
Der Forex TPA Indikator deckt die wahren Aktionen der Marktmacher auf, immer dann wenn sie passieren. "Kämpfe nicht gegen die Marktmacher an, sondern folge ihnen", ist wohl der beste Rat, den ein Trader bekommen kann. Der TPA Indikator zeigt jedesmal seine Signale an wenn die Bullen definitiv stärker sind als die Bären und umgekehrt. Dieser Indikator wurde VON Tradern FÜR Trader gemacht und ist 100% NICHT NACHZEICHNEND! Signale werden STRENG am Schluss einer Kerze  generiert. Das sagen unsere Ku
IVISTscalp5
Vadym Zhukovskyi
5 (3)
Wir stellen Ihnen den iVISTscalp5-Indikator vor, der nicht nur einzigartig, sondern auch effektiv im Handel ist. Dieser Indikator basiert auf Zeitdaten und ist das Ergebnis jahrelanger Erfahrung und eingehender Analyse der Finanzmärkte. Der iVISTscalp5-Indikator ist ein ausgezeichnetes Werkzeug für manuellen Handel. Bequemlichkeit, Einfachheit und Visualisierung - die gesamte Komplexität ist verborgen. Wir haben die Einstellungen und Verwendung des iVISTscalp5-Indikators auf das Maximum vereinfa
Die beste Lösung für jeden Newbie oder Expert Trader! Dieser Indikator ist ein einzigartiges, qualitativ hochwertiges und erschwingliches Trading-Tool, da wir eine Reihe von proprietären Funktionen und eine neue Formel integriert haben. Mit nur EINEM Chart können Sie die Währungsstärke für 28 Forex-Paare ablesen! Stellen Sie sich vor, wie sich Ihr Handel verbessern wird, weil Sie in der Lage sind, den genauen Auslösungspunkt eines neuen Trends oder einer Scalping-Gelegenheit zu erkennen. Be
Sind Sie es leid, Unterstützungs- und Widerstandslinien zu zeichnen? Der Unterstützungswiderstand ist ein Multi-Zeitrahmen-Indikator, der Unterstützungs- und Widerstandslinien mit einer sehr interessanten Wendung automatisch erkennt und zeichnet: Wenn das Preisniveau im Laufe der Zeit getestet wird und seine Bedeutung zunimmt, werden die Linien dicker und dunkler. [ Installationsanleitung | Update-Anleitung | Fehlerbehebung | FAQ | Alle Produkte ] Steigern Sie Ihre technische Analyse über Nacht
Royal Scalping Indicator M5
Vahidreza Heidar Gholami
5 (8)
My products are currently 50% off. Explore them and build your own strategy. Royal Scalping Indicator is an advanced price adaptive indicator designed to generate high-quality trading signals. Built-in multi-timeframe and multi-currency capabilities make it even more powerful to have configurations based on different symbols and timeframes. This indicator is perfect for scalp trades as well as swing trades. Royal Scalping is not just an indicator, but a trading strategy itself. Features Price A
"Piranha" - an autonomous trading system that determines overbought and oversold levels on the chart. Red and blue zones represent overbought and oversold levels respectively. Entry points are marked with arrows: a downward arrow in the red zone for "sell" and an upward arrow in the blue zone for "buy". The Take profit level is indicated by the green moving average. Key features: Adjusting the Take profit level as the green moving average changes position. Averaging ability when a new market e
TrendMaestro5
Stefano Frisetti
note: this indicator is for METATRADER4, if you want the version for METATRADER5 this is the link:  https://www.mql5.com/it/market/product/108106 TRENDMAESTRO recognizes a new TREND in the bud, he never makes mistakes. The certainty of identifying a new TREND is priceless. DESCRIPTION TRENDMAESTRO identifies a new TREND in the bud, this indicator examines the volatility, volumes and momentum to identify the moment in which there is an explosion of one or more of these data and therefore the mome
MetaBands M5
Vahidreza Heidar Gholami
4.67 (3)
MetaBands verwendet leistungsstarke und einzigartige Algorithmen, um Kanäle zu zeichnen und Trends zu erkennen, sodass es Tradern potenzielle Punkte für den Einstieg und Ausstieg aus Trades bieten kann. Es ist ein Kanalindikator sowie ein leistungsstarker Trendindikator. Es umfasst verschiedene Arten von Kanälen, die einfach durch Verwendung der Eingabeparameter zusammengeführt werden können. MetaBands verwendet alle Arten von Warnmeldungen, um Benutzer über Marktereignisse zu informieren. Funkt
Multi-currency, multi-timeframe, harmonic pattern indicator AB = CD. Supports sending push notifications about signals to a mobile device, messages on e-mail, as well as messages using alerts on all available currency pairs and timeframes. This indicator was based on the indicator Harmonic ABCD Universal. Version for MetaTrader 5:  https://www.mql5.com/en/market/product/44972 . See also: Harmonic ABCD Universal for MetaTrader 4 . Using modern software development methods has made the indicator a
Der Indikator zeigt die am besten geeigneten Einstiegs- und Ausstiegspunkte an. Er zeigt auch statistische Daten zu allen Signalen an, um den Handel besser analysieren zu können. Mit Hilfe dieses Indikators werden Sie den Markt besser verstehen können. Sobald sich die Kraft des Trends abzuschwächen beginnt (dies wird auf dem Panel angezeigt), bewegt sich die Trendlinie in die Horizontale - dies ist das Signal zum Ausstieg aus dem Handel. Oder Sie können aussteigen, wenn das durchschnittliche
Weis Wave with Alert MT5
Trade The Volume Waves Single Member P.C.
4.93 (15)
Rental/Lifetime Package Options and Privileges  * For optimum results the yearly or lifetime package is suggested due to live training ! Rent Monthly Six Months   Yearly/Lifetime Weis Wave with Speed with Alert+Speed Index x x x Manual  x x x Quick Set up Video x x x Blog x x x Lifetime Updates x x x Setup and Training Material x x Free Rectangle Break Alert Tool      x Discord Access Channel "The SI traders" x 2-hour live methodology training x How to trade with it:    http://
The Price Action Finder Multi indicator is an indicator of entry points that searches for and displays Price Action system patterns on dozens of trading instruments and on all standard time frames: (m1, m5, m15, m30, H1, H4, D1, Wk, Mn). The indicator places the found patterns in a table at the bottom of the screen. By clicking on the pattern names in the table, you can move to the chart where this pattern is located. Manual (Be sure to read before purchasing) | Version for MT4 Advantages 1. Pa
Die beste Lösung für jeden Newbie oder Expert Trader! Dieser Indikator ist ein einzigartiges, qualitativ hochwertiges und erschwingliches Handelsinstrument, da wir eine Reihe von proprietären Funktionen und eine geheime Formel eingebaut haben. Mit nur EINEM Chart liefert er Alerts für alle 28 Währungspaare. Stellen Sie sich vor, wie sich Ihr Handel verbessern wird, weil Sie in der Lage sind, den genauen Auslösepunkt eines neuen Trends oder einer Scalping-Gelegenheit zu erkennen! Auf der Gru
Weitere Produkte dieses Autors
WAPV Full MT5
Eduardo Da Costa Custodio Santos
## Arbeiten Sie professionell mit WAPV Full und verfolgen Sie Wo ist das Geld der großen Spieler? Stellen Sie sich vor, Sie hätten ein Werkzeug in der Hand, das allein das Lesen übernimmt der wichtigsten Marktteilnehmer mit den besten Handelsregionen basierend auf Preis- und Volumenanalyse. WAPV Full ist ein komplettes Tool, das sich zu 100 % auf den Betrieb von R. Wyckoff konzentriert Neben der Abbildung von Marktbewegungen in Handelswellen werden auch Abbildungen erstellt den Markt, indem Sie
WAPV Box Effort x Result
Eduardo Da Costa Custodio Santos
WA_PV_BOX_EFFORT X ERGEBNIS für MT5 Der WAPV Box Effort x Result Indicator ist Teil der Package Indicators-Gruppe (Wyckoff Academy Wave Market). Der WAPV Box Effort x Result Indicator für MT5 hilft Ihnen beim Lesen von Preis und Volumen. Seine Lektüre besteht darin, bei der Identifizierung von Aufwand x Ergebnis zu helfen in Wellen, die durch den Graphen erzeugt werden. Der WAPV Box Effort x Result Indicator für MT5 bedeutet, wenn das Kästchen grün ist, dass das Volumen der Nachfrage entspricht,
HLC bar MT5 Wyckoff
Eduardo Da Costa Custodio Santos
Der Indikator "HLC_bar_MT5 Wyckoff" für MT5 wurde erstellt, um die Analyse zum Zeitpunkt des Handels zu erleichtern. Die HLC Bar wurde von Richard Wyckoff verwendet und wird derzeit häufig in "VSA" -Operationen verwendet. Wyckoff stellte fest, dass die Verwendung von High, Low und Close den Graphen viel sauberer und einfacher zu analysieren machte. Der Indikator "HLC_bar_MT5 Wyckoff" ermöglicht: # Ändern Sie die Balkenbreite; # Lassen Sie die Leiste dieselbe Farbe; # Und markieren Sie die Bar, d
VSA Smart Money
Eduardo Da Costa Custodio Santos
Der VSA Smart Money Indikator verfolgt die Bewegungen von professionellen Tradern, institutionellen Trades und allen Compound Man Bewegungen. Der VSA Smart Money Indicator liest Balken für Balken und ist ein hervorragendes Werkzeug für diejenigen, die VSA, Wyckoff, PVA und andere Analysen verwenden, die Preis und Volumen verwenden. Es gibt 10 Hinweise, die Sie in Ihrem Diagramm finden: *No Demand *Climax *UT Thrust *Top Reversal bar *Stop Volume *No Supply *Spring *Bottom Reversal *Shakeout *Bag
Segmented Volume MT5
Eduardo Da Costa Custodio Santos
Der MT5 Segmented Volume Indikator wurde entwickelt, um den Handel mit Preis- und Volumenanalyse, VSA, VPA, Wyckoff-Methode und Smart Money System zu erleichtern. Segmentiertes Volumen funktioniert auf jedem Markt (Krypto, CFD, Forex, Futures, Aktien...) und funktioniert zu jeder Chart-Zeit. Sehen Sie, wie einfach Ihre Interpretation ist: #Grün: Volumen viel höher als der Marktdurchschnitt #Dunkelrosa: Überdurchschnittliches Volumen #Blau: Positive Normallautstärke #Rot: Negative Normallautstärk
Volume Zone Fractal
Eduardo Da Costa Custodio Santos
VZO Plus ist ein Indikator, der überkaufte und überverkaufte Regionen basierend auf dem gehandelten Volumen anzeigt. #Wenn die Indikatorlinie zwischen -40 und -60 liegt, ist sie überverkauft #Wenn die Indikatorlinie zwischen 40 und 60 liegt, ist sie überkauft. Außerhalb dieser Regionen folgt der Markt seinem natürlichen Weg durch Trägheit. Oberhalb der grünen Linie bedeutet dies, dass der Markt positiv ist, Eine andere Möglichkeit, den Indikator zu analysieren, ist die Analyse von Divergenzregio
Jac Trend
Eduardo Da Costa Custodio Santos
Der JAC Trend Indicator für MT5 wurde entwickelt, um die Identifizierung des Markttrends auf einfache und agile Weise zu erleichtern. # Wenn der JAC-Trend-Indikator grün ist, haben wir einen Markt vor dem Aufwärtstrend. #Wenn der JAC-Trend-Indikator Rot ist, haben wir einen Markt vor dem Trend zum Abwärtstrend. # Wenn der JAC-Trend-Indikator grau ist, haben wir einen Seitenmarkt ohne Stärke. Auf diese Weise haben Sie alle Seiten, die der Markt auf klare und objektive Weise ansprechen kann.
Z Score Plus MT5
Eduardo Da Costa Custodio Santos
Im Finanzwesen sind Z-Scores ein Maß für die Variabilität einer Beobachtung und können von Händlern verwendet werden, um die Marktvolatilität zu bestimmen. Z-Scores sagen Händlern, ob ein Score für einen bestimmten Datensatz typisch oder atypisch ist. Z-Scores ermöglichen es Analysten auch, Scores aus mehreren Datensätzen anzupassen, um Scores zu erstellen, die genauer miteinander verglichen werden können. # In der Praxis haben wir den ZScore mit Nullpunkt und Oszillationen zwischen 2 und 3 für
Trend Everest
Eduardo Da Costa Custodio Santos
Der Trend Everest MT5-Indikator ist ein Trendfolgeindikator, der bei der Entscheidungsfindung hilft. Es basiert auf der Berechnung von ATR, die unterstützen, und dem durchschnittlichen Rumpf. Ein wichtiges Problem ist, dass der Trend Everest MT5-Nominierte nicht neu gestrichen wird, sodass Sie mit größerer Sicherheit Backtests durchführen können. Wenn es grüner High-Trend ist Wenn es Roter Abwärtstrend ist. Nicht, dass der Markt fraktal ist, je länger die Grafikzeit, desto größer ist sein Durchs
JAC Trend Color Candle
Eduardo Da Costa Custodio Santos
The indicator "JAC Trend Color Candle" for Meta Trader 5, was created to visually facilitate the trend for the trader. It is based on three parameters, which identifies the uptrend, downtrend and non-trending market. The colors are trader-configurable, and the average trader-configurable as well. trend parameters cannot be configured as they are the indicator's differential.
WAPV adh Supply and Demand
Eduardo Da Costa Custodio Santos
Der WAPV ADH Supply and Demand Indikator ist Teil einer Reihe von Indikatoren namens (Wyckoff Academy Wave Market) Der WAPV ADH Supply and Demand Indicator for MT5 soll die Gewinnerseite zwischen Käufern und Verkäufern identifizieren. Seine Lesung ist sehr einfach, wenn die grüne Linie über der roten Linie liegt, herrscht Nachfrage, wenn die rote Linie über der grünen Linie liegt, herrscht Versorgung. Je positiver die grünen und roten Linien, desto höher die Eingangslautstärke, je näher an Null
WAPV adh Supply and Demand Forex
Eduardo Da Costa Custodio Santos
Der WAPV ADH Supply and Demand Forex Indicator ist Teil einer Reihe von Indikatoren namens (Wyckoff Academy Wave Market) Der WAPV ADH Forex Supply and Demand Indicator for MT5 soll die Gewinnerseite zwischen Käufern und Verkäufern identifizieren. Seine Lesung ist sehr einfach, wenn die grüne Linie über der roten Linie liegt, herrscht Nachfrage, wenn die rote Linie über der grünen Linie liegt, herrscht Versorgung. Je positiver die grünen und roten Linien, desto höher die Eingangslautstärke, je nä
Wapv Price and volume
Eduardo Da Costa Custodio Santos
Der WAPV Price and Volume Indicator for MT5 ist Teil des Toolsets (Wyckoff Academy Wave Market) und (Wyckoff Academy Price and Volume). Der WAPV-Preis- und Volumenindikator für MT5 wurde entwickelt, um die Volumenbewegung auf dem Chart auf intuitive Weise einfach zu visualisieren. Damit können Sie die Momente des Spitzenvolumens und Momente beobachten, in denen der Markt kein professionelles Interesse hat Identifizieren Sie Momente, in denen sich der Markt durch Trägheit bewegt und nicht durch d
Weis Wave Double Side
Eduardo Da Costa Custodio Santos
Der Weis Wave Bouble Side Indicator für MT5 ist Teil des Toolkits (Wyckoff Academy Wave Market) Der Weis Wave Bouble Side Indicator für MT5 wurde basierend auf dem bereits etablierten Weis Wave von David Weis entwickelt. Der Weis Wave Double Side Indikator liest den Markt in Wellen, wie er gemacht wurde von R. Wyckoff im Jahr 1900. Es hilft bei der Identifizierung von Aufwand x Ergebnis, Ursache und Wirkung sowie Angebot und Nachfrage Sein Unterschied besteht darin, dass es unterhalb der Nullach
Weis Wave Double Side Alert
Eduardo Da Costa Custodio Santos
Der Weis Wave Bouble Side Indicator für MT5 ist Teil des Toolkits (Wyckoff Academy Wave Market) Der Weis Wave Bouble Side Indicator für MT5 wurde basierend auf dem bereits etablierten Weis Wave von David Weis entwickelt. Der Weis Wave Double Side Indikator liest den Markt in Wellen, wie es R. Wyckoff im Jahr 1900 tat. Es hilft bei der Identifizierung von Aufwand x Ergebnis, Ursache und Wirkung sowie Angebot und Nachfrage Sein Unterschied besteht darin, dass es unterhalb der Nullachse verwendet w
VSA Candle Signal
Eduardo Da Costa Custodio Santos
VSA Candle Signal für MT5 ist Teil des Toolsets (Preis und Volumen der Wyckoff Academy). Seine Funktion besteht darin, die Korrelation von Preis und Volumen bei der Bildung der Kerze zu identifizieren. Seine Erstellung basiert auf den Prämissen von R. Wyckoff , einem Vorläufer in der Analyse von Preis und Volumen. Das VSA-Kerzensignal für MT5 hilft bei der Entscheidungsfindung und hinterlässt Ihre Lektüre klarer und flüssiger. Siehe die Bilder unten.
Force and Weakness Trading
Eduardo Da Costa Custodio Santos
Der Force and Weakness Indicator for MT5 Forex ist Teil des (Wyckoff Academy Price and Volume) Toolkits Der Force and Weakness Indicator for MT5 Forex wurde entwickelt, um die Stärke und Schwäche des Volumens auf kumulierte Weise zu identifizieren. Die Vision eines Panoramas zwischen Preis und Volumen ermöglichen. Der Indikator kann als Oszillator und als Histogramm verwendet werden. Wie üblich hat es alle Prämissen der drei Gesetze von R. Wyckoff, wenn es mit dem Preis kombiniert wird: Ursache
WAPV Force and Weakness MT5
Eduardo Da Costa Custodio Santos
Der Force and Weakness Indicator for MT5 Real Volume ist Teil des (Wyckoff Academy Price and Volume) Toolsets Der Force and Weakness Indicator for MT5 Real Volume wurde entwickelt, um die Stärke und Schwäche des Volumens auf kumulierte Weise zu identifizieren. Die Vision eines Panoramas zwischen Preis und Volumen ermöglichen. Der Indikator kann als Oszillator und als Histogramm verwendet werden. Als Fantasie hat es alle Prämissen der drei Gesetze von R. Wyckoff , wenn man es mit dem Preis kombin
WAPV Weis Wave Chart MT5
Eduardo Da Costa Custodio Santos
Das Weis Wave Chart für MT5 ist ein Preis- und Volumenindikator. Die Lesart von Preis und Volumen wurde durch Richard Demille Wyckoff auf der Grundlage der drei von ihm geschaffenen Gesetze verbreitet: Angebot und Nachfrage, Ursache und Wirkung und Aufwand vs. Ergebnis. Bereits 1900 verwendete R.Wyckoff das Wellendiagramm in seinen Analysen. Viele Jahre später, um 1990, automatisierte David Weis das Wellendiagramm von R. Wyckoff, und heute bringen wir Ihnen die Entwicklung des Wellendiagramms vo
WA Order Block FVG bos MT5
Eduardo Da Costa Custodio Santos
O  WA Order Block FVG bos MT5  é um indicador com base no estudo de SMC (Smart Money Concepts) criado pelo ICT Inner Circle Trader, eleplota no seu gráfico as informações de Order Blocks em 3 tempos gráficos diferentes, fair Value Gaps e Regiões de Liquidez além do BOS ( Break os Structures), tudo em um só indicador. Dessa forma você não precisa colocar essas informações de forma manual. Agora você tem tudo isso de forma automática em seu gráfico.
Auswahl:
Keine Bewertungen
Antwort auf eine Rezension