Golden section price action indicator
- Indikatoren
- Ekaterina Saltykova
- Version: 1.60
- Aktualisiert: 22 September 2022
- Aktivierungen: 5
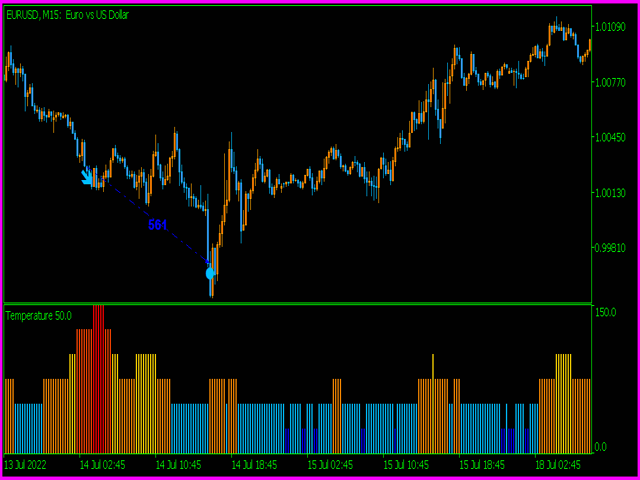
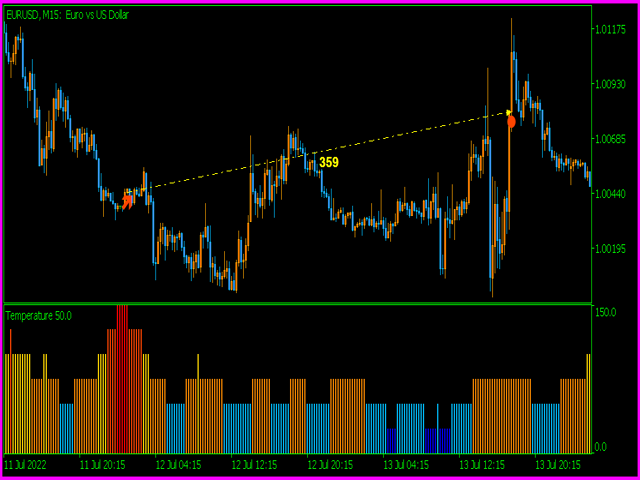
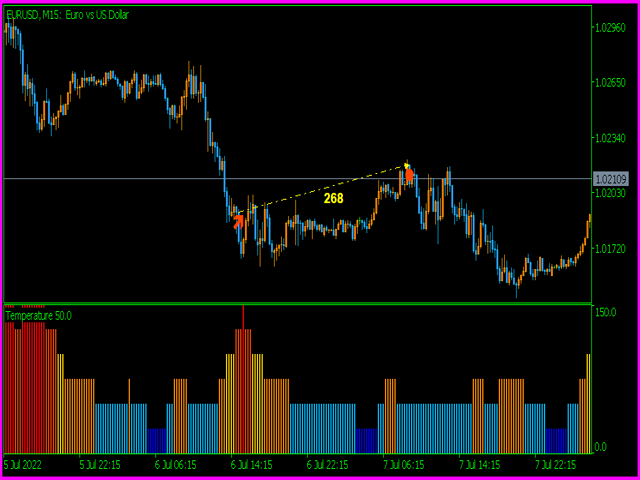
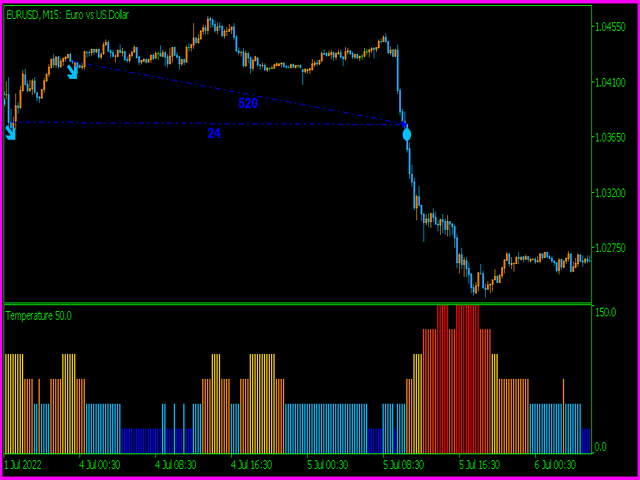
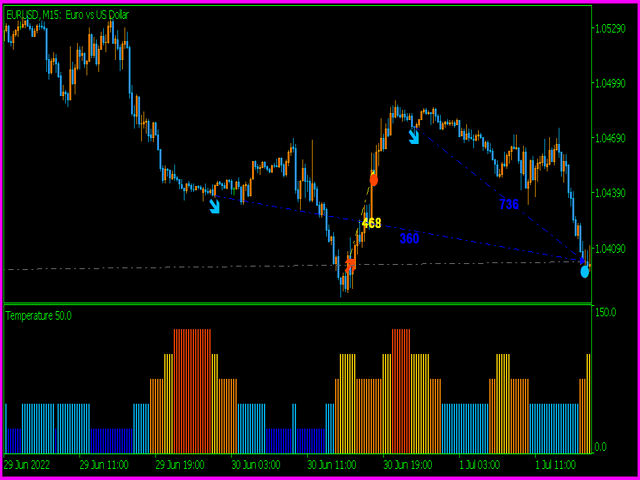
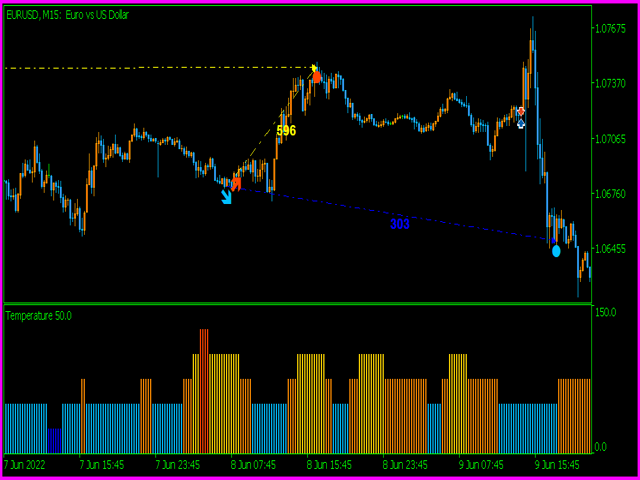
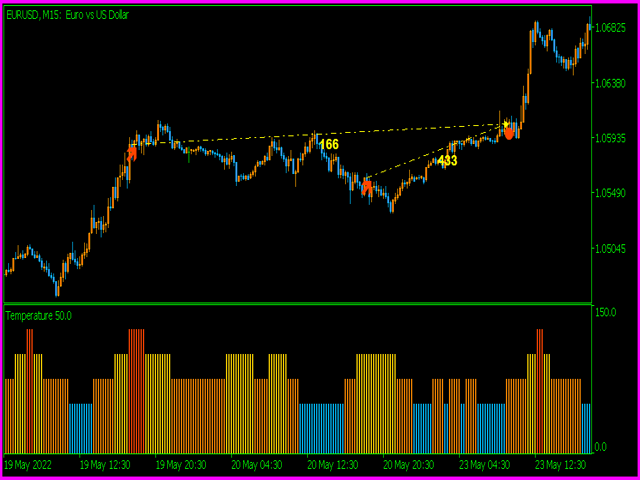
Golden section price action indicator - is a trend-scalping complete system with enter and exit points. Indicator is based on most powerfull price action japan patterns that are filtered by volume, volatility, market phase. Pattern is not a simple combinations of candles. Patterns must have "weight" to move market in right direction. "Weight" - is the summary of pattern's volume, the size of pattern candles according to last average volatility and ofcourse pattern must appear in correct market phase, excluding flat false market. The more market's "tempreture" is - the more truthfull pattern appears.
Main Indicator's Features
- Signals are not repaint,non-late or disappear;
- Every signal comes at the open of new bar(system uses only confirmed signals);
- Indicator has Alerts, Mail and Push notifications(allow to trade out of PC, from smartphone/mobile app);
- System is 100% autoadaptive no need manual adjusting. Just set up and start trading.
Recommendations for trading
- Scalping timeframes;
- EURUSD,GBPUSD,USDCAD,EURJPY;