• Übersicht
  • Bewertungen (5)
  • Diskussion (3)
  • Neue Funktionen

Fibo

4.25

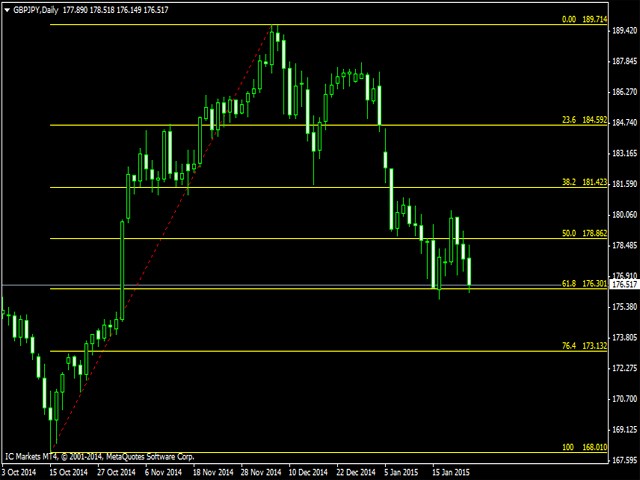
The script sets Fibonacci levels on the chart using maximums and minimums visible on the chart.

The script names Fibo with such timeframe on which it has been launched (Fibo D1 or Fibo M30, etc.), therefore preserving previously constructed levels on different time charts.

This instrument will be useful for those who start studying Fibonacci levels and those who need to form these levels in a speedy fashion.

The script does not have additional settings. Fibonacci lines can be amended in standard Fibo grid.

Bewertungen 5
Ali irwan
5137
Ali irwan 2017.07.26 09:34 
 

nice

uborschik7
24
uborschik7 2016.01.04 09:51 
 

Первое что сказал после перетаскивания Fibo на график - "Класс!" Эта штука сама денег не заработает а "уровни я и сам проведу"... Да ни чего подобного! Этот инструмент экономит время. Но главное - на сильно уменьшенном графике не приходится долго целиться на нужную свечу. Класс! Класс! КЛАСС!!!

Спасибо! Успехов!

Empfohlene Produkte
PERIOD SEPARATOR ------------------------------------------------------------------------------------ Simple and unobtrusive utility for displaying weeks, days and hours Options to control the display of separator lines and labels allow you to customize them to your own taste Display of the separator lines either only in the main chart, or across any indicator windows Feedback and suggestions for improvement are warmly welcome.
FREE
MQLTA Support Resistance Lines is an indicator that calculates the historical levels of Support and Resistance and display them as Lines on chart. It will also Alert you if the price is in a Safe or Dangerous zone to trade and show you the distance to the next level. The indicator is ideal to be used in other Expert Advisor through the iCustom function. This DEMO only works with AUDNZD, the full product can be found at https://www.mql5.com/en/market/product/26328 How does it work? The indicato
FREE
MQLTA Support Resistance Lines
MQL4 Trading Automation
4.43 (14)
MQLTA Support Resistance Lines is an indicator that calculates the historical levels of Support and Resistance and display them as Lines on chart. It will also Alert you if the price is in a Safe or Dangerous zone to trade and show you the distance to the next level. The indicator is ideal to be used in other Expert Advisor through the iCustom function. This indicator can be tested LIVE on AUDNZD with the following DEMO https://www.mql5.com/en/market/product/26572 How does it work? The indicat
FREE
This Expert Advisor alerts users when the price crosses the chart lines. Horizontal and trend lines can be processed. Number of lines is not limited. Parameters prefix of signal line – prefix for the names of the objects (lines) processed by the indicator. If left empty, all horizontal and trend lines are processed. price Mode – bid or ask. timeout – crossing alert timeout. number of repeats – number of crossing alert repeats. number of comment lines – self-explanatory.
FREE
This free version can only be used for GBPUSD M15 chart . To use on all time frames and pairs , Get Pro Version The swing continuation pattern happens in a trend direction after a short reversal / pull back . As the name suggests , these patterns occurs along the swing high and swing lows of a trend , this makes the patterns very low risk patterns with potential high rewards . The swing continuation indicator also combines Currency Meter as a filter for its execution. The idea is to go with
FREE
Grapic ByArrowTrend Pro
Truong Cong Truc
1 (1)
Indicator support for only: Entry Point to Trend Pro Link indicator  support   :   https://www.mql5.com/en/market/product/70867 Supports all currency pairs declared in the definition. Help investors do not need to open many charts. Notice the DEAL:  multiple time frames confluence   M15, H1, H4. Entry Point to Trend Pro The indicator helps investors to identify the earliest and perfect reversal point. Easy to make decision to trade with the trend   Price action trading. support resistance
FREE
Free automatic Fibonacci is an indicator that automatically plots a Fibonacci retracement based on the number of bars you select on the BarsToScan setting in the indicator. The Fibonacci is automatically updated in real time as new highest and lowest values appears amongst the selected bars. You can select which level values to be displayed in the indicator settings. You can also select the color of the levels thus enabling the trader to be able to attach the indicator several times with differe
FREE
Round Number By Pips
Nguyen Thanh Sang
5 (3)
Indicator draws Round Number lines by distance of pips. 1. You can enable / disable indicator to show / hide the lines. 2. You can set distance of pips between the lines. 3. You can edit the number of lines.  4. You can edit properties of lines by inputs (style (DASH, DOT, SOLID, ...) , width (1 for DASH, DOT, 2 is not for DASH, DOT, it only SOLID), color). When indicator is deleted from the chart, the lines will be removed.
FREE
Top Currency Strength
Madzhid Forgani
5 (1)
This indicator is one of the useful tools for traders who trade on currency pairs and based on the strength of each currency they can make a correct decision or confirmation in the positions.  It has been calculated for all the minor currency pairs supported by the broker and displays the values of the major currencies. These currencies are displayed horizontally or vertically according to the trader's config when executing the indicator. One of the trading strategies that can be used is to cho
FREE
Pivot Point Fibo RSJ ist ein Indikator, der die Unterstützungs- und Widerstandslinien des Tages mithilfe von Fibonacci-Kursen verfolgt. Dieser spektakuläre Indikator erzeugt bis zu 7 Unterstützungs- und Widerstandsebenen durch Pivot Point unter Verwendung von Fibonacci-Kursen. Es ist fantastisch, wie die Preise jedes Niveau dieser Unterstützung und dieses Widerstands respektieren, wo es möglich ist, mögliche Einstiegs- / Ausstiegspunkte einer Operation zu erkennen. Merkmale Bis zu 7 Unter
FREE
Follow The Line
Oliver Gideon Amofa Appiah
4 (13)
FOLLOW THE LINE GET THE FULL VERSION HERE: https://www.mql5.com/en/market/product/36024 This indicator obeys the popular maxim that: "THE TREND IS YOUR FRIEND" It paints a GREEN line for BUY and also paints a RED line for SELL.  It gives alarms and alerts of all kinds. IT DOES NOT REPAINT and can be used for all currency pairs and timeframes. Yes, as easy and simple as that. Even a newbie can use it to make great and reliable trades. NB: For best results, get my other premium indicators for more
FREE
Update:ver1.53 (2023/08/16) ・概要と必要環境 手動発注もしくは他ツール等からの発注に対し、指値発注予約の複製を生成します。こちらは「発注操作の簡易化」に特化したものになります。発注判断となる分析は、資料を漁る、経験則を導く、他の分析ツールやEAを併用する等、利用者ご自身で頑張ってください。なお、ver1.28より、「決済後、自動で再発注する」機能が実装されました。(有償版でのみ有効化できます) ・導入と導入後の操作 導入そのものは簡単です。「自動売買可能なEA」として、適当なチャートにて動作させるだけです。(チャートの対象相場は問いません。このEAは、チャートを見ていません)。あとは、「このEAでのローカルコピー以外の発注」があれば、それに応じて「損失が出た場合に備えての追加取引の予約」という形で、指値発注が自動生成されます。 導入操作上の注意として、「本EAを、複数のチャートで動作」はできません。EAがチャート自体を見ておらず、注文状況だけを見ているため、複数のチャートで動かす意味もありません。また、ターミナルとEAの設定として「自動売買」を許可しな
FREE
Virtual Targets
Hoang Van Dien
3.83 (6)
This indicator is very useful for day traders or short term traders. No need to calculate the number of pips manually, just look at the chart and you will see the Virtual Take Profit / Virtual Stop Loss target line and evaluate whether the entry point is feasible to reach the intended target or not. Enter the intended Take Profit / Stop Loss pips for your trade. The indicator will display Virtual Take Profit / Virtual Stop Loss lines for you to easily see if the target is feasible or not.
FREE
SR indicator
Alexander Chertnik
SR is a support and resistance indicator, it shows major highs and lows by different colors. The color of a level is changing if the last high or low are touching it. After the closing of a bar above or below level, it will delete it. extern inputs: loop for candles / colors / drawing time *This indicator signal is not perfect and have to be used with other market analysis and confirmations.
FREE
Convenient drawing of parabolic channels by four points (two lower and two upper extremums). Additional control keys: N (New) - Start drawing a new channel. C (Clear) - Deletes the current channel. By default, the current channel is the last channel. But you can click on the line of any channel to make it current. Click on the gear in the upper right corner to set some parameters for all channels or the current channel. All work is visible from the animated Gif. Do not forget to express your w
FREE
The SFT Fibo Smart Pivot indicator is a powerful trading tool based on the Fibonacci Golden Ratio, designed to identify key support and resistance levels in the forex market. This indicator has the ability to pinpoint significant price levels that can serve as entry and exit points for trades. It enables traders to analyze the market more effectively and make well-informed decisions. The indicator uses the Fibonacci Golden Ratio to accurately determine support and resistance levels. These levels
FREE
Are you looking for Price Levels and Price Channels and Price VWAP and Volume On Balance Indicators ? Now you have all in one !!! With Alarm and Push Notification. Info on your chart is showing you: where current price is and all levels, channels and vwap, how big is current On Balance Volume, is it going Bearish or Bullish, and who has the power, Buyers or Sellers. Up and down arrows showing you growing Seller or Buyer Volume. Lines showing you all Levels and Channels. Search for an entry with
FREE
Wicks UpDown Target GJ Wicks UpDown Target GJ is specialized in GJ forex pairs. Choppy movement up and down on the opening range every day.  Trading breakouts on London session and New York session is recommended. Guideline Entry Strategy Idea: Step 1 - Breakout Forming (Warning! Trade on London Session and New York Session) Step 2 - Breakout Starting (Take Action on your trading plan) Step 3 - Partial Close your order & set breakeven (no-risk) Step 4 - Target complete Step 5 - Don't tr
FREE
The   Pivot Point indicator   automatically calculates and displays the pivot point line and support and resistance levels. Pivot can be calculated according to the Classic, Floor, Fibonacci, Woodie, Camarilla or DeMark formula. It is also possible to select the period for calculating the indicator. A trader can choose from daily, weekly, monthly, or user-defined periods. Types of pivots Classic Floor Fibonacci Woodie Camarilla DeMark Main features The indicator shows the current and histor
FREE
NAS100 Auto Sl And TP
Moustapha Boulouz
5 (2)
Wir stellen den NAS100 Auto SL und TP Maker für MT4 vor: Verpassen Sie nie wieder die Einstellung von StopLoss und TakeProfit mit unserem NAS100 Auto SL und TP Maker, einem unverzichtbaren Assistenten für Händler, die den Nasdaq 100 Markt auf MetaTrader 4 navigieren. Dieses Tool wurde für diejenigen entwickelt, die eine nahtlose Lösung zur Automatisierung der Verwaltung von StopLoss- und TakeProfit-Levels suchen. Hauptmerkmale: Mühelose Automatisierung: Automatische Überwachung von Nasdaq 100 T
FREE
Pivot SR
Wartono
5 (1)
It identifies the pivot, support, and resistance price levels of the selected timeframe and then draws lines onto the chart. FEATURES: Option to specify the Timeframe Period in the PivotSR calculation. Option to display the PivotSR of the last candle, of every candle, or of the current candle. Options for displaying labels, line thickness, and line color. PivotSR can be interpreted as reversal levels or past price reactions that can be used as the basis for current price analysis. Some traders b
FREE
UPD1 D Levels
Vitaliy Kuznetsov
5 (1)
Der Levels-Indikator basiert auf den Daten des Vortages. Die mathematische Formel bestimmt die Einstiegs- und Ausstiegslevel.  Handelsempfehlungen. Levels werden zu Beginn der europäischen Sitzung gehandelt, wenn Volatilität auftritt. Bei unzureichender Volatilität wird die Hälfte des Take-Profits zum Ausstieg verwendet. Wenn der Kurs bei der Hälfte des Take-Profits umgekehrt ist, suchen Sie bei der Umkehrung ebenfalls ein Ziel auf dem Niveau des halben Take-Profits. Wenn der Kurs vom Einstie
FREE
PP Support Resistance MT4
Emmanuel Tshepang Mosweu
5 (1)
This indicator  identifies swing highs and swing lows in the price chart by comparing the Highs and lows of each candle to a specified number of candle before and after it.    Once it has identified the swing highs and swing lows, it can use them to determine potential support and resistance levels. A support level is formed when the price drops and bounces back up from a swing low, indicating that there is buying pressure at that level. A resistance level is formed when the price rises and reve
FREE
Arbeitslogik Das Stop-Out-Dienstprogramm ist ein einfacher, aber sehr praktischer Indikator, der anzeigt, wie viele Punkte bis zum Stop-Out-Level verbleiben / Sein Vorteil liegt in der Tatsache, dass viele Trader das Risiko beim Handel auf Gewinnstreben bewusst überschätzen, die verfügbare Margin maximal nutzen, und für diesen Fall ist es sehr wichtig zu wissen, wo der Broker Ihre Positionen zwangsweise schließen kann. Platzieren Sie einfach den Indikator auf dem Chart und abhängig von de
FREE
VR Money Flow Free
Kenneth Parling
4.5 (2)
Introduction Virtual Money Flow free - Lightweight free trading robot based on Money Flow index. Orders set with ISL and take profit is virtual. Equipped with trailing stop and limited money management. How to? Any account type,leverage and time frame Works only on currency pair   EURUSD, optimizations needed in regualar intervals You can start with as low as   $20-50   based on leverage   500 This is  not  a   scalper and trades can therefore be less frequent, be patient! Limited contract size
FREE
Der Chart High Low Indicator ist ein Indikator für META TRADER 4 mit der Funktion, die wöchentlichen MAXIMUM-, wöchentlichen MINIMUM-, monatlichen MAXIMUM- und monatlichen MINIMUM-Werte zu analysieren und anzuzeigen. Dies kann beim Erstellen einer Trendlinie oder sogar beim Zeichnen Ihrer FIBONNACI-Linie sehr hilfreich sein, da für die Analyse der MAXIMUM-/MINIMUM-Werte kein Zugriff auf Internetseiten erforderlich ist. Der Indikator verfügt über „Mark“-Funktionen, mit denen Bereiche mit ein
FREE
This tool gives you the opportunity to display pivot point support and resistance levels as well as the daily open, weekly close and monthly close levels on your chart with high levels of customization. Pivot points are important horizontal support and resistance levels that get calculated using the high, low and closing price of the previous period (for example D1). With this indicator, you can choose between hourly to monthly timeframes to base your pivot point calculation on. There is a
FREE
Divergence is when the price of is moving in the opposite direction of a technical indicator. Divergence warns that the current price trend may be weakening, and in some cases may lead to the price changing direction. This indicator shows all types of divergence for the selected indicator. You can also use your custom indicator to find divergence. Include Regular Bullish  Regula Bearish Hidden Bullish Hidden Bearish Indicators CCI DeMarker ForceIndex MACD Momentum OsMA RSI RVI Stochastic Custom
FREE
ZigZag Fibo Retracement
Dang Khoa Nguyen
5 (1)
ZigZag Fibo Retracement Indicator Optimize Your Trading Strategy! Are you seeking to optimize your trading strategy in the financial markets? Explore the unique features of the ZigZag Fibo Retracement Indicator, a powerful tool designed to help you identify potential support and resistance levels based on the combination of ZigZag patterns and Fibonacci ratios. Integration of ZigZag Patterns and Fibonacci: The ZigZag Fibo Retracement Indicator combines the effectiveness of ZigZag patterns, helpi
FREE
Pro Support Resistance
Suvashish Halder
4.75 (4)
This is the best Support and Resistance Indicator on the market, and it shows both confirmed Support and Resistance as well as Retests. Support & Resistance: Support marks where buying demand halts price declines, acting as a safety net. Resistance caps price surges, driven by selling pressure. Traders leverage these levels to predict reversals, plan entries, exits, and manage risks, making them trading's fundamental guideposts. You can also find Premium and Discount Levels, Strong High/Low, Wea
FREE
Käufer dieses Produkts erwarben auch
Trade Assistant MT4
Evgeniy Kravchenko
4.46 (181)
Sie hilft bei der Berechnung des Risikos pro Handel, der einfachen Einrichtung einer neuen Order, der Orderverwaltung mit Teilschließungsfunktionen, Trailing-Stop von 7 Typen und anderen nützlichen Funktionen. Achtung, die Anwendung funktioniert nicht im Strategietester. Manual, Description, Download demo Linienfunktion Zeigt auf dem Chart die Eröffnungslinie, Stop Loss, Take Profit. Mit dieser Funktion ist es einfach, eine neue Order einzurichten und ihre zusätzlichen Eigenschaften vor der
Forex Trade Manager MT4
InvestSoft
4.98 (363)
Denken Sie, dass in Märkten, in denen sich der Preis in Sekundenbruchteilen ändern kann, die Auftragserteilung so einfach wie möglich sein sollte? Wenn Sie im Metatrader eine Order eröffnen möchten, müssen Sie ein Fenster öffnen, in dem Sie den Eröffnungskurs, Stop-Loss und Take-Profit sowie die Größe der Transaktion eingeben müssen. Beim Handel an den Finanzmärkten ist die Verwaltung Ihres Kapitals unerlässlich, um Ihre Ersteinzahlung zu erhalten und zu vervielfachen. Wenn Sie also eine Order
Local Trade Copier EA MT4
Juvenille Emperor Limited
5 (77)
Erleben Sie außergewöhnlich schnelles Trade Copying mit dem Local Trade Copier EA MT4 . Mit seiner einfachen 1-Minuten-Setup können Sie Trades zwischen mehreren MetaTrader-Terminals auf demselben Windows-Computer oder Windows VPS mit blitzschnellen Kopiergeschwindigkeiten von unter 0.5 Sekunden kopieren. Ob Anfänger oder professioneller Trader - der Local Trade Copier EA MT4 bietet eine Vielzahl von Optionen, um ihn an Ihre spezifischen Bedürfnisse anzupassen. Es ist die ultimative Lösung für
TradePanel MT4
Alfiya Fazylova
4.91 (85)
Trade Panel ist ein multifunktionaler Handelsassistent. Die Anwendung enthält mehr als 50 Funktionen, die für den manuellen Handel konzipiert sind. Ermöglicht Ihnen, die meisten Handelsaktionen zu automatisieren. Achtung! Die Anwendung funktioniert im Strategietester nicht. Sie können die Anwendung auf einem Demokonto testen; laden Sie dazu die Demoversion herunter, die Sie auf der Anleitungsseite finden: Anleitung + Demoversion . Hauptfunktionen der Anwendung: Funktioniert mit allen Handelsinst
Trade Manager, der Ihnen hilft, Geschäfte schnell ein- und auszusteigen und gleichzeitig Ihr Risiko automatisch zu berechnen. Einschließlich Funktionen, die Ihnen helfen, Over Trading, Revenge Trading und Emotional Trading zu verhindern. Trades können automatisch verwaltet werden und die Kontoleistungskennzahlen können in einem Diagramm visualisiert werden. Diese Funktionen machen dieses Panel ideal für alle manuellen Händler und tragen zur Verbesserung der MetaTrader 4-Plattform bei. Unterstütz
Exp COPYLOT CLIENT for MT4
Vladislav Andruschenko
4.66 (68)
Handelskopierer für MetaTrader 4. Er kopiert Devisengeschäfte, Positionen und Bestellungen von beliebigen Konten. Es ist eines der besten Handelskopiergeräte  MT4 - MT4, MT5 - MT4 für die Version COPYLOT MT4  (oder MT4 - MT5 MT5 - MT5 für die Version COPYLOT MT5 ). MT5-Version Gesamte Beschreibung   +DEMO +PDF Wie kauft man Wie installiert man     So erhalten Sie Protokolldateien     So testen und optimieren Sie     Alle Produkte von Expforex Kopiererversion für das MetaTrader 5- Terminal
The product will copy all telegram signal to MT4   ( which you are member  ) , also it can work as remote copier.  Easy to set up, copy order instant, can work with almost signal formats, image signal, s upport to translate other language to English Work with all type of channel or group, even channel have "Restrict Saving Content", work with  multi channel, multi MT5 Work as remote copier: with signal have ticket number, it will copy exactly via ticket number. Support to backtest signal. How to
Übernehmen Sie die Kontrolle über Ihr Forex-Portfolio. Sehen Sie sofort, wo Sie stehen, was funktioniert und was Ihnen Schmerzen bereitet! MT5-VERSION HIER VERFÜGBAR: https://www.mql5.com/en/market/product/58658 Das Trade Manager Dashboard soll Ihnen auf einen Blick zeigen, wo sich jede Ihrer Positionen auf dem Devisenmarkt derzeit befindet, und das Risikomanagement und das Engagement in Währungen verständlicher machen. Für Händler, die schrittweise mit mehreren Positionen oder diesen Trading
-25% discount ($199 -> $149) Advanced trading tool: One click smart orders that execute under your conditions Developed by trader for trading community:  position size calculator (lot size), open position after price action, strategy builder, set and forget trading, mobile notifications... Risk Management -  Risk percentage position size calculator, gain percentage, target risk reward ratio, spread and commissions are included in calculations 7 Advanced order types   - Set and forget trading
Der MT4 to Telegram Signal Provider ist ein benutzerfreundliches, vollständig anpassbares Tool, das das Senden von Handelssignalen an Telegram ermöglicht und Ihr Konto in einen Signalanbieter verwandelt. Das Format der Nachrichten ist vollständig anpassbar! Für eine einfache Nutzung können Sie jedoch auch eine vordefinierte Vorlage wählen und spezifische Teile der Nachricht aktivieren oder deaktivieren. [ Demo ]   [ Handbuch ] [ MT5-Version ] [ Discord-Version ] [ Telegram-Kanal ] Einrichtung
Grid Manual MT4
Alfiya Fazylova
4.71 (17)
Grid Manual ist ein Trading-Panel zum Arbeiten mit einem Raster von Orders. Das Dienstprogramm ist universell, verfügt über flexible Einstellungen und eine intuitive Benutzeroberfläche. Es arbeitet mit einem Raster von Aufträgen nicht nur in Richtung Verlust, sondern auch in Richtung steigender Gewinne. Der Händler muss kein Orderraster erstellen und pflegen, all dies wird von "Grid Manual" erledigt. Es genügt, eine Order zu eröffnen und das "Grid Manual" erstellt automatisch ein Orderraster daf
Trade copier MT4
Alfiya Fazylova
4.67 (30)
Trade Copier ist ein professionelles Dienstprogramm zum Kopieren und Synchronisieren von Trades zwischen Handelskonten. Das Kopieren erfolgt vom Konto / Terminal des Lieferanten auf das Konto / Terminal des Empfängers, das auf demselben Computer oder vps installiert ist. Vor dem Kauf können Sie die Demoversion auf einem Demokonto testen. Demoversion hier . Vollständige Anweisungen hier . Hauptfunktionalität und Vorteile: Unterstützt das Kopieren von MT4> MT4, MT4> MT5, MT5> MT4, einschließlich M
MT4 Alert Signal Trader
Nguyen Van Anh
4.5 (4)
MT4 Alert Signal Trader  is an EA that helps you trade MT4 Alert popup. Some indicators can provide signals by showing an alert popup containing signal texts. This EA will read and trade these signal texts. The alert texts should contain at least 2 elements:  (1) a symbol text   (ex: "EURUSD") and  (2) a command type   (ex: "Buy", "Sell", "Close") that trigger EA's trading activities. Some other contents that may have or not are open price, stop loss, take profit values... The EA needs an aweso
Mentfx Mmanage
Anton Jere Calmes
5 (16)
The added video will show you the full functionality, effectiveness, and simplicity of this trade manager. Drag and Drop Trade Manager. Draw your entry and have the tool calculate the rest. Advanced targeting and close portions of a trade directly available in tool (manage trades while you sleep). Market order or limit order on either side with factored spread. Just draw the entry, the tool does the rest. Hotkey setup to make it simple. Draw where you want to enter, and the stop loss, the tool c
ADAM for FTMO 40
Vyacheslav Izvarin
ADAM EA Special Version for FTMO  Our 1st EA created using ChatGPT technology Trade only GOOD and checked PROP FIRMS  Default parameters for Challenge $100,000 Tested on EURUSD and GBPUSD only  Use 15MIN Time Frame Close all deals and Auto-trading  before Weekend at 12:00 GMT+3  Friday For Prop Firms MUST use special Protector  https://www.mql5.com/en/market/product/94887 Signal using ADAM  https://www.mql5.com/en/signals/2190554 --------------------------------------------------------------
CAP Strategy Builder EA
MEETALGO LLC
4.81 (27)
The top-selling EAs on the market cost a lot and one day they are suddenly gone. This is because one strategy will not work in the forex market all the time. Our product is unique from all others in the MQL Marketplace because our EA comes with 34+ built-in indicators that allow adding more strategies every time.  You build your strategy and keep updating it. If one strategy does not work, simply build another all using only one EA. This is All-In-One EA in this market place. You can use as trad
Trade Dashboard MT4
Fatemeh Ameri
5 (20)
Tired of complex order placement and manual calculations? Trade Dashboard is your solution. With its user-friendly interface, placing orders becomes effortless, by a single click, you can open trades, set stop loss and take profit levels, manage trade lot size, and calculate risk to reward ratios, allowing you to only focus on your strategy. Say goodbye to manual calculations and streamline your trading experience with Trade Dashboard. Download   demo version  right now. You can find details
OrderManager MT4
Lukas Roth
4.63 (19)
Der OrderManager , eine revolutionäre Hilfssoftware für den MT4 Verwalten Sie Ihre Trades wie ein Profi mit der brandneuen Order Manager-Hilfssoftware für MetaTrader 4. Entwickelt mit einem Fokus auf Einfachheit und Benutzerfreundlichkeit, ermöglicht Ihnen der Order Manager, das mit jedem Trade verbundene Risiko mühelos zu definieren und zu visualisieren. So können Sie fundierte Entscheidungen treffen und Ihre Handelsstrategie optimieren. Für weitere Informationen zum OrderManager, konsultieren
News Trapper EA
Noha Mohamed Fathy Younes Badr
5 (6)
Hi, all.  News trapper EA It is an expert for trading very safe expert  put Settings interest rate only or high impact news for Automated Trading on the news of the economic calendar. It shows stable trading during last 10  years. EA doesn't use dangerous technologies like martingale, grid. The Expert is very simple to use. The program contains flexible settings In the terminal settings, you need to add the news site to the list of allowed URLs. Click Tools >Options > Expert Advisors. Check th
Kopieren Sie Signale von jedem Kanal, dem Sie angehören (einschließlich privater und eingeschränkter Kanäle) direkt auf Ihren MT4.  Dieses Tool wurde mit dem Benutzer im Hinterkopf entwickelt und bietet viele Funktionen, die Sie benötigen, um die Trades zu verwalten und zu überwachen. Dieses Produkt wird in einer benutzerfreundlichen und visuell ansprechenden grafischen Benutzeroberfläche präsentiert. Passen Sie Ihre Einstellungen an und starten Sie die Nutzung des Produkts innerhalb weniger Mi
DrawDown Limiter MT4
Haidar, Lionel Haj Ali
5 (9)
Drawdown Limiter EA You are in the right place if you were searching for Drawdown control, Drawdown limiter, Balance protection, Equity Protection or Daily Drawdown Limit related to Prop Firm, FTMO, or Funded account trading, or if you want to protect your trading account. Have you suffered from controlling your drawdown when trading funded accounts? This EA is meant for you. Prop firms usually set a rule called “Trader Daily Drawdown”, and if it is not respected, you are disqualified.  I am an
KT Equity Protector MT4
KEENBASE SOFTWARE SOLUTIONS
3 (2)
KT Equity Protector EA consistently monitors the account equity and closes all the market and pending orders once the account equity reached a fixed equity stop loss or profit target.  After closing all trading positions, the EA can close all open charts to stop other expert advisors from opening more trading positions. Equity Stop-Loss If your current account balance is $5000 and you set an equity stop loss at $500. In this case, the KT Equity Protector will close all the active and pending
-25% discount ($149 -> $111) Everything for chart Technical Analysis indicator mt4 in one tool Draw your supply demand zone with rectangle and support resistance with trendline and get alerts to mobile phone or email alert -  Risk reward indicator Video tutorials, manuals, DEMO download   here .  Find contacts on my   profile . 1.   Extended rectangles and trendlines Object will be extended to the right edge of the chart when price will draw new candles on chart. This is rectangle extender or
The Expert Advisor will help you forward all pop-up alert with screenshot from  MetaTrader 4 to Telegram channel/ group, also forward all notifications to Telegram. Parameters  -  Telegram Bot Token - create bot on Telegram and get token.  -  Telegram Chat ID  - input your Telegram user ID,  group / channel ID  -  Forward Alert - default true, to forward alert.  -  Send message as caption of Screenshot - default false, set true to send message below Screenshot  How to setup and guide  - Telegram
Ultimate Trailing Stop EA
BLAKE STEVEN RODGER
4.33 (15)
This EA Utility allows you to manage (with advanced filtering) unlimited open orders (manual or EA) with 16 trailing stop methods: fixed, percent, ATR Exit, Chandelier Exit, Moving Average, Candle High Low Exit, Bollinger Bands, Parabolic, Envelope, Fractal, Ichimoku Kijun-Sen, Alligator, Exit After X Minutes or Bars, RSI and Stochastic. The trailing stop can be either real or virtual, and you can exit fully or with a partial close percent on touch or bar close.  Moreover, you can add (overr
Equity Shield
Vladimir Stepanov
4.57 (7)
Der Expert Advisor schützt Ihr Konto vor unerwarteten Verlusten, indem er das Eigenkapital ständig überwacht und die Regeln gemäß den Eingaben in den Parametern befolgt. Wenn die Regeln verletzt werden, schließt der EA alle Trades. Sie können den EA so einstellen, dass er alle Trades bei einem bestimmten Prozentsatz oder Geldverlust schließt oder bei einem bestimmten Prozentsatz oder Geldgewinn schließt. Dieses Dienstprogramm ist sehr nützlich für Prop-Trading-Herausforderungen, um den Draw nie
Trade Assistant GS
Vasiliy Strukov
5 (33)
Das Trading-Panel beschränkt sich auf die Verwaltung von Orders – sowohl geöffnet über Schaltflächen als auch vom Benutzer geöffnet. Einfach und bequem in der Collection. Wird jeden Käufer ergänzen. Ich empfehle, es zusammen mit dem Gold Stuff Indikator zu verwenden. Richten Sie den Handel als Einzelaufträge ein und bauen Sie ein Raster mit Abstand auf. Um ein Standardraster zu erstellen, stellen Sie einfach einen großen Abstand ein, z. B. 10000. Echtzeit-Ergebnisse können hier eingesehen wer
VirtualTradePad mt4 Extra
Vladislav Andruschenko
4.88 (59)
Trading Panel für den Handel mit 1 Klick.  Arbeiten mit Positionen und Aufträgen!  Handeln vom Chart oder von der Tastatur. Mit unserem Trading-Panel können Sie mit einem Klick vom Chart aus handeln und Handelsoperationen 30-mal schneller ausführen als die Standard-MetaTrader-Steuerung. Automatische Berechnungen von Parametern und Funktionen, die einem Händler das Leben erleichtern und einem Händler helfen, seine Handelsaktivitäten viel schneller und bequemer durchzuführen. Grafische Tipps und
The News Filter
Leolouiski Gan
5 (17)
Dieses Produkt filtert alle Expert Advisors und manuelle Charts während der Nachrichtenzeit, sodass Sie sich keine Sorgen um plötzliche Preisschwankungen machen müssen, die Ihre manuellen Handels-Setups oder Trades, die von anderen Expert Advisors eingegeben wurden, zerstören könnten. Dieses Produkt wird auch mit einem vollständigen Order-Management-System geliefert, das Ihre offenen Positionen und ausstehenden Aufträge vor der Veröffentlichung von Nachrichten bearbeiten kann. Sobald Sie The New
Custom Ultimate Sniper Dashboard
Hispraise Chinedum Abraham
5 (2)
Das Custom Ultimate Sniper Dashboard ist ein EA-Upgrade des ursprünglichen Ultimate Sniper Dashboard-Indikators. Er arbeitet mit bis zu 98 verschiedenen Algorithmen, um sicherzustellen, dass er die wahre Natur eines Trends in einer Anlageklasse, mit der Sie arbeiten, einfängt. Es ist eine direkte Antwort auf viele Vorschläge und Ratschläge, die wir von den meisten unserer Kunden über mehrere Monate hinweg erhalten haben.   Diese benutzerdefinierte Version ist vollständig anpassbar. Sie wird
Weitere Produkte dieses Autors
ADX arrow
Pavel Shutovskiy
5 (2)
ADX arrow Dieser Indikator zeigt die Signale des ADX-Indikators (Average Directional Movement Index) als Punkte auf dem Chart an. Dies erleichtert die visuelle Identifizierung von Signalen. Der Indikator verfügt auch über Warnungen (Pop-up-Meldungsfelder) Push-und Senden von Signalen an E-Mail. Rahmenbedingungen Zeitraum   - Mittelungszeitraum. Anwenden auf   - Preis für Berechnungen verwendet: Schließen, Öffnen, Hoch, Niedrig, Median (hoch + niedrig) / 2, Typisch (hoch + niedrig + sc
OsMA Arrow MTF
Pavel Shutovskiy
3.92 (12)
The indicator displays crossing zero level by Moving Average of Oscillator (OsMA) in the form of arrows. The this is a multi-timeframe indicator, and it displays signals from other timeframes. The indicator notifies about a signal by means of a pop-up Alert window, or sending notification to e-mail. Parameters Time-frame - select timeframe to show indicator signals. Fast EMA Period - fast EMA. This is an exponential moving average from a price with a short period. Slow EMA Period - slow EMA. T
FREE
OsMA Arrow
Pavel Shutovskiy
4.36 (11)
The indicator displays crossing zero level by Moving Average of Oscillator (OsMA) in the form of arrows. The indicator notifies about a signal by means of a pop-up Alert window, or sending notification to e-mail. Parameters Fast EMA Period - fast EMA. This is an exponential moving average from a price with a short period. Slow EMA Period - slow EMA. This is also an exponential moving average of a market price but with a longer period. Signal SMA Period - MACD SMA. This is a signal line which i
FREE
Beacon
Pavel Shutovskiy
5 (3)
The indicator determines overbought/oversold zones on various timeframes. Arrows show market trend in various time sessions: if the market leaves the overbought zone, the arrow will indicate an ascending trend (arrow up), if the market leaves the oversold zone, the arrow will indicate a descending trend (arrow down). Situation on the timeframe, where the indicator is located, is displayed in the lower right window. Information on the market location (overbought or oversold zone), as well as the
FREE
AC Arrow
Pavel Shutovskiy
4 (5)
The indicator displays zero level Accelerator Oscillator (AC) crossover in the form of dots on the chart. In indicator settings one can specify number of bars in the history to display signals, as well as shift of dots with respect to a bar. Parameters Bars — number of bars in the history to display indicator's signals; Shift — shift of dots with respect to bars.
FREE
MA 2 Histogram
Pavel Shutovskiy
4 (1)
The indicator is based on two Moving Averages. Its only difference from traditional indicators is that it is presented as a histogram. The histogram has four colors; each color represents a MA with its own period. In case of a descending trend, if a price is lower than a moving average, the indicator displays a value lower than the red zero level. In case of ascending trend, the indicator value is higher than the green zero level. Parameters: Period MA 1 - Period of the first moving average. MA
FREE
AD Trend line
Pavel Shutovskiy
5 (4)
AD Trend line draws trend lines on the basis of A/D indicator (Accumulation/Distribution). When A/D indicator breaks a trend line, the probability of the trend reversal is very high. This is a multitimeframe indicator which can display values from higher timeframes. Parameters Time-frame — Select a timeframe; zero is the current timeframe of the chart; Trend Line — Display lines on the chart; Apply to — Apply lines to close the candle's highest/lowest value; Width line — Width of the line; Style
FREE
The indicator displays trend reversal in the form of arrows. The indicator does not change its values (is not redrawn) after a signal. The program notifies about arrows by means of a pop-up window, or sending notification to e-mail. This is a multitimeframe instrument. Values of the indicator may be displayed from higher timeframes. Parameters Time-frame - select time session; zero is the current timeframe (Time-frame cannot be lower than the current time interval). Bars - number of bars on th
Maps
Pavel Shutovskiy
4.75 (4)
The indicator displays on the chart a map, on which markers show the current trading session, as well as shows a text. The indicator provides two types of background display: white and black. The indicator is displayed as the background and does not hinder tracking the current market situation. Parameters: GMT -  the time difference of the terminal and GMT. Background - selection of background - black or white.
FREE
Trend following
Pavel Shutovskiy
4.5 (2)
The EA in the form of histogram displays up and down trends. This tool is recommended to be used as a filter. Its readings will help to detect beginning, end, and continuation of a trend. This additional tool will suit any trading system. Parameters Period — indicator period; Bars — number of bars on the history.
FREE
Any chart has patterns of consolidation which are also called accumulation patterns. These are sections where the market has been on the same price level during significant amount of time, and thus it was accumulating positions. After such accumulation, positions are distributing, and the market passes from flat into trend. The Consolidation Levels indicator is a professional tool which identifies these sections and builds levels according to the price of the market at the moment of consolidatio
ATR Pivot
Pavel Shutovskiy
The indicator calculates the levels by ATR daily range using the equations: 1AR = Open + ATR -1AS = Open - ATR AR 1/2 = Open + (ATR / 2) AS -1/2 = Open - (ATR / 2) AR 1/4 = Open + (ATR / 4) AS -1/4 = Open - (ATR / 4) AR 3/4 = Open + ((ATR*3) / 4) AS -3/4 = Open - ((ATR*3) / 4) AR 2 = Open + (ATR*2) AS -2 = Open - (ATR*2) Parameters Period ATR - ATR period Shift time - shift by time for Open Color opening of day - Open line color Color 1AR, -1AS - 1AR, -1AS line color Color AR 1/2, AS -1/2 - A
Max Min Levels
Pavel Shutovskiy
The indicator makes levels according to local maximums and minimums of a week, a month, or a year. Parameters: Week number - number of weeks for lines display Week level color - Week line color Month number - number of months for lines display Month level color - Month line color Year number - number of years for lines display Year level color - Year line color Width line - Width of lines Style line - Style of lines
AO AC Signal
Pavel Shutovskiy
The indicator displays signals of different indicators (which can be selected in parameters) on a chart when zero level is crossed. AO, AC or AO+AC if signals of two indicators coincide. The indicator shows an Alert message (pop-up window) when a signal appears. Parameters: Indicators - Selection of the indicator AO, AC, AO+AC. Bars - Number of bars in history for display of signals. Alert - Pop-up window in case of a signal.
Beginning
Pavel Shutovskiy
The indicator builds levels from beginning of a week or a month, or according to local Highs and Lows. These levels are meant for detection of strong support and resistance levels on a chart. Most big players of the market are guided by particularly these data: opening of the week or opening of the month. Breakout of one or several Highs and price consolidation on these levels suggest that market intends to grow. Breakout of Lows and price consolidation bears evidence of market's intention to mo
F trend
Pavel Shutovskiy
The indicator is designed for scalping fans, it gives signals of an average of ten pips. The indicator is based on mathematical calculation, it determines the average range of the price channel, which is generally formed at the time of accumulation of positions. Once the price moves beyond its borders, a signal is generated in the form of an arrow. The indicator has a minimum of settings: the period for which you need to calculate, and the frequency of signals (the signal frequency is determined
Woltec
Pavel Shutovskiy
4 (1)
The indicator has been developed for scalping. The indicator is based on a mathematical calculation that determines the percent range of the price channel, which is generally formed at the time of the accumulation of positions. Once the price moves beyond its borders, a signal is generated in the form of dots. The indicator has a minimum of settings - the frequency of signals. Smaller values produce more signals. Parameters: Multiplier - the frequency of signals (with lower values signals are
Jaguar tac
Pavel Shutovskiy
The indicator uses the Envelopes channel in its calculations, which allows working with dynamic support and resistance levels. It also considers the direction and strength of the trend, as well as the mathematical calculation that determines the percent range of the price channel, which is generally formed at the time of the accumulation of positions. It first generates a preliminary signal in the form of a round arrow. Then it is necessary to wait for a normal arrow and enter the market only af
ADX trend
Pavel Shutovskiy
This indicator displays the signals of the ADX indicator (Average Directional Movement Index) as points on the chart. This facilitates the visual identification of signals. The indicator also features alerts (pop-up message boxes) and sending signals to e-mail. Parameters Period - averaging period. Apply to - price used for calculations: Close, Open, High, Low, Median (high+low)/2, Typical (high+low+close)/3, Weighted Close (high+low+close+close)/4. Alert - enable/disable alerts. EMail - enabl
Strategy Builder
Pavel Shutovskiy
5 (1)
Strategy Builder Mit dem Strategy Builder -Indikator können Sie klassische und individuelle Strategien erstellen, ohne das Diagramm mit einer großen Anzahl von Indikatoren zu laden und ohne viele verschiedene Indikatoren zu verfolgen, um das wahre Signal zu identifizieren. Strategy Builder zeigt Signale in Form von Pfeilen auf 30 Standardindikatoren an, 23 Indikatoren zeigen klassische und versteckte Divergenz, Empfangen von Signalen von Fibonacci-Levels, horizontal, Trendlinien und Rechteck.
ADX arrow N
Pavel Shutovskiy
5 (1)
ADX arrow Dieser Indikator zeigt die Signale des ADX-Indikators (Average Directional Movement Index) als Punkte auf dem Chart an. Dies erleichtert die visuelle Identifizierung von Signalen. Der Indikator verfügt auch über Warnungen (Pop-up-Meldungsfelder) Push-und Senden von Signalen an E-Mail. Rahmenbedingungen Zeitraum - Mittelungszeitraum. Anwenden auf - Preis für Berechnungen verwendet: Schließen, Öffnen, Hoch, Niedrig, Median (hoch + niedrig) / 2, Typisch (hoch + niedrig + schlie
ATR Pivots
Pavel Shutovskiy
The indicator calculates intraday levels based on the average daily price range, builds support and resistance levels that may be reversal. Parameters Period ATR - period of the ATR indicator Shift time - time offset for the opening of the day Color opening of day - color of the opening line of the day Color 1AR, -1AS - line color 1AR, -1AS Color AR 1/2, AS -1/2 - line color AR 1/2, AS Color AR 1/4, AS -1/4 - line color AR 1/4, AS -1/4 Color AR 3/4, AS -3/4 - line color AR 3/4, AS -3/4 Colo
Auswahl:
Matthew Todorovski
13122
Matthew Todorovski 2018.06.12 16:09 
 

Der Benutzer hat keinen Kommentar hinterlassen

Ali irwan
5137
Ali irwan 2017.07.26 09:34 
 

nice

Mohammed Abdulwadud Soubra
37056
Mohammed Abdulwadud Soubra 2017.06.29 10:39 
 

Der Benutzer hat keinen Kommentar hinterlassen

Roman Skovorodka
363
Roman Skovorodka 2017.03.16 16:48 
 

Der Benutzer hat keinen Kommentar hinterlassen

uborschik7
24
uborschik7 2016.01.04 09:51 
 

Первое что сказал после перетаскивания Fibo на график - "Класс!" Эта штука сама денег не заработает а "уровни я и сам проведу"... Да ни чего подобного! Этот инструмент экономит время. Но главное - на сильно уменьшенном графике не приходится долго целиться на нужную свечу. Класс! Класс! КЛАСС!!!

Спасибо! Успехов!

Antwort auf eine Rezension
Version 1.10 2022.02.02
Скомпилировано под новый билд