• Übersicht
  • Bewertungen
  • Diskussion

Volume Zone Fractal

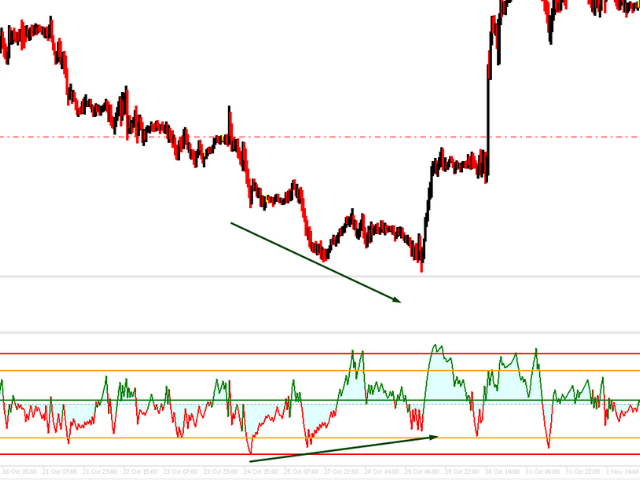
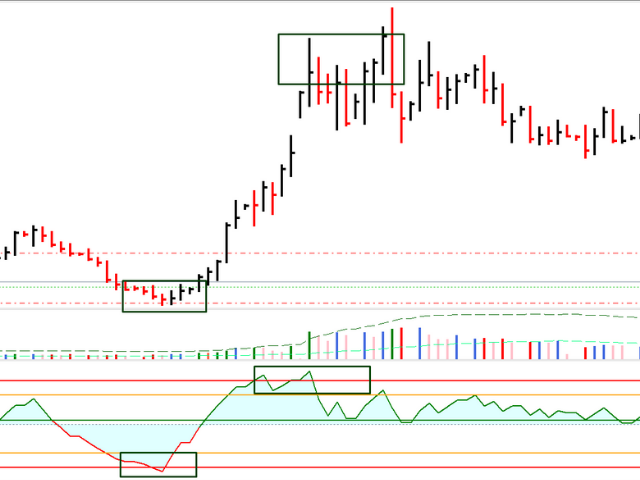
VZO Plus ist ein Indikator, der überkaufte und überverkaufte Regionen basierend auf dem gehandelten Volumen anzeigt. #Wenn die Indikatorlinie zwischen -40 und -60 liegt, ist sie überverkauft #Wenn die Indikatorlinie zwischen 40 und 60 liegt, ist sie überkauft. Außerhalb dieser Regionen folgt der Markt seinem natürlichen Weg durch Trägheit. Oberhalb der grünen Linie bedeutet dies, dass der Markt positiv ist, Eine andere Möglichkeit, den Indikator zu analysieren, ist die Analyse von Divergenzregionen. Wenn wir in einem Abwärtstrend den Boden höher als den anderen haben oder In einem Aufwärtstrend ist ein Boden kleiner als der andere.


Empfohlene Produkte
Are you tired of drawing trendlines every time you're analyzing charts? Or perhaps you would like more consistency in your technical analysis. Then this is for you. This indicator will draw trend lines automatically when dropped on a chart. How it works Works similar to standard deviation channel found on mt4 and mt5. It has 2 parameters: 1. Starting Bar 2. Number of bars for calculation The   starting bar   is the bar which drawing of the trend lines will begin, while the   number of bars for c
FREE
Follow The Line MT5
Oliver Gideon Amofa Appiah
4.23 (22)
This indicator obeys the popular maxim that: "THE TREND IS YOUR FRIEND" It paints a GREEN line for BUY and also paints a RED line for SELL. (you can change the colors). It gives alarms and alerts of all kinds. IT DOES NOT REPAINT and can be used for all currency pairs and timeframes. Yes, as easy and simple as that. Even a newbie can use it to make great and reliable trades. NB: For best results, get my other premium indicators for more powerful and reliable signals. Get them here: https://www.m
FREE
Donchian Channel is an indicator created by Richard Donchian. It is formed by taking the highest high and the lowest low of the last specified period in candles. The area between high and low is the channel for the chosen period. Its configuration is simple. It is possible to have the average between the upper and lower lines, plus you have alerts when price hits one side. If you have any questions or find any bugs, please contact me. Enjoy! This is a free indicator, but it took hours to develo
FREE
PZ Penta O MT5
PZ TRADING SLU
3.8 (5)
The Penta-O is a 6-point retracement harmonacci pattern which usually precedes big market movements. Penta-O patterns can expand and repaint quite a bit. To make things easier this indicator implements a twist: it waits for a donchian breakout in the right direction before signaling the trade. The end result is an otherwise repainting indicator with a very reliable trading signal. The donchian breakout period is entered as an input. [ Installation Guide | Update Guide | Troubleshooting | FAQ | A
FREE
The idea of a Value Chart indicator was presented in the very good book I read back in 2020 , " Dynamic Trading Indicators: Winning with Value Charts and Price Action Profile ", from the authors Mark Helweg and David Stendahl. The idea is simple and the result is pure genius: Present candlestick Price analysis in a detrended way! HOW TO READ THIS INDICATOR Look for Overbought and Oversold levels. Of course, you will need to test the settings a lot to find the "correct" one for your approach.
FREE
Weis Waves
Flavio Jarabeck
3.3 (23)
The original author is David Weis, an expert in the Wyckoff Method. The Weis Wave is a modern adaptation of the 1930's Wyckoff Method, another expert in Tape Reading techniques and Chart Analysis. Weis Waves takes market volume and stacks it into waves according to price conditions giving the trader valuable insights about the market conditions. If you want to learn more about this subject you can find tons of videos in YouTube. Just look for "The Wickoff Method", "Weis Wave" and "Volume Spread
FREE
Forex Indicator Arrows
NGUYEN NGHIEM DUY
1 (1)
Forex Indicator Arrows is an arrow Indicator used as an assistant tool for your trading strategy. The indicator analyzes the standard deviation of bar close for a given period and generates a buy or sell signals if the deviation increases. It good to combo with Martingale EA to follow Trend and Sellect Buy Only/Sell Only for EA work Semi-Automatic. You can use this  Indicator with any EAs in my Products.
FREE
The Donchian Channel Channels are among the most popular tools of technical analysis, as they visually convey to the analyst the limits within which most price movement tends to occur. Channel users know that valuable information can be obtained at any time, whether prices are in the central region of a band or close to one of the border lines. One of the best known techniques to explore these concepts is Bollinger Bands. However, John Bollinger was not the only one to research the applicatio
FREE
Free automatic Fibonacci is an indicator that automatically plots a Fibonacci retracement based on the number of bars you select on the BarsToScan setting in the indicator. The Fibonacci is automatically updated in real time as new highest and lowest values appears amongst the selected bars. You can select which level values to be displayed in the indicator settings. You can also select the color of the levels thus enabling the trader to be able to attach the indicator several times with differe
FREE
Tabajara V5
Flavio Jarabeck
4.88 (33)
Metatrader 5 version of the famous Andre Machado's Tabajara indicator. If you don't know Andre Machado's Technical Analysis work you don't need this indicator... For those who need it and for those several friend traders who asked this porting from other platforms, here it is... FEATURES 8-period Moving Average 20-period Moving Average 50-period Moving Average 200-period Moving Average Colored candles according to the inflexion of the 20-period MA SETTINGS You can change the Period of all M
FREE
Rainbow MT5
Jamal El Alama
4.33 (3)
Description : Rainbow MT5 is technical indicator based on Moving Average with period 34 and very easy to use. When price crosses above MA and MA changes color to green, then this is a signal to buy. When price crosses below MA and MA changes color to red, then this is a signal to sell. The Expert advisor ( Rainbow EA MT5 ) based on Rainbow MT5 indicator is now available here . MT4 version is available  here .
FREE
Der Indikator zeigt   runde Level   auf dem Chart an. Sie werden auch   psychologische , Bank- oder Major Player Level genannt. Auf diesen Niveaus gibt es einen echten Kampf zwischen Bullen und Bären, die Anhäufung vieler Orders, was zu einer erhöhten Volatilität führt. Der Indikator passt sich   automatisch   an jedes Instrument und jeden Zeitrahmen an. Wenn das   Level 80   durchbrochen und dann getestet ist,   kaufen wir . Wenn   Level 20   durchbrochen und dann getestet wird,   verkaufen wi
FREE
Important Lines
Terence Gronowski
4.88 (24)
Important Lines Indikator (M1 - M15) Dieser Indikator zeigt Pivot-Lines, vortages Hoch und Tief, vortages Close und das Minimum und Maximum der vorherigen Stunde an. Sie müssen nur diesen einzelnen Indikator in das Diagramm ziehen, um alle diese wichtigen Linien zu haben. Sie können sich das Laden vieler einzelnen Indikatoren ersparen. Warum sind bestimmte Linien beim Traden so wichtig? Vortageshoch und -tief: Diese werden von Händlern beobachtet, die in einer Tages-Chart handeln. Sehr of
FREE
Pivot Point Fibo RSJ ist ein Indikator, der die Unterstützungs- und Widerstandslinien des Tages mithilfe von Fibonacci-Kursen verfolgt. Dieser spektakuläre Indikator erzeugt bis zu 7 Unterstützungs- und Widerstandsebenen durch Pivot Point unter Verwendung von Fibonacci-Kursen. Es ist fantastisch, wie die Preise jedes Niveau dieser Unterstützung und dieses Widerstands respektieren, wo es möglich ist, mögliche Einstiegs- / Ausstiegspunkte einer Operation zu erkennen. Merkmale Bis zu 7 Unter
FREE
Accurate
Aleksandr Kostusev
5 (1)
The indicator automatically builds patterns of the following types - "Bullish Flag", "Bearish Flag", "Bullish Pennant", "Bearish Pennant", "Bullish Falling Wedge", "Bearish Rising Wedge". The indicator also signals a possible entry point with arrows. The indicator is multi-currency, you can trade everything from cryptocurrencies to indices. The higher the timeframe of the instrument on which the indicator stands, the more accurate the entry point and the price movement will be much longer!  
FREE
This indicator is an automated version of the Fibonacci retracement (Fib) indicator. Deciding the best areas to use when drawing the fib can be tricky and this  indicator was made with that in mind. When you drop it on the chart it will automatically choose the best points to draw the fib with, but in case you aren't satisfied with those regions, you can adjust it as you wish.
FREE
Wave Box Market Frenquency
Jean Jacques Huve Ribeiro
4.75 (4)
Totally linked to the result of a movement and the duration he had. Its height records how many ticks the asset walked during a given movement, its width shows us the duration that movement had. Its configuration must be in line with the Weis Wave Indicator configuration to observe the movement force and can indicate a possible accumulation or distribution of the movement;
FREE
Waves Sizer
Flavio Jarabeck
3 (2)
Wyckoff fans, enjoy! Ideally to be used with the Weis Waves indicator, but it can be easily used alone, the Waves Sizer puts the range (in resulting Price movement) done by the Price on its market swings. You can control how accurate or loose will be the swings. This tool is very helpful for visually know how much the Price has traveled in your Timeframe. This way you can confront this level of effort with the resulting Volume, etc... Weis Waves indicator: https://www.mql5.com/en/market/pro
FREE
Cybertrade Keltner Channels
Emanuel Andriato
4.67 (3)
Cybertrade Keltner Channels - MT5 Created by Chester Keltner, this is a volatility indicator used by technical analysis. It is possible to follow the trend of financial asset prices and generate support and resistance patterns. In addition, envelopes are a way of tracking volatility in order to identify opportunities to buy and sell these assets. It works on periods longer than the period visible on the chart. All values ​​are available in the form of buffers to simplify possible automations.
FREE
Expansoes M
Marcus Vinicius Da Silva Miranda
The M Extensions are variations of the Golden Ratio (Fibonacci Sequence). It is the World's first technique developed for Candle Projections. Advantages: Easy to plot. Candle anchoring; High and accurate precision as support and resistance; Excellent Risk x Return ratio; Works in any timeframe; Works in any asset / market.   The M Extensions are classified into: M0: Zero point (starting candle) RC: Initial candle control region M1: Extension region 1 M2: Extension region 2 M3: Extension r
FREE
This is a buyer and seller aggression indicator that analyzes the shape of each candle and project this data in a histogram form. There are 4 histograms in one. On the front we have two: Upper - Buyer force. Lower - Seller force. At the background we also have two histogram, both with same color. They measure the combined strenght of buyers and sellers. This histograms can be turned off in Input Parameters. It is also possible to have the real or tick volume to help on this force measurement. IN
FREE
Bar Color Trend
Germano Chagas
4.5 (8)
Combining the best of Price Action , Directional Movement , and Divergence/Convergence analysis, Candle Color Trend is a easy and reliable way to identify trend direction. The indicator automatically paints the candles according to the assumption that an uptrend is defined by prices that form a series of higher highs and higher lows. In contrast, a downtrend is defined by prices that form a series of lower highs and lower lows. Additionally, ADX Wilder indicator is used to measure trend weakness
FREE
The indicator identifies when a divergence occurs between price and an indicator or oscillator. It identifies both regular and hidden divergences. Combined with your own rules and techniques, this indicator will allow you to create (or enhance) your own powerful system. Features Can detect divergences for the following oscillators/indicators:   MACD, OsMA, Stochastics, RSI, CCI, RVI, Awesome, ADX, ATR, OBV, Composite index, MFI and Momentum. Only one oscillator/indicator can be selected. Draws
FREE
Automatic Trendlines
Pasi Hakamaki
4.63 (41)
Der Indikator zeichnet Trendlinien im Diagramm. Dieser Indikator hat sechs Eingänge. Der Benutzer kann alternative Beschriftungen für beide Zeilen angeben. Wenn mehrere Instanzen des Indikators verwendet werden, müssen sich die Beschriftungen unterscheiden. Der Benutzer kann die Breite und Farbe der Linien und die Tiefe festlegen, um festzulegen, welche signifikanten Peaks verwendet werden sollen. Zum Beispiel setzt Depth = 10 Trendlinien unter Verwendung der aktuellen Spitzen und Täler, die rec
FREE
You can download the Full version with more features here . Introduction Harmonic Patterns are best used to predict turning point. Harmonic Patterns give you high win rate and high opportunities for trade in during one day. This indicator detects the best and successful patterns base on Harmonic Trading books by Mr. Scott M.. Main Features Detect the best and   most successful patterns : Gartley, Bat, Crab, Butterfly, Cypher, Shark, Alt_Bat, Deep_Crab Easy-to-use and user friendly indicator Sca
FREE
Indicator and Expert Adviser  EA Available in the comments section of this product. Download with Indicator must have indicator installed for EA to work. Mt5 indicator alerts for bollinger band and envelope extremes occurring at the same time. Buy signal alerts occur when A bullish candle has formed below both the lower bollinger band and the lower envelope  Bar must open and close below both these indicators. Sell signal occur when A bear bar is formed above the upper bollinger band and upp
FREE
MIDAS Super VWAP
Flavio Jarabeck
4.23 (13)
Imagine VWAP, MVWAP and MIDAS in one place... Well, you found it! Now you can track the movement of Big Players in various ways, as they in general pursue the benchmarks related to this measuring, gauging if they had good execution or poor execution on their orders. Traders and analysts use the VWAP to eliminate the noise that occurs throughout the day, so they can measure what prices buyers and sellers are really trading. VWAP gives traders insight into how a stock trades for that day and deter
FREE
Description The indicator uses market profile theory to show the most relevant trading zones, on a daily basis. The zones to be shown are LVN (low volume nodes) and POC (point of control). An LVN zone is one which represents price areas with the least time or volume throughout the day. Typically, these areas indicate a supply or demand initiative, and in the future, they can turn into important breakout or retracement zones. A POC zone is one which represents price areas with the most time or vo
FREE
Reversal Composite Candles
MetaQuotes Ltd.
3.4 (20)
The idea of the system is to indentify the reversal patterns using the calculation of the composite candle. The reversal patterns is similar to the "Hammer" and "Hanging Man" patterns in Japanese candlestick analysis. But it uses the composite candle instead the single candle and doesn't need the small body of the composite candle to confirm the reversal. Input parameters: Range - maximal number of bars, used in the calculation of the composite candle. Minimum - minimal size of the composite can
FREE
Donchian Channel DC is the indicator of Donchian Channels, that plots maximum and minimum values of a specific period, besides mean value line. It´s possible to configure simple period for analysis and the indicator will plot all three values. You can trade with this indicator as trend or reversal, according to each strategy. Do not let to test others indicators as soon as others expert advisors.
30 USD
Käufer dieses Produkts erwarben auch
Gold Stuff mt5
Vasiliy Strukov
4.97 (92)
Gold Stuff mt5-Ein Trendindikator, der speziell für Gold entwickelt wurde, kann auch auf allen Finanzinstrumenten verwendet werden. Der Indikator wird nicht neu gezeichnet und verzögert sich nicht. Empfohlener Zeitrahmen H1. WICHTIG! Kontaktieren Sie mich sofort nach dem Kauf, um Anweisungen und Bonus zu erhalten! DATEN Draw Arrow - inkl.aus. zeichnen von Pfeilen in einem Diagramm. Alerts-inkl.aus.akustische Warnungen. E - mail notification-inkl.aus. benachrichtigungen per E-Mail. Puch-
50 USD
Dies ist ein Indikator für MT5, der genaue Signale für den Einstieg in einen Handel ohne Repainting (Neuzeichnen) liefert. Er kann auf alle Finanzwerte angewendet werden: Forex, Kryptowährungen, Metalle, Aktien, Indizes. Er liefert ziemlich genaue Schätzungen und sagt Ihnen, wann es am besten ist, eine Position zu eröffnen und zu schließen. Sehen Sie sich das Video (6:22) mit einem Beispiel für die Verarbeitung nur eines Signals an, das sich für den Indikator gelohnt hat! Die meisten Händler ver
125 USD
Trend Screener Pro MT5
STE S.S.COMPANY
4.97 (36)
Trendindikator, bahnbrechende, einzigartige Lösung für Trendhandel und -filterung mit allen wichtigen Trendfunktionen in einem Tool! Es handelt sich um einen 100 % nicht neu zu malenden Multi-Timeframe- und Multi-Währungs-Indikator, der für alle Symbole/Instrumente verwendet werden kann: Forex, Rohstoffe, Kryptowährungen, Indizes und Aktien. Trend Screener ist ein effizienter Trendfolgeindikator, der Pfeiltrendsignale mit Punkten im Diagramm liefert. Die Funktionen, die im Trendanalysator-Indika
50 USD
ICT, SMC, SMART MONEY CONCEPTS, SMART MONEY, Smart Money Concept, Support and Resistance, Trend Analysis, Price Action, Market Structure, Order Blocks, BOS/CHoCH,   Momentum Shift, HH/LL/HL/LH,    Fair Value Gap, FVG,  Premium  &   Discount   Zones, Fibonacci Retracement, OTE, Buy Side Liquidity, Sell Side Liquidity, BSL/SSL Taken, Equal Highs & Lows, MTF, Multiple Time Frame, BigBar, HTF OB, HTF Market Structure,  Liquidity Voids, Long Wicks, Candle Timer, Fractals, ZigZag, Time Zone, Market S
63 USD
Blahtech Supply Demand MT5
Blahtech Limited
4.45 (11)
Supply Demand uses previous price action to identify potential imbalances between buyers and sellers. The key is to identify the better odds zones, not just the untouched ones. Blahtech Supply Demand indicator delivers functionality previously unavailable on any trading platform. This 4-in-1 indicator not only highlights the higher probability zones using a multi-criteria strength engine, but also combines it with multi-timeframe trend analysis, previously confirmed swings and engulfing detecto
142 USD
Advanced Supply Demand MT5
Bernhard Schweigert
4.36 (11)
Derzeit 33% Rabatt! Die beste Lösung für jeden Anfänger oder erfahrenen Händler! Dieser Indikator ist ein einzigartiges, qualitativ hochwertiges und erschwingliches Trading-Tool, da wir eine Reihe von proprietären Funktionen und eine neue Formel integriert haben. Mit diesem Update werden Sie in der Lage sein, doppelte Zeitrahmenzonen anzuzeigen. Sie können nicht nur einen höheren TF (Zeitrahmen) anzeigen, sondern sowohl den Chart-TF als auch den höheren TF: SHOWING NESTED ZONES. Alle Supply Dema
199 USD
Werden Sie Breaker Trader und profitieren Sie von Änderungen der Marktstruktur, wenn sich der Preis umkehrt. Der Order Block Breaker Indikator zeigt an, wann sich eine Trend- oder Preisbewegung der Erschöpfung nähert und bereit ist, sich umzukehren. Es weist Sie auf Änderungen in der Marktstruktur hin, die normalerweise auftreten, wenn eine Umkehrung oder ein größerer Rückzug bevorsteht. Der Indikator verwendet eine proprietäre Berechnung, die Ausbrüche und Preisdynamik identifiziert. Jedes
49 USD
AW Trend Predictor MT5
Alexander Nechaev
5 (23)
Die Kombination von Trend- und Aufschlüsselungsebenen in einem System. Ein fortschrittlicher Indikatoralgorithmus filtert Marktrauschen, bestimmt den Trend, Einstiegspunkte sowie mögliche Ausstiegsniveaus. Indikatorsignale werden in einem Statistikmodul aufgezeichnet, das es Ihnen ermöglicht, die am besten geeigneten Tools auszuwählen, die die Wirksamkeit der Signalhistorie zeigen. Der Indikator berechnet Take-Profit- und Stop-Loss-Marken. Handbuch und Anleitung ->   HIER   / MT4-Version ->   H
55 USD
Der ADR-Umkehrindikator zeigt Ihnen auf einen Blick, wo der Preis derzeit im Verhältnis zu seiner normalen durchschnittlichen Tagesspanne gehandelt wird. Sie erhalten sofortige Benachrichtigungen per Pop-up, E-Mail oder Push, wenn der Preis seine durchschnittliche Spanne und darüber liegende Niveaus Ihrer Wahl überschreitet, sodass Sie schnell in Pullbacks und Umkehrungen einsteigen können. Der Indikator zeichnet horizontale Linien auf dem Chart an den durchschnittlichen täglichen Range-Extreme
49 USD
Matrix Arrow Indicator MT5
Juvenille Emperor Limited
5 (11)
Matrix Arrow Indicator MT5   ist ein einzigartiger 10-in-1-Trend, der zu   100 % nicht neu gezeichnet   werden kann. Multi-Timeframe-Indikator, der für alle Symbole/Instrumente verwendet werden kann:   Forex ,   Rohstoffe ,   Kryptowährungen ,   Indizes ,   Aktien .  Der  Matrix Arrow Indicator MT5  wird den aktuellen Trend in seinen frühen Stadien bestimmen und Informationen und Daten von bis zu 10 Standardindikatoren sammeln, die sind: Durchschnittlicher Richtungsbewegungsindex (ADX) Rohstoff
75 USD
Royal Scalping Indicator M5
Vahidreza Heidar Gholami
5 (8)
Royal Scalping Indicator is an advanced price adaptive indicator designed to generate high-quality trading signals. Built-in multi-timeframe and multi-currency capabilities make it even more powerful to have configurations based on different symbols and timeframes. This indicator is perfect for scalp trades as well as swing trades. Royal Scalping is not just an indicator, but a trading strategy itself. Features Price Adaptive Trend Detector Algorithm Multi-Timeframe and Multi-Currency Trend Low
149 USD
Offer 249 down from 350 for the next 3 copies. then back to 350 $ Are you tired of using outdated indicators that leave you guessing where to set your profit targets? Look no further than the AK CAP Opening Range Breakout Indicator. This powerful tool is backed by a US patent and has already helped countless traders pass funded challenges like FTMO. We use it daily on our prop traders and internal funds, and now it's available to you as well. The calculation behind the indicator is incredibly
249 USD
Royal Wave Pro M5
Vahidreza Heidar Gholami
5 (2)
Royal Wave is a Trend-Power oscillator which has been programmed to locate and signal low-risk entry and exit zones. Its core algorithm statistically analyzes the market and generates trading signals for overbought, oversold and low volatile areas. By using a well-designed alerting system, this indicator makes it easier to make proper decisions regarding where to enter and where to exit trades. Features Trend-Power Algorithm Low risk Entry Zones and Exit Zones Predictions for Overbought and Over
129 USD
Stargogs Spike Catcher
Lorenzo Edward Beukes
5 (6)
Stargogs Spike Catcher V3 This Indicator is Developed To milk the BOOM and CRASH indices . Send me Message if you need any help with the indicator.  CHECK OUT THE STARGOGS SPIKE CATCHER EA/ROBOT V3: CLICK HERE ALSO CHECK OUT SECOND TO NONEFX SPIKE CATCHER:   CLICK HERE STARGOGS SPIKE CATCHER V3 WHATS NEW! Brand New Strategy. This is the Indicator you need for 2023. The Indicator Gives you an Entry at a time when conditions are met and you should use TP & SL. New Trendline that changes color in
100 USD
Market Profile defines a number of day types that can help the trader to determine market behaviour. A key feature is the Value Area, representing the range of price action where 70% of trading took place. Understanding the Value Area can give traders valuable insight into market direction and establish the higher odds trade. It is an excellent addition to any system you may be using. Blahtech Limited presents their Market Profile indicator for the MetaTrader community. Inspired by Jim Dalton’s
142 USD
Owl Smart Levels MT5
Sergey Ermolov
5 (1)
Indikator-Leitfaden  |  Owl Smart Levels-Strategie  |   MT4-Version  |  Wie installiert man?   |   FAQ Der Owl Smart Levels Indikator ist ein komplettes Handelssystem innerhalb eines Indikators, der so beliebte Marktanalysetools wie die fortschrittlichen Fraktale von Bill Williams , Valable ZigZag, das die richtige Wellenstruktur des Marktes aufbaut, und Fibonacci-Levels , die die genauen Einstiegslevels markieren, enthält in den Markt und Orte, um Gewinne mitzunehmen. 7 tage Promotion - bis zu
99 USD
Trend Scanner mt5 GS
Vasiliy Strukov
5 (6)
Trend Scanner scannt Markttrends aus Multi-Symbolen und Multi-Time-Frames und zeigt sie auf einem beweglichen Panel auf dem Chart an, den er zur Analyse verwendet. Der Händler kann mehrere Paare seiner Wahl zur Anzeige auswählen. Trend Scanner ist ein großartiges Tool, um die Richtung des Trends zu sehen, und kann für den manuellen Handel oder den EA-Handel verwendet werden, indem nur Kauf- oder Verkaufsaufträge gemäß dem Trend zugelassen werden. Echtzeit-Ergebnisse können hier eingesehen wer
50 USD
Introduction to X3 Chart Pattern Scanner X3 Cherart Pattern Scanner is the non-repainting and non-lagging indicator detecting X3 chart patterns including Harmonic pattern, Elliott Wave pattern, X3 patterns, and Japanese Candlestick patterns. Historical patterns match with signal patterns. Hence, you can readily develop the solid trading strategy in your chart. More importantly, this superb pattern scanner can detect the optimal pattern of its kind. In addition, you can switch on and off individu
250 USD
Dieses Dashboard ist ein Warntool zur Verwendung mit dem Indikator für die Umkehrung der Marktstruktur. Sein Hauptzweck besteht darin, Sie auf Umkehrmöglichkeiten in bestimmten Zeitrahmen und auch auf die erneuten Tests der Warnungen (Bestätigung) aufmerksam zu machen, wie es der Indikator tut. Das Dashboard ist so konzipiert, dass es auf einem eigenen Chart sitzt und im Hintergrund arbeitet, um Ihnen Benachrichtigungen zu Ihren ausgewählten Paaren und Zeitrahmen zu senden. Es wurde entwickelt,
49 USD
Support And Resistance Screener ist ein Level-Indikator für MetaTrader, der mehrere Tools innerhalb eines Indikators bietet. Die verfügbaren Werkzeuge sind: 1. Marktstruktur-Screener. 2. Bullische Pullback-Zone. 3. Bärische Pullback-Zone. 4. Tägliche Pivot-Punkte 5. wöchentliche Pivots-Punkte 6. monatliche Pivots-Punkte 7. Starke Unterstützung und Widerstand basierend auf harmonischem Muster und Volumen. 8. Zonen auf Bankebene. ZEITLICH BEGRENZTES ANGEBOT: HV Support and Resistance Indicator ist
50 USD
Italo Volume Indicator MT5
Italo Santana Gomes
5 (9)
BUY INDICATOR AND GET EA FOR FREE AS A BONUS + SOME OTHER GIFTS! ITALO VOLUME INDICATOR  is the best volume indicator ever created, and why is that? The Indicator works on all time-frames and assets, indicator built after 6 years of experience on forex and many other markets. You know many volume indicators around the internet are not complete, does not help, and it's difficult to trade, but the Italo Volume Indicator is different , the Italo Volume Indicator shows the wave volume, when market
65 USD
Strong Support mt5
Vasiliy Strukov
5 (5)
Unterstützungs- und Widerstandsniveaus sind seit langem ein mächtiges Werkzeug für die Marktanalyse. Der Strong Support Indikator baut Unterstützungsniveaus auf lokalen Preistiefs und Widerstandsniveaus auf lokalen Preishochs auf. Meine anderen Entwicklungen finden Sie hier Es wird empfohlen, in Verbindung mit einem Trendindikator wie Gold Stuff zu verwenden, um den Trend zu handeln und gleichzeitig Konsolidierungs- oder Umkehrzonen zu definieren sowie Stop-Loss und Take-Profit auf Unterstü
50 USD
Sind Sie es leid, Unterstützungs- und Widerstandslinien zu zeichnen? Der Unterstützungswiderstand ist ein Multi-Zeitrahmen-Indikator, der Unterstützungs- und Widerstandslinien mit einer sehr interessanten Wendung automatisch erkennt und zeichnet: Wenn das Preisniveau im Laufe der Zeit getestet wird und seine Bedeutung zunimmt, werden die Linien dicker und dunkler. [ Installationsanleitung | Update-Anleitung | Fehlerbehebung | FAQ | Alle Produkte ] Steigern Sie Ihre technische Analyse über Nacht
99 USD
Das ADR Alert Dashboard zeigt Ihnen auf einen Blick, wo der Preis aktuell im Verhältnis zu seiner normalen durchschnittlichen Tagesspanne gehandelt wird. Sie erhalten sofortige Benachrichtigungen per Pop-up, E-Mail oder Push, wenn der Preis seine durchschnittliche Spanne und darüber liegende Niveaus Ihrer Wahl überschreitet, sodass Sie schnell in Pullbacks und Umkehrungen einsteigen können. Das Dash ist so konzipiert, dass es auf einem leeren Diagramm platziert werden kann und einfach im Hinter
49 USD
Market Structure MT5
Reza Aghajanpour
5 (1)
**   All Symbols   x   All Timeframes   scan just by pressing scanner button ** *** Contact me immediately after the purchase to send you instructions and add you in "Market Structure group" for sharing or seeing experiences with other users. CURRENT PRICE $39..... Future Price $200 Introduction: Market structure is important for both new and professional traders since it can influence the liquidity and price action of a market. It’s also one of the most commonly used techniques to understand tr
39 USD
Auto Order Block with break of structure Detect Break of Structure , Mark Order Block and draw Entry / Stop and Risk to Reward lines when Order block is touch by price with Alert. Trend is Manually set to filter signals in a direction by a button on the chart. Entry / Stop and Risk to Reward lines can also be switch on / off by button on chart. Futures Auto Mark Break of Structure Auto Mark Order block Auto Mark higher time frame Point Of  Interest ( POI ) Popup Alert when BoS , Order block
55 USD
Das RSI / TDI-Warnungs-Dashboard ermöglicht es Ihnen, RSIs (von Ihnen wählbar) für jedes wichtige Paar, das Sie handeln, sofort zu überwachen. Sie können es auf zwei Arten verwenden: 1. Wählen Sie mehrere Zeitrahmen aus und der Strich zeigt Ihnen, wenn es mehrere Zeitrahmen gibt, die über die normalen Handelsbedingungen hinausgehen. Ein großartiger Indikator dafür, dass der Preis in letzter Zeit stark nach oben gedrückt hat, da er über mehrere Zeiträume hinweg ein überkauftes oder überver
49 USD
Der Forex TPA Indikator deckt die wahren Aktionen der Marktmacher auf, immer dann wenn sie passieren. "Kämpfe nicht gegen die Marktmacher an, sondern folge ihnen", ist wohl der beste Rat, den ein Trader bekommen kann. Der TPA Indikator zeigt jedesmal seine Signale an wenn die Bullen definitiv stärker sind als die Bären und umgekehrt. Dieser Indikator wurde VON Tradern FÜR Trader gemacht und ist 100% NICHT NACHZEICHNEND! Signale werden STRENG am Schluss einer Kerze  generiert. Das sagen unsere Ku
168 USD
** All Symbols x All Timeframes scan just by pressing scanner button ** *** Contact me after the purchase to send you instructions and add you in "ABCD scanner group" for sharing or seeing experiences with other users. Introduction This indicator scans AB=CD retracement patterns in all charts. The ABCD is the basic foundation for all harmonic patterns and highly repetitive with a high success rate . The ABCD Scanner indicator is a scanner reversal ABCD pattern that helps you identify when the pr
39 USD
** All Symbols x All Timeframes scan just by pressing scanner button ** ***Contact me after purchase to send you instructions and add you in "123 scanner group" for sharing or seeing experiences with other users. After 15 years of experience in the markets and 3 years of programming, Winner indicator is ready. I would like to share with you! Introduction The 123 Pattern Scanner indicator with a special enhanced algorithm is a very repetitive common pattern finder with a high success rate . Inte
39 USD
Weitere Produkte dieses Autors
WAPV Full MT5
Eduardo Da Costa Custodio Santos
## Arbeiten Sie professionell mit WAPV Full und verfolgen Sie Wo ist das Geld der großen Spieler? Stellen Sie sich vor, Sie hätten ein Werkzeug in der Hand, das allein das Lesen übernimmt der wichtigsten Marktteilnehmer mit den besten Handelsregionen basierend auf Preis- und Volumenanalyse. WAPV Full ist ein komplettes Tool, das sich zu 100 % auf den Betrieb von R. Wyckoff konzentriert Neben der Abbildung von Marktbewegungen in Handelswellen werden auch Abbildungen erstellt den Markt, indem Sie
199 USD
VSA Smart Money
Eduardo Da Costa Custodio Santos
Der VSA Smart Money Indikator verfolgt die Bewegungen von professionellen Tradern, institutionellen Trades und allen Compound Man Bewegungen. Der VSA Smart Money Indicator liest Balken für Balken und ist ein hervorragendes Werkzeug für diejenigen, die VSA, Wyckoff, PVA und andere Analysen verwenden, die Preis und Volumen verwenden. Es gibt 10 Hinweise, die Sie in Ihrem Diagramm finden: *No Demand *Climax *UT Thrust *Top Reversal bar *Stop Volume *No Supply *Spring *Bottom Reversal *Shakeout *Bag
30 USD
Jac Trend
Eduardo Da Costa Custodio Santos
Der JAC Trend Indicator für MT5 wurde entwickelt, um die Identifizierung des Markttrends auf einfache und agile Weise zu erleichtern. # Wenn der JAC-Trend-Indikator grün ist, haben wir einen Markt vor dem Aufwärtstrend. #Wenn der JAC-Trend-Indikator Rot ist, haben wir einen Markt vor dem Trend zum Abwärtstrend. # Wenn der JAC-Trend-Indikator grau ist, haben wir einen Seitenmarkt ohne Stärke. Auf diese Weise haben Sie alle Seiten, die der Markt auf klare und objektive Weise ansprechen kann.
30 USD
Weis Wave Double Side
Eduardo Da Costa Custodio Santos
Der Weis Wave Bouble Side Indicator für MT5 ist Teil des Toolkits (Wyckoff Academy Wave Market) Der Weis Wave Bouble Side Indicator für MT5 wurde basierend auf dem bereits etablierten Weis Wave von David Weis entwickelt. Der Weis Wave Double Side Indikator liest den Markt in Wellen, wie er gemacht wurde von R. Wyckoff im Jahr 1900. Es hilft bei der Identifizierung von Aufwand x Ergebnis, Ursache und Wirkung sowie Angebot und Nachfrage Sein Unterschied besteht darin, dass es unterhalb der Nullach
30 USD
Segmented Volume MT5
Eduardo Da Costa Custodio Santos
Der MT5 Segmented Volume Indikator wurde entwickelt, um den Handel mit Preis- und Volumenanalyse, VSA, VPA, Wyckoff-Methode und Smart Money System zu erleichtern. Segmentiertes Volumen funktioniert auf jedem Markt (Krypto, CFD, Forex, Futures, Aktien...) und funktioniert zu jeder Chart-Zeit. Sehen Sie, wie einfach Ihre Interpretation ist: #Grün: Volumen viel höher als der Marktdurchschnitt #Dunkelrosa: Überdurchschnittliches Volumen #Blau: Positive Normallautstärke #Rot: Negative Normallautstärk
30 USD
JAC Trend Color Candle
Eduardo Da Costa Custodio Santos
The indicator "JAC Trend Color Candle" for Meta Trader 5, was created to visually facilitate the trend for the trader. It is based on three parameters, which identifies the uptrend, downtrend and non-trending market. The colors are trader-configurable, and the average trader-configurable as well. trend parameters cannot be configured as they are the indicator's differential.
30 USD
HLC bar MT5 Wyckoff
Eduardo Da Costa Custodio Santos
Der Indikator "HLC_bar_MT5 Wyckoff" für MT5 wurde erstellt, um die Analyse zum Zeitpunkt des Handels zu erleichtern. Die HLC Bar wurde von Richard Wyckoff verwendet und wird derzeit häufig in "VSA" -Operationen verwendet. Wyckoff stellte fest, dass die Verwendung von High, Low und Close den Graphen viel sauberer und einfacher zu analysieren machte. Der Indikator "HLC_bar_MT5 Wyckoff" ermöglicht: # Ändern Sie die Balkenbreite; # Lassen Sie die Leiste dieselbe Farbe; # Und markieren Sie die Bar, d
30 USD
Z Score Plus MT5
Eduardo Da Costa Custodio Santos
Im Finanzwesen sind Z-Scores ein Maß für die Variabilität einer Beobachtung und können von Händlern verwendet werden, um die Marktvolatilität zu bestimmen. Z-Scores sagen Händlern, ob ein Score für einen bestimmten Datensatz typisch oder atypisch ist. Z-Scores ermöglichen es Analysten auch, Scores aus mehreren Datensätzen anzupassen, um Scores zu erstellen, die genauer miteinander verglichen werden können. # In der Praxis haben wir den ZScore mit Nullpunkt und Oszillationen zwischen 2 und 3 für
30 USD
Trend Everest
Eduardo Da Costa Custodio Santos
Der Trend Everest MT5-Indikator ist ein Trendfolgeindikator, der bei der Entscheidungsfindung hilft. Es basiert auf der Berechnung von ATR, die unterstützen, und dem durchschnittlichen Rumpf. Ein wichtiges Problem ist, dass der Trend Everest MT5-Nominierte nicht neu gestrichen wird, sodass Sie mit größerer Sicherheit Backtests durchführen können. Wenn es grüner High-Trend ist Wenn es Roter Abwärtstrend ist. Nicht, dass der Markt fraktal ist, je länger die Grafikzeit, desto größer ist sein Durchs
30 USD
WAPV adh Supply and Demand
Eduardo Da Costa Custodio Santos
Der WAPV ADH Supply and Demand Indikator ist Teil einer Reihe von Indikatoren namens (Wyckoff Academy Wave Market) Der WAPV ADH Supply and Demand Indicator for MT5 soll die Gewinnerseite zwischen Käufern und Verkäufern identifizieren. Seine Lesung ist sehr einfach, wenn die grüne Linie über der roten Linie liegt, herrscht Nachfrage, wenn die rote Linie über der grünen Linie liegt, herrscht Versorgung. Je positiver die grünen und roten Linien, desto höher die Eingangslautstärke, je näher an Null
40 USD
WAPV adh Supply and Demand Forex
Eduardo Da Costa Custodio Santos
Der WAPV ADH Supply and Demand Forex Indicator ist Teil einer Reihe von Indikatoren namens (Wyckoff Academy Wave Market) Der WAPV ADH Forex Supply and Demand Indicator for MT5 soll die Gewinnerseite zwischen Käufern und Verkäufern identifizieren. Seine Lesung ist sehr einfach, wenn die grüne Linie über der roten Linie liegt, herrscht Nachfrage, wenn die rote Linie über der grünen Linie liegt, herrscht Versorgung. Je positiver die grünen und roten Linien, desto höher die Eingangslautstärke, je nä
40 USD
WAPV Box Effort x Result
Eduardo Da Costa Custodio Santos
WA_PV_BOX_EFFORT X ERGEBNIS für MT5 Der WAPV Box Effort x Result Indicator ist Teil der Package Indicators-Gruppe (Wyckoff Academy Wave Market). Der WAPV Box Effort x Result Indicator für MT5 hilft Ihnen beim Lesen von Preis und Volumen. Seine Lektüre besteht darin, bei der Identifizierung von Aufwand x Ergebnis zu helfen in Wellen, die durch den Graphen erzeugt werden. Der WAPV Box Effort x Result Indicator für MT5 bedeutet, wenn das Kästchen grün ist, dass das Volumen der Nachfrage entspricht,
40 USD
Wapv Price and volume
Eduardo Da Costa Custodio Santos
Der WAPV Price and Volume Indicator for MT5 ist Teil des Toolsets (Wyckoff Academy Wave Market) und (Wyckoff Academy Price and Volume). Der WAPV-Preis- und Volumenindikator für MT5 wurde entwickelt, um die Volumenbewegung auf dem Chart auf intuitive Weise einfach zu visualisieren. Damit können Sie die Momente des Spitzenvolumens und Momente beobachten, in denen der Markt kein professionelles Interesse hat Identifizieren Sie Momente, in denen sich der Markt durch Trägheit bewegt und nicht durch d
40 USD
Weis Wave Double Side Alert
Eduardo Da Costa Custodio Santos
Der Weis Wave Bouble Side Indicator für MT5 ist Teil des Toolkits (Wyckoff Academy Wave Market) Der Weis Wave Bouble Side Indicator für MT5 wurde basierend auf dem bereits etablierten Weis Wave von David Weis entwickelt. Der Weis Wave Double Side Indikator liest den Markt in Wellen, wie es R. Wyckoff im Jahr 1900 tat. Es hilft bei der Identifizierung von Aufwand x Ergebnis, Ursache und Wirkung sowie Angebot und Nachfrage Sein Unterschied besteht darin, dass es unterhalb der Nullachse verwendet w
60 USD
VSA Candle Signal
Eduardo Da Costa Custodio Santos
VSA Candle Signal für MT5 ist Teil des Toolsets (Preis und Volumen der Wyckoff Academy). Seine Funktion besteht darin, die Korrelation von Preis und Volumen bei der Bildung der Kerze zu identifizieren. Seine Erstellung basiert auf den Prämissen von R. Wyckoff , einem Vorläufer in der Analyse von Preis und Volumen. Das VSA-Kerzensignal für MT5 hilft bei der Entscheidungsfindung und hinterlässt Ihre Lektüre klarer und flüssiger. Siehe die Bilder unten.
40 USD
Force and Weakness Trading
Eduardo Da Costa Custodio Santos
Der Force and Weakness Indicator for MT5 Forex ist Teil des (Wyckoff Academy Price and Volume) Toolkits Der Force and Weakness Indicator for MT5 Forex wurde entwickelt, um die Stärke und Schwäche des Volumens auf kumulierte Weise zu identifizieren. Die Vision eines Panoramas zwischen Preis und Volumen ermöglichen. Der Indikator kann als Oszillator und als Histogramm verwendet werden. Wie üblich hat es alle Prämissen der drei Gesetze von R. Wyckoff, wenn es mit dem Preis kombiniert wird: Ursache
40 USD
WAPV Force and Weakness MT5
Eduardo Da Costa Custodio Santos
Der Force and Weakness Indicator for MT5 Real Volume ist Teil des (Wyckoff Academy Price and Volume) Toolsets Der Force and Weakness Indicator for MT5 Real Volume wurde entwickelt, um die Stärke und Schwäche des Volumens auf kumulierte Weise zu identifizieren. Die Vision eines Panoramas zwischen Preis und Volumen ermöglichen. Der Indikator kann als Oszillator und als Histogramm verwendet werden. Als Fantasie hat es alle Prämissen der drei Gesetze von R. Wyckoff , wenn man es mit dem Preis kombin
40 USD
WAPV Weis Wave Chart Forex
Eduardo Da Costa Custodio Santos
Der Weis Wave Chart Forex für MT5 ist ein Preis- und Volumenindikator. Die Lesart von Preis und Volumen wurde durch Richard Demille Wyckoff auf der Grundlage der drei von ihm geschaffenen Gesetze verbreitet: Angebot und Nachfrage, Ursache und Wirkung und Aufwand vs. Ergebnis. Bereits 1900 verwendete R.Wyckoff das Wellendiagramm in seinen Analysen. Viele Jahre später, um 1990, automatisierte David Weis das Wellendiagramm von R. Wyckoff, und heute bringen wir Ihnen die Entwicklung des Wellendiagra
100 USD
WAPV Weis Wave Chart MT5
Eduardo Da Costa Custodio Santos
Das Weis Wave Chart für MT5 ist ein Preis- und Volumenindikator. Die Lesart von Preis und Volumen wurde durch Richard Demille Wyckoff auf der Grundlage der drei von ihm geschaffenen Gesetze verbreitet: Angebot und Nachfrage, Ursache und Wirkung und Aufwand vs. Ergebnis. Bereits 1900 verwendete R.Wyckoff das Wellendiagramm in seinen Analysen. Viele Jahre später, um 1990, automatisierte David Weis das Wellendiagramm von R. Wyckoff, und heute bringen wir Ihnen die Entwicklung des Wellendiagramms vo
100 USD
WA Order Block FVG bos MT5
Eduardo Da Costa Custodio Santos
O  WA Order Block FVG bos MT5  é um indicador com base no estudo de SMC (Smart Money Concepts) criado pelo ICT Inner Circle Trader, eleplota no seu gráfico as informações de Order Blocks em 3 tempos gráficos diferentes, fair Value Gaps e Regiões de Liquidez além do BOS ( Break os Structures), tudo em um só indicador. Dessa forma você não precisa colocar essas informações de forma manual. Agora você tem tudo isso de forma automática em seu gráfico.
55 USD
Auswahl:
Keine Bewertungen
Antwort auf eine Rezension