• Übersicht
  • Bewertungen (1)
  • Diskussion
  • Neue Funktionen

True Day

5

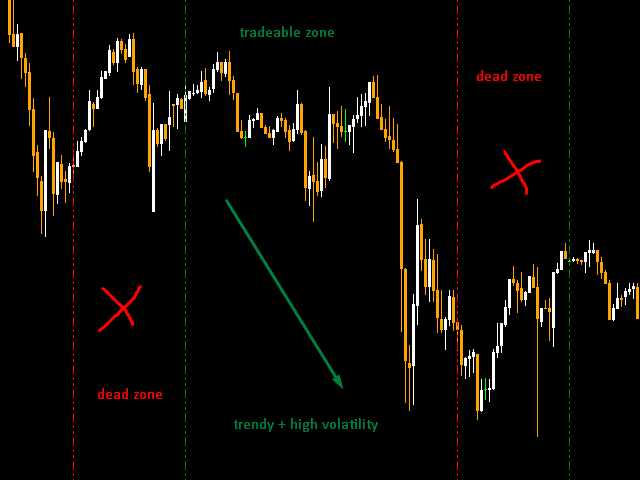
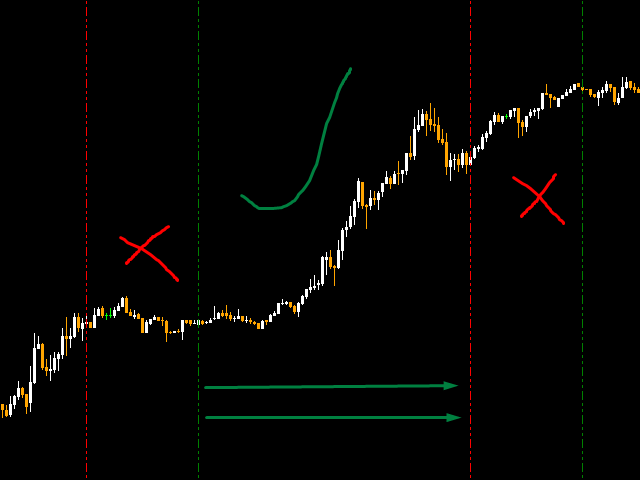
True Days is a tool designed specifically for the trader who wants to catch intraday volatility in price charts. 

True day makes it easier for the trader to avoid trading in the dead zone - a period in time where markets are considered dead or non volatile. The trader can concentrate on finding opportunities only during periods of profound market movements.

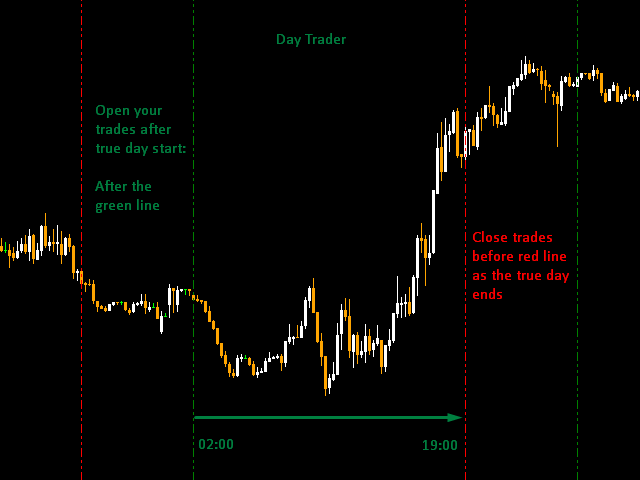
By default the indicator gives you a true day starting at 02:00 to 19:00 hours GMT+2. You can adjust according to your Time Zone.

By deafult the indicator has a green color to indicate true day start time and a red color to indicate true day end time.

Bewertungen 1
coolncalm1
215
coolncalm1 2022.11.30 08:10 
 

Awesome. Thanks

Empfohlene Produkte
Follow The Line MT5
Oliver Gideon Amofa Appiah
4.23 (22)
This indicator obeys the popular maxim that: "THE TREND IS YOUR FRIEND" It paints a GREEN line for BUY and also paints a RED line for SELL. (you can change the colors). It gives alarms and alerts of all kinds. IT DOES NOT REPAINT and can be used for all currency pairs and timeframes. Yes, as easy and simple as that. Even a newbie can use it to make great and reliable trades. NB: For best results, get my other premium indicators for more powerful and reliable signals. Get them here: https://www.m
FREE
Donchian Channel is an indicator created by Richard Donchian. It is formed by taking the highest high and the lowest low of the last specified period in candles. The area between high and low is the channel for the chosen period. Its configuration is simple. It is possible to have the average between the upper and lower lines, plus you have alerts when price hits one side. If you have any questions or find any bugs, please contact me. Enjoy! This is a free indicator, but it took hours to develo
FREE
Free automatic Fibonacci is an indicator that automatically plots a Fibonacci retracement based on the number of bars you select on the BarsToScan setting in the indicator. The Fibonacci is automatically updated in real time as new highest and lowest values appears amongst the selected bars. You can select which level values to be displayed in the indicator settings. You can also select the color of the levels thus enabling the trader to be able to attach the indicator several times with differe
FREE
Are you tired of drawing trendlines every time you're analyzing charts? Or perhaps you would like more consistency in your technical analysis. Then this is for you. This indicator will draw trend lines automatically when dropped on a chart. How it works Works similar to standard deviation channel found on mt4 and mt5. It has 2 parameters: 1. Starting Bar 2. Number of bars for calculation The   starting bar   is the bar which drawing of the trend lines will begin, while the   number of bars for c
FREE
This indicator is the MACD (Moving Average Convergence/Divergence) supporting Virtual Trading mode of Knots Comparer . When the mode is turned on, the indicator will be recalculated based on the displayed candlesticks. When the mode is turned off, the indicator will be recalculated based on the original chart candlesticks. Types of the applied price: Close Open High Low Median Price (HL/2) Typical Price (HLC/3) Weighted Price (HLCC/4) KC-Indicators: KC-MA (Moving Average) KC-ENV (Envelopes) KC
FREE
Important Lines
Terence Gronowski
4.88 (24)
Important Lines Indikator (M1 - M15) Dieser Indikator zeigt Pivot-Lines, vortages Hoch und Tief, vortages Close und das Minimum und Maximum der vorherigen Stunde an. Sie müssen nur diesen einzelnen Indikator in das Diagramm ziehen, um alle diese wichtigen Linien zu haben. Sie können sich das Laden vieler einzelnen Indikatoren ersparen. Warum sind bestimmte Linien beim Traden so wichtig? Vortageshoch und -tief: Diese werden von Händlern beobachtet, die in einer Tages-Chart handeln. Sehr of
FREE
Indicator and Expert Adviser  EA Available in the comments section of this product. Download with Indicator must have indicator installed for EA to work. Mt5 indicator alerts for bollinger band and envelope extremes occurring at the same time. Buy signal alerts occur when A bullish candle has formed below both the lower bollinger band and the lower envelope  Bar must open and close below both these indicators. Sell signal occur when A bear bar is formed above the upper bollinger band and upp
FREE
The idea of a Value Chart indicator was presented in the very good book I read back in 2020 , " Dynamic Trading Indicators: Winning with Value Charts and Price Action Profile ", from the authors Mark Helweg and David Stendahl. The idea is simple and the result is pure genius: Present candlestick Price analysis in a detrended way! HOW TO READ THIS INDICATOR Look for Overbought and Oversold levels. Of course, you will need to test the settings a lot to find the "correct" one for your approach.
FREE
Cumulative Delta MT5
Evgeny Shevtsov
4.48 (46)
The indicator analyzes the volume scale and splits it into two components - seller volumes and buyer volumes, and also calculates the delta and cumulative delta. The indicator does not flicker or redraw, its calculation and plotting are performed fairly quickly, while using the data from the smaller (relative to the current) periods. The indicator operation modes can be switched using the Mode input variable: Buy - display only the buyer volumes. Sell - display only the seller volumes. BuySell -
FREE
PZ Penta O MT5
PZ TRADING SLU
3.8 (5)
The Penta-O is a 6-point retracement harmonacci pattern which usually precedes big market movements. Penta-O patterns can expand and repaint quite a bit. To make things easier this indicator implements a twist: it waits for a donchian breakout in the right direction before signaling the trade. The end result is an otherwise repainting indicator with a very reliable trading signal. The donchian breakout period is entered as an input. [ Installation Guide | Update Guide | Troubleshooting | FAQ | A
FREE
Rainbow MT5
Jamal El Alama
4.33 (3)
Description : Rainbow MT5 is technical indicator based on Moving Average with period 34 and very easy to use. When price crosses above MA and MA changes color to green, then this is a signal to buy. When price crosses below MA and MA changes color to red, then this is a signal to sell. The Expert advisor ( Rainbow EA MT5 ) based on Rainbow MT5 indicator is now available here . MT4 version is available  here .
FREE
PZ Binary Options MT5
PZ TRADING SLU
4.18 (11)
This indicator analyzes price action patterns and helps you to make positive equity decisions in the binary options market. [ Installation Guide | Update Guide | Troubleshooting | FAQ | All Products ] Easy to trade Trade both call and put options No crystal ball and no predictions The indicator is non-repainting The only strategy suitable for binary options is applying a mathematical approach, like professional gamblers do. It is based on the following principles: Every binary option represents
FREE
Tops and Bottoms Indicator
Josue De Matos Silva
4.67 (3)
Tops & Bottoms Indicator FREE   Tops abd Bottoms:   An effective indicator for your trades The tops and bottoms indicator helps you to find  ascending and descending channel formations with indications of ascending and/or descending tops and bottoms. In addition, it  show possibles  opportunities with a small yellow circle when the indicator encounters an impulse formation. This indicator provide to you  more security and speed in making entry decisions. Also test our FREE advisor indicator:
FREE
Reversal Composite Candles
MetaQuotes Ltd.
3.4 (20)
The idea of the system is to indentify the reversal patterns using the calculation of the composite candle. The reversal patterns is similar to the "Hammer" and "Hanging Man" patterns in Japanese candlestick analysis. But it uses the composite candle instead the single candle and doesn't need the small body of the composite candle to confirm the reversal. Input parameters: Range - maximal number of bars, used in the calculation of the composite candle. Minimum - minimal size of the composite can
FREE
This is a buyer and seller aggression indicator that analyzes the shape of each candle and project this data in a histogram form. There are 4 histograms in one. On the front we have two: Upper - Buyer force. Lower - Seller force. At the background we also have two histogram, both with same color. They measure the combined strenght of buyers and sellers. This histograms can be turned off in Input Parameters. It is also possible to have the real or tick volume to help on this force measurement. IN
FREE
High Low Open Close
Alexandre Borela
5 (23)
Wenn Sie dieses Projekt mögen, hinterlassen Sie eine 5-Sterne-Bewertung. Folgen Sie instagram: borelatech Dieser Indikator zieht die offenen, hohen, niedrigen und schließenden Preise für die angegebenen und kann für eine bestimmte Zeitzone eingestellt werden. Dies sind wichtige Ebenen, die von vielen institutionellen und professionellen Händler und kann nützlich sein, um die Orte, wo sie vielleicht mehr aktiv. Die verfügbaren Zeiträume sind: Vorheriger Tag. Vorherige Woche. Vorheriger Monat
FREE
The indicator identifies when a divergence occurs between price and an indicator or oscillator. It identifies both regular and hidden divergences. Combined with your own rules and techniques, this indicator will allow you to create (or enhance) your own powerful system. Features Can detect divergences for the following oscillators/indicators:   MACD, OsMA, Stochastics, RSI, CCI, RVI, Awesome, ADX, ATR, OBV, Composite index, MFI and Momentum. Only one oscillator/indicator can be selected. Draws
FREE
Accurate
Aleksandr Kostusev
5 (1)
The indicator automatically builds patterns of the following types - "Bullish Flag", "Bearish Flag", "Bullish Pennant", "Bearish Pennant", "Bullish Falling Wedge", "Bearish Rising Wedge". The indicator also signals a possible entry point with arrows. The indicator is multi-currency, you can trade everything from cryptocurrencies to indices. The higher the timeframe of the instrument on which the indicator stands, the more accurate the entry point and the price movement will be much longer!  
FREE
Dual RSI
Paul Conrad Carlson
Indicator alerts for Dual Relative strength index rsi. Large rsi preset at 14 is below 30 small rsi preset at 4 is below 10 for buy bullish signals . Large rsi preset are 14 is above 70 small rsi preset at 4 is above 90 for sell bearish signals . Includes mobile and terminal alerts. draws lines when alerts. This indicator can help identify extremes and then the tops or bottoms of those extremes .
FREE
This indicator is especially for the binary trading. Time frame is 1 minutes and exp time 5 or 3 minutes only. You must be use martingale 3 step. So you must put lots size is 10 % at most. You should use Mt2 trading platform to connect with my indicator to get more signal without human working. This indicator wining rate is over 80% but you may get 100% of profit by using martingale 3 step. You should use MT2 Trading Platform to connect meta trader platform and binary platform . You can get mt2
FREE
Weis Waves
Flavio Jarabeck
3.3 (23)
The original author is David Weis, an expert in the Wyckoff Method. The Weis Wave is a modern adaptation of the 1930's Wyckoff Method, another expert in Tape Reading techniques and Chart Analysis. Weis Waves takes market volume and stacks it into waves according to price conditions giving the trader valuable insights about the market conditions. If you want to learn more about this subject you can find tons of videos in YouTube. Just look for "The Wickoff Method", "Weis Wave" and "Volume Spread
FREE
You can download the Full version with more features here . Introduction Harmonic Patterns are best used to predict turning point. Harmonic Patterns give you high win rate and high opportunities for trade in during one day. This indicator detects the best and successful patterns base on Harmonic Trading books by Mr. Scott M.. Main Features Detect the best and   most successful patterns : Gartley, Bat, Crab, Butterfly, Cypher, Shark, Alt_Bat, Deep_Crab Easy-to-use and user friendly indicator Sca
FREE
Forex Indicator Arrows
NGUYEN NGHIEM DUY
1 (1)
Forex Indicator Arrows is an arrow Indicator used as an assistant tool for your trading strategy. The indicator analyzes the standard deviation of bar close for a given period and generates a buy or sell signals if the deviation increases. It good to combo with Martingale EA to follow Trend and Sellect Buy Only/Sell Only for EA work Semi-Automatic. You can use this  Indicator with any EAs in my Products.
FREE
The Donchian Channel Channels are among the most popular tools of technical analysis, as they visually convey to the analyst the limits within which most price movement tends to occur. Channel users know that valuable information can be obtained at any time, whether prices are in the central region of a band or close to one of the border lines. One of the best known techniques to explore these concepts is Bollinger Bands. However, John Bollinger was not the only one to research the applicatio
FREE
PZ Pivot Points MT5
PZ TRADING SLU
4.95 (21)
This indicator displays pivot points in the chart, including historical vales, and supports many calculation modes for Pivot Points and S/R levels. [ Installation Guide | Update Guide | Troubleshooting | FAQ | All Products ] It plots historical levels for backtesting purposes It allows you to select the reference timeframe It implements different Pivot Point calculation modes It implements different SR calculation modes It implements customizable colors and sizes Calculation Modes The indi
FREE
Tabajara V5
Flavio Jarabeck
4.88 (33)
Metatrader 5 version of the famous Andre Machado's Tabajara indicator. If you don't know Andre Machado's Technical Analysis work you don't need this indicator... For those who need it and for those several friend traders who asked this porting from other platforms, here it is... FEATURES 8-period Moving Average 20-period Moving Average 50-period Moving Average 200-period Moving Average Colored candles according to the inflexion of the 20-period MA SETTINGS You can change the Period of all M
FREE
Automatic Trendlines
Pasi Hakamaki
4.63 (41)
Der Indikator zeichnet Trendlinien im Diagramm. Dieser Indikator hat sechs Eingänge. Der Benutzer kann alternative Beschriftungen für beide Zeilen angeben. Wenn mehrere Instanzen des Indikators verwendet werden, müssen sich die Beschriftungen unterscheiden. Der Benutzer kann die Breite und Farbe der Linien und die Tiefe festlegen, um festzulegen, welche signifikanten Peaks verwendet werden sollen. Zum Beispiel setzt Depth = 10 Trendlinien unter Verwendung der aktuellen Spitzen und Täler, die rec
FREE
Welcome to our Price Wave Pattern MT5 --(ABCD Pattern)-- The ABCD pattern is a powerful and widely used trading pattern in the world of technical analysis. It is a harmonic price pattern that traders use to identify potential buy and sell opportunities in the market. With the ABCD pattern, traders can anticipate potential price movements and make informed decisions on when to enter and exit trades. MT4 Version : Price Wave Pattern MT4  Features :  Automatic detection of ABCD patterns. Bul
FREE
Pivot Point Fibo RSJ ist ein Indikator, der die Unterstützungs- und Widerstandslinien des Tages mithilfe von Fibonacci-Kursen verfolgt. Dieser spektakuläre Indikator erzeugt bis zu 7 Unterstützungs- und Widerstandsebenen durch Pivot Point unter Verwendung von Fibonacci-Kursen. Es ist fantastisch, wie die Preise jedes Niveau dieser Unterstützung und dieses Widerstands respektieren, wo es möglich ist, mögliche Einstiegs- / Ausstiegspunkte einer Operation zu erkennen. Merkmale Bis zu 7 Unter
FREE
PZ Three Drives MT5
PZ TRADING SLU
4.6 (5)
This indicator finds Three Drives patterns. The Three Drives pattern is a 6-point reversal pattern characterised by a series of higher highs or lower lows that complete at a 127% or 161.8% Fibonacci extension. It signals that the market is exhausted and a reversal can happen. [ Installation Guide | Update Guide | Troubleshooting | FAQ | All Products ] Customizable pattern sizes Customizable colors and sizes Customizable breakout periods Customizable 1-2-3 and 0-A-B ratios It implements visua
FREE
Käufer dieses Produkts erwarben auch
ICT, SMC, SMART MONEY CONCEPTS, SMART MONEY, Smart Money Concept, Support and Resistance, Trend Analysis, Price Action, Market Structure, Order Blocks, BOS/CHoCH,   Momentum Shift, HH/LL/HL/LH,    Fair Value Gap, FVG,  Premium  &   Discount   Zones, Fibonacci Retracement, OTE, Buy Side Liquidity, Sell Side Liquidity, BSL/SSL Taken, Equal Highs & Lows, MTF, Multiple Time Frame, BigBar, HTF OB, HTF Market Structure,  Liquidity Voids, Long Wicks, Candle Timer, Fractals, ZigZag, Time Zone, Market S
63 USD
Gold Stuff mt5
Vasiliy Strukov
4.97 (92)
Gold Stuff mt5-Ein Trendindikator, der speziell für Gold entwickelt wurde, kann auch auf allen Finanzinstrumenten verwendet werden. Der Indikator wird nicht neu gezeichnet und verzögert sich nicht. Empfohlener Zeitrahmen H1. WICHTIG! Kontaktieren Sie mich sofort nach dem Kauf, um Anweisungen und Bonus zu erhalten! DATEN Draw Arrow - inkl.aus. zeichnen von Pfeilen in einem Diagramm. Alerts-inkl.aus.akustische Warnungen. E - mail notification-inkl.aus. benachrichtigungen per E-Mail. Puch-
50 USD
Dies ist ein Indikator für MT5, der genaue Signale für den Einstieg in einen Handel ohne Repainting (Neuzeichnen) liefert. Er kann auf alle Finanzwerte angewendet werden: Forex, Kryptowährungen, Metalle, Aktien, Indizes. Er liefert ziemlich genaue Schätzungen und sagt Ihnen, wann es am besten ist, eine Position zu eröffnen und zu schließen. Sehen Sie sich das Video (6:22) mit einem Beispiel für die Verarbeitung nur eines Signals an, das sich für den Indikator gelohnt hat! Die meisten Händler ver
125 USD
Trend Screener Pro MT5
STE S.S.COMPANY
4.97 (36)
Trendindikator, bahnbrechende, einzigartige Lösung für Trendhandel und -filterung mit allen wichtigen Trendfunktionen in einem Tool! Es handelt sich um einen 100 % nicht neu zu malenden Multi-Timeframe- und Multi-Währungs-Indikator, der für alle Symbole/Instrumente verwendet werden kann: Forex, Rohstoffe, Kryptowährungen, Indizes und Aktien. Trend Screener ist ein effizienter Trendfolgeindikator, der Pfeiltrendsignale mit Punkten im Diagramm liefert. Die Funktionen, die im Trendanalysator-Indika
50 USD
Blahtech Supply Demand MT5
Blahtech Limited
4.45 (11)
Supply Demand uses previous price action to identify potential imbalances between buyers and sellers. The key is to identify the better odds zones, not just the untouched ones. Blahtech Supply Demand indicator delivers functionality previously unavailable on any trading platform. This 4-in-1 indicator not only highlights the higher probability zones using a multi-criteria strength engine, but also combines it with multi-timeframe trend analysis, previously confirmed swings and engulfing detecto
142 USD
AW Trend Predictor MT5
Alexander Nechaev
5 (24)
Die Kombination von Trend- und Aufschlüsselungsebenen in einem System. Ein fortschrittlicher Indikatoralgorithmus filtert Marktrauschen, bestimmt den Trend, Einstiegspunkte sowie mögliche Ausstiegsniveaus. Indikatorsignale werden in einem Statistikmodul aufgezeichnet, das es Ihnen ermöglicht, die am besten geeigneten Tools auszuwählen, die die Wirksamkeit der Signalhistorie zeigen. Der Indikator berechnet Take-Profit- und Stop-Loss-Marken. Handbuch und Anleitung ->   HIER   / MT4-Version ->   H
55 USD
Advanced Supply Demand MT5
Bernhard Schweigert
4.36 (11)
Derzeit 33% Rabatt! Die beste Lösung für jeden Anfänger oder erfahrenen Händler! Dieser Indikator ist ein einzigartiges, qualitativ hochwertiges und erschwingliches Trading-Tool, da wir eine Reihe von proprietären Funktionen und eine neue Formel integriert haben. Mit diesem Update werden Sie in der Lage sein, doppelte Zeitrahmenzonen anzuzeigen. Sie können nicht nur einen höheren TF (Zeitrahmen) anzeigen, sondern sowohl den Chart-TF als auch den höheren TF: SHOWING NESTED ZONES. Alle Supply Dema
199 USD
Werden Sie Breaker Trader und profitieren Sie von Änderungen der Marktstruktur, wenn sich der Preis umkehrt. Der Order Block Breaker Indikator zeigt an, wann sich eine Trend- oder Preisbewegung der Erschöpfung nähert und bereit ist, sich umzukehren. Es weist Sie auf Änderungen in der Marktstruktur hin, die normalerweise auftreten, wenn eine Umkehrung oder ein größerer Rückzug bevorsteht. Der Indikator verwendet eine proprietäre Berechnung, die Ausbrüche und Preisdynamik identifiziert. Jedes
49 USD
Royal Wave Pro M5
Vahidreza Heidar Gholami
5 (2)
Royal Wave is a Trend-Power oscillator which has been programmed to locate and signal low-risk entry and exit zones. Its core algorithm statistically analyzes the market and generates trading signals for overbought, oversold and low volatile areas. By using a well-designed alerting system, this indicator makes it easier to make proper decisions regarding where to enter and where to exit trades. Features Trend-Power Algorithm Low risk Entry Zones and Exit Zones Predictions for Overbought and Over
129 USD
Matrix Arrow Indicator MT5
Juvenille Emperor Limited
5 (11)
Matrix Arrow Indicator MT5   ist ein einzigartiger 10-in-1-Trend, der zu   100 % nicht neu gezeichnet   werden kann. Multi-Timeframe-Indikator, der für alle Symbole/Instrumente verwendet werden kann:   Forex ,   Rohstoffe ,   Kryptowährungen ,   Indizes ,   Aktien .  Der  Matrix Arrow Indicator MT5  wird den aktuellen Trend in seinen frühen Stadien bestimmen und Informationen und Daten von bis zu 10 Standardindikatoren sammeln, die sind: Durchschnittlicher Richtungsbewegungsindex (ADX) Rohstoff
75 USD
Das ADR Alert Dashboard zeigt Ihnen auf einen Blick, wo der Preis aktuell im Verhältnis zu seiner normalen durchschnittlichen Tagesspanne gehandelt wird. Sie erhalten sofortige Benachrichtigungen per Pop-up, E-Mail oder Push, wenn der Preis seine durchschnittliche Spanne und darüber liegende Niveaus Ihrer Wahl überschreitet, sodass Sie schnell in Pullbacks und Umkehrungen einsteigen können. Das Dash ist so konzipiert, dass es auf einem leeren Diagramm platziert werden kann und einfach im Hinter
49 USD
Stargogs Spike Catcher
Lorenzo Edward Beukes
5 (6)
Stargogs Spike Catcher V3 This Indicator is Developed To milk the BOOM and CRASH indices . Send me Message if you need any help with the indicator.  CHECK OUT THE STARGOGS SPIKE CATCHER EA/ROBOT V3: CLICK HERE ALSO CHECK OUT SECOND TO NONEFX SPIKE CATCHER:   CLICK HERE STARGOGS SPIKE CATCHER V3 WHATS NEW! Brand New Strategy. This is the Indicator you need for 2023. The Indicator Gives you an Entry at a time when conditions are met and you should use TP & SL. New Trendline that changes color in
100 USD
Der ADR-Umkehrindikator zeigt Ihnen auf einen Blick, wo der Preis derzeit im Verhältnis zu seiner normalen durchschnittlichen Tagesspanne gehandelt wird. Sie erhalten sofortige Benachrichtigungen per Pop-up, E-Mail oder Push, wenn der Preis seine durchschnittliche Spanne und darüber liegende Niveaus Ihrer Wahl überschreitet, sodass Sie schnell in Pullbacks und Umkehrungen einsteigen können. Der Indikator zeichnet horizontale Linien auf dem Chart an den durchschnittlichen täglichen Range-Extreme
49 USD
Royal Scalping Indicator M5
Vahidreza Heidar Gholami
5 (8)
Royal Scalping Indicator is an advanced price adaptive indicator designed to generate high-quality trading signals. Built-in multi-timeframe and multi-currency capabilities make it even more powerful to have configurations based on different symbols and timeframes. This indicator is perfect for scalp trades as well as swing trades. Royal Scalping is not just an indicator, but a trading strategy itself. Features Price Adaptive Trend Detector Algorithm Multi-Timeframe and Multi-Currency Trend Low
149 USD
Sind Sie es leid, Unterstützungs- und Widerstandslinien zu zeichnen? Der Unterstützungswiderstand ist ein Multi-Zeitrahmen-Indikator, der Unterstützungs- und Widerstandslinien mit einer sehr interessanten Wendung automatisch erkennt und zeichnet: Wenn das Preisniveau im Laufe der Zeit getestet wird und seine Bedeutung zunimmt, werden die Linien dicker und dunkler. [ Installationsanleitung | Update-Anleitung | Fehlerbehebung | FAQ | Alle Produkte ] Steigern Sie Ihre technische Analyse über Nacht
99 USD
Introduction to X3 Chart Pattern Scanner X3 Cherart Pattern Scanner is the non-repainting and non-lagging indicator detecting X3 chart patterns including Harmonic pattern, Elliott Wave pattern, X3 patterns, and Japanese Candlestick patterns. Historical patterns match with signal patterns. Hence, you can readily develop the solid trading strategy in your chart. More importantly, this superb pattern scanner can detect the optimal pattern of its kind. In addition, you can switch on and off individu
250 USD
Automated Trendlines MT5
Georgios Kalomoiropoulos
Trendlinien sind das wichtigste Werkzeug der technischen Analyse im Devisenhandel. Leider zeichnen die meisten Händler sie nicht richtig. Der automatische Trendlinien-Indikator ist ein professionelles Tool für ernsthafte Trader, das Ihnen hilft, die Trendbewegung der Märkte zu visualisieren. Es gibt zwei Arten von Trendlinien Bullische Trendlinien und Bärische Trendlinien. Im Aufwärtstrend wird die Forex-Trendlinie durch die niedrigsten Swing-Punkte der Preisbewegung gezogen. Wenn man m
99 USD
Market Profile defines a number of day types that can help the trader to determine market behaviour. A key feature is the Value Area, representing the range of price action where 70% of trading took place. Understanding the Value Area can give traders valuable insight into market direction and establish the higher odds trade. It is an excellent addition to any system you may be using. Blahtech Limited presents their Market Profile indicator for the MetaTrader community. Inspired by Jim Dalton’s
142 USD
Dieses Dashboard ist ein Warntool zur Verwendung mit dem Indikator für die Umkehrung der Marktstruktur. Sein Hauptzweck besteht darin, Sie auf Umkehrmöglichkeiten in bestimmten Zeitrahmen und auch auf die erneuten Tests der Warnungen (Bestätigung) aufmerksam zu machen, wie es der Indikator tut. Das Dashboard ist so konzipiert, dass es auf einem eigenen Chart sitzt und im Hintergrund arbeitet, um Ihnen Benachrichtigungen zu Ihren ausgewählten Paaren und Zeitrahmen zu senden. Es wurde entwickelt,
49 USD
Owl Smart Levels MT5
Sergey Ermolov
5 (1)
Indikator-Leitfaden  |  Owl Smart Levels-Strategie  |   MT4-Version  |  Wie installiert man?   |   FAQ Der Owl Smart Levels Indikator ist ein komplettes Handelssystem innerhalb eines Indikators, der so beliebte Marktanalysetools wie die fortschrittlichen Fraktale von Bill Williams , Valable ZigZag, das die richtige Wellenstruktur des Marktes aufbaut, und Fibonacci-Levels , die die genauen Einstiegslevels markieren, enthält in den Markt und Orte, um Gewinne mitzunehmen. 7 tage Promotion - bis zu
107 USD
Strong Support mt5
Vasiliy Strukov
5 (5)
Unterstützungs- und Widerstandsniveaus sind seit langem ein mächtiges Werkzeug für die Marktanalyse. Der Strong Support Indikator baut Unterstützungsniveaus auf lokalen Preistiefs und Widerstandsniveaus auf lokalen Preishochs auf. Meine anderen Entwicklungen finden Sie hier Es wird empfohlen, in Verbindung mit einem Trendindikator wie Gold Stuff zu verwenden, um den Trend zu handeln und gleichzeitig Konsolidierungs- oder Umkehrzonen zu definieren sowie Stop-Loss und Take-Profit auf Unterstü
50 USD
Support And Resistance Screener ist ein Level-Indikator für MetaTrader, der mehrere Tools innerhalb eines Indikators bietet. Die verfügbaren Werkzeuge sind: 1. Marktstruktur-Screener. 2. Bullische Pullback-Zone. 3. Bärische Pullback-Zone. 4. Tägliche Pivot-Punkte 5. wöchentliche Pivots-Punkte 6. monatliche Pivots-Punkte 7. Starke Unterstützung und Widerstand basierend auf harmonischem Muster und Volumen. 8. Zonen auf Bankebene. ZEITLICH BEGRENZTES ANGEBOT: HV Support and Resistance Indicator ist
50 USD
Offer 249 down from 350 for the next 3 copies. then back to 350 $ Are you tired of using outdated indicators that leave you guessing where to set your profit targets? Look no further than the AK CAP Opening Range Breakout Indicator. This powerful tool is backed by a US patent and has already helped countless traders pass funded challenges like FTMO. We use it daily on our prop traders and internal funds, and now it's available to you as well. The calculation behind the indicator is incredibly
249 USD
Trend Scanner mt5 GS
Vasiliy Strukov
5 (6)
Trend Scanner scannt Markttrends aus Multi-Symbolen und Multi-Time-Frames und zeigt sie auf einem beweglichen Panel auf dem Chart an, den er zur Analyse verwendet. Der Händler kann mehrere Paare seiner Wahl zur Anzeige auswählen. Trend Scanner ist ein großartiges Tool, um die Richtung des Trends zu sehen, und kann für den manuellen Handel oder den EA-Handel verwendet werden, indem nur Kauf- oder Verkaufsaufträge gemäß dem Trend zugelassen werden. Echtzeit-Ergebnisse können hier eingesehen wer
50 USD
Auto Order Block with break of structure Detect Break of Structure , Mark Order Block and draw Entry / Stop and Risk to Reward lines when Order block is touch by price with Alert. Trend is Manually set to filter signals in a direction by a button on the chart. Entry / Stop and Risk to Reward lines can also be switch on / off by button on chart. Futures Auto Mark Break of Structure Auto Mark Order block Auto Mark higher time frame Point Of  Interest ( POI ) Popup Alert when BoS , Order block
55 USD
Market Structure MT5
Reza Aghajanpour
5 (1)
**   All Symbols   x   All Timeframes   scan just by pressing scanner button ** *** Contact me immediately after the purchase to send you instructions and add you in "Market Structure group" for sharing or seeing experiences with other users. CURRENT PRICE $39..... Future Price $200 Introduction: Market structure is important for both new and professional traders since it can influence the liquidity and price action of a market. It’s also one of the most commonly used techniques to understand tr
39 USD
Italo Volume Indicator MT5
Italo Santana Gomes
5 (9)
BUY INDICATOR AND GET EA FOR FREE AS A BONUS + SOME OTHER GIFTS! ITALO VOLUME INDICATOR  is the best volume indicator ever created, and why is that? The Indicator works on all time-frames and assets, indicator built after 6 years of experience on forex and many other markets. You know many volume indicators around the internet are not complete, does not help, and it's difficult to trade, but the Italo Volume Indicator is different , the Italo Volume Indicator shows the wave volume, when market
65 USD
Automatisierte Angebots- und Nachfragezonen der nächsten Generation. Neuer und innovativer Algorithmus, der bei jedem Diagramm funktioniert. Alle Zonen werden dynamisch entsprechend der Preisbewegung des Marktes erstellt. ZWEI ARTEN VON WARNUNGEN --> 1) WENN DER PREIS EINE ZONE ERREICHT 2) WENN EINE NEUE ZONE BILDET WIRD Sie erhalten keinen weiteren nutzlosen Indikator. Sie erhalten eine vollständige Handelsstrategie mit nachgewiesenen Ergebnissen.     Neue Eigenschaften:    
149 USD
Divergenzen sind schwierig zu finden und seltener anzutreffen. Sie sind eines der zuverlässigsten Handelsszenarien. Dieser Indikator sucht automatisch mit Ihrem bevorzugten Oszillator nach regelmäßigen und versteckten Abweichungen. [ Installationsanleitung | Update-Anleitung | Fehlerbehebung | FAQ | Alle Produkte ] Einfach zu handeln Findet regelmäßige und versteckte Abweichungen Unterstützt viele bekannte Oszillatoren Implementiert Handelssignale basierend auf Ausbrüchen Zeigt geeignete
125 USD
PZ Day Trading MT5
PZ TRADING SLU
2.6 (5)
Dieser Indikator erkennt Preisumkehrungen im Zick-Zack, wobei nur Preisaktionsanalysen und ein Donchian-Kanal verwendet werden. Es wurde speziell für den kurzfristigen Handel entwickelt, ohne dass ein Nachlackieren oder ein Backpainting erforderlich ist. Es ist ein fantastisches Werkzeug für clevere Trader, die darauf abzielen, das Timing ihrer Operationen zu verbessern. [ Installationsanleitung | Update-Anleitung | Fehlerbehebung | FAQ | Alle Produkte ] Erstaunlich einfach zu handeln Es bi
125 USD
Weitere Produkte dieses Autors
Order Block Locator
Aurthur Musendame
4.48 (31)
The order block locator is powered by three main search algorithms thar can be used to find order blocks. Simple Fractal Search Algorithm Naive Fractal Movers Algorithm Candle Transition Algorithm You can even combine the power of your 2 favourite algorithms and get the best of both worlds: Mixed Algorithm (Naive Fractal + Candle transition) Mixed Algorithm (Simple Fractal + Candle Transition Simple Fractal Search Algorithm The algorithm finds the fractals based on your setting paramers fo
FREE
Day Trader WorkTime
Aurthur Musendame
4.91 (11)
The worktime indicator helps you identify the most important times to day to trade the currency pairs. It was created based on the ICT day trading free tutorials that are freely vailable on his youtube channel.  You can use this indicator together with my other indicators that i have shared freely with you like the true day, custom periods, daily month, weekly open lines - they together complement each other very well. Nuggets from this indicator: 1. Draws the asian session box showinng you th
FREE
Dail Session Open Lines
Aurthur Musendame
4.71 (7)
Daily session open lines shows the traders three important trading session opens. By default it is set up to show you: Zero GMT Open Line London Open Session Line New York Open Session Line The default times are set according to GMT+2 and as such you are able to change and customise according to your specific time zone. The Indicator is usefull specially for the trader who trades the London and NewYork sessions.
FREE
The Higher timeframe candle tracker is used to get a glimpse of what the selected higher time frame candle is like. It plot the candle after the current price. It can come in handy for day traders and short term traders that often worry about how the current higher timeframe candle may look like. You can select the higher time frame from the 3 options provided: 1: Daily 2: Weekly 3: Monthly By default the color for bears is red and for bulls is green.
FREE
One Moving Average
Aurthur Musendame
3.33 (3)
This indicator was created based on posts from forex factory thread titled There is no Magic Moving Average - You need only one - by @andose2 a.k.a Andrei Florin. If you want to know about how to use this trading strategy please go and read  https://www.forexfactory.com/thread/691864-there-is-no-magic-moving-average-you. Note: Below are extracts some of the posts . Estabilish a trend, based on Market Cycles, then go   only long in the Markup Phase   and   only short in the Decline phase ,  
FREE
Super Fractals
Aurthur Musendame
5 (2)
Think of the Super Fractal Indicator as the Bill WIlliams Indicator on Steroids. Indicator Abilities: 1. Adjust Candle around Fractal High or Low. 2. Adjust Lookback period and only plot for a specific number of history candles avoiding cluttering your trading desk. 3. The Indicator uses buffers so you call and use it from any EA. Note : The higher the candles around Fractal, the stronger the Turning point anfd viceversa is true.
FREE
The Monthly Weekly Open Line is an indicator that plots: The current month open line that will extend till the last week on the month. Weekly lines that span the look back days period that you have set . Each line will extend from the respective weekly Monday zero GMT till friday of the respective week. Monthly and Weekly open lines can be used to build very powerfull anc consistent trading strategies. They act as natural S/R price barriers.
FREE
HoD LoD Time Price Studies
Aurthur Musendame
4.33 (3)
High of the Day and Low of the day Time and Price Fractal Studies is an indicator that will help you identify certain patterns that tend to repeat themseleves at certail times of the day or at certain prices.  It is used to study Daily Highs ad Lows in relation to time and price.  You will get to answer certail questions like: At what time of day does this market usually turn around. At what price does the market turn. Is it at round numbers etc
FREE
Time and Price Fractal Studies is an indicator that will help you identify certain patterns that tend to repeat themseleves at certail times of the day or at certain prices.  It is used to study Fractal Highs ad Lows in relation to time and price.  You will get to answer certail questions like: At what time of day does this market usually turn around. At what price does the market turn. Is it at round numbers etc.
FREE
Period Seperators
Aurthur Musendame
5 (1)
The daily custom period seperator indicator allows you to draw period seperators for your lower time frame charts H1 and below.  The period seperator gives you options to set different colors for: Weekend - saturday/sunday Monday and Friday  Midweek - Tuesday to Thursday. By default the indicator plots the period seperator line at 00:00 hours for the last 10 days. Use Cases: The indicator can be used as a colourful alternative period seperator to the default MT5 period seperator. For those t
FREE
Template Name
Aurthur Musendame
5 (1)
Template name allows you to write custom text that will show up on your charts. It allows you to position the text anywhere including selecting any color that you prefer. You can position the text at any of the 4 corners of your chart screen. This custom text can aid as a watermark for your screen shots. This text can act as a unique and true signature for your charts.
FREE
Auswahl:
coolncalm1
215
coolncalm1 2022.11.30 08:10 
 

Awesome. Thanks

Antwort auf eine Rezension
Version 1.1 2021.09.20
Fixed Bug where future indicator plotting true day lines were distorted