Swing Continuation Pattern Free
- Indikatoren
- Nesimeye Oswald
- Version: 1.5
- Aktualisiert: 11 Juli 2021
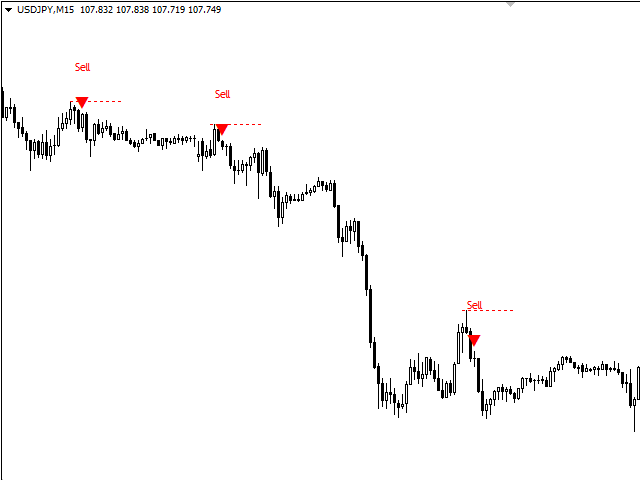
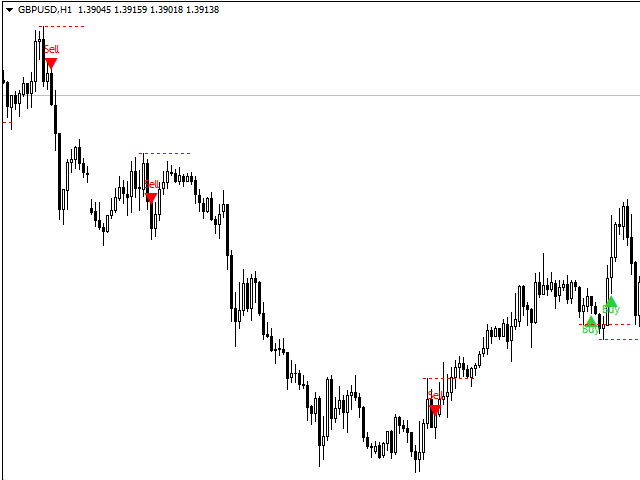
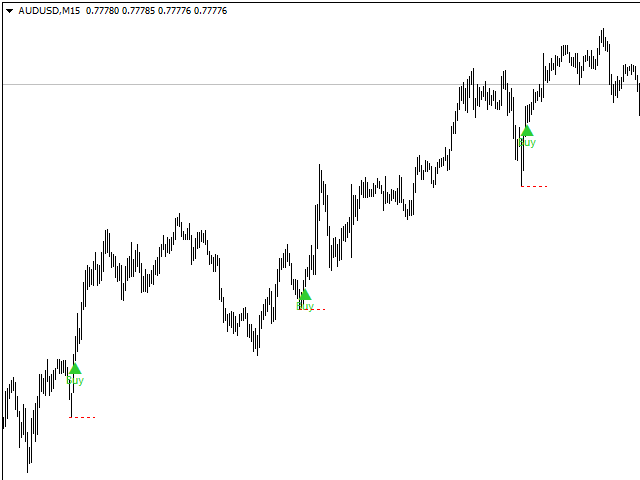
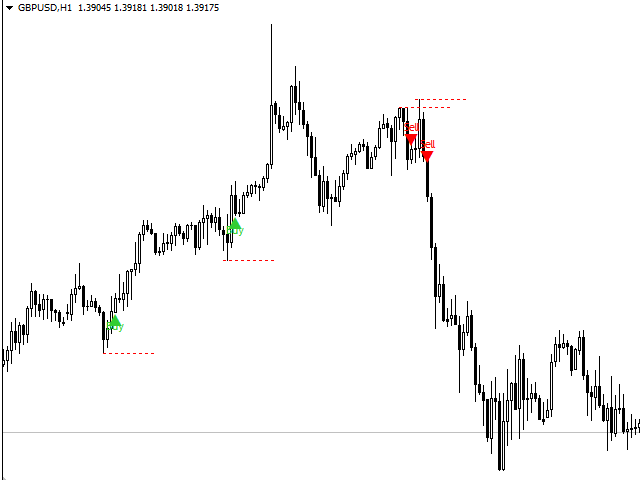
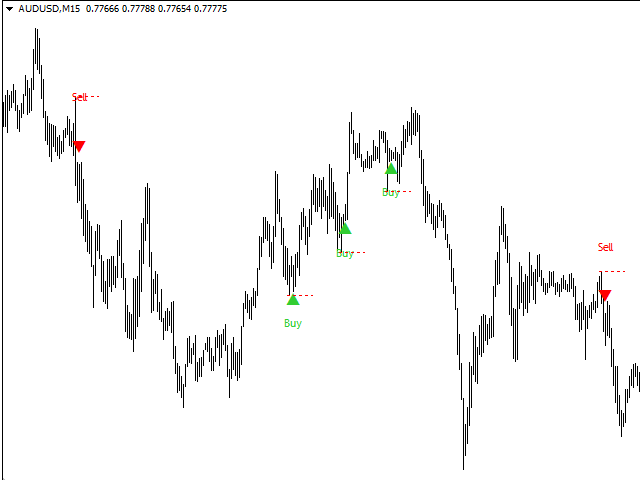
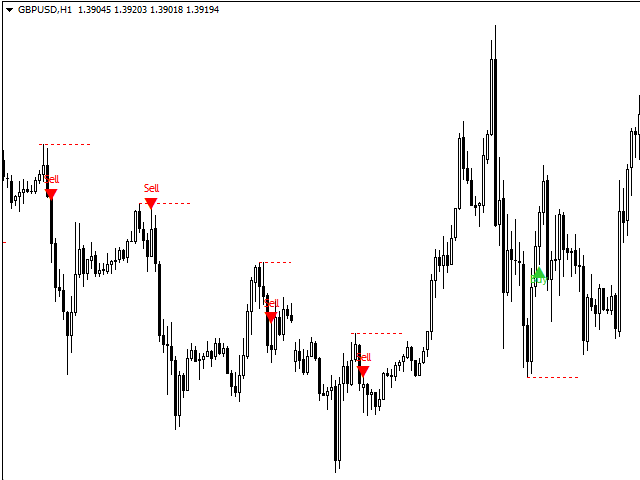
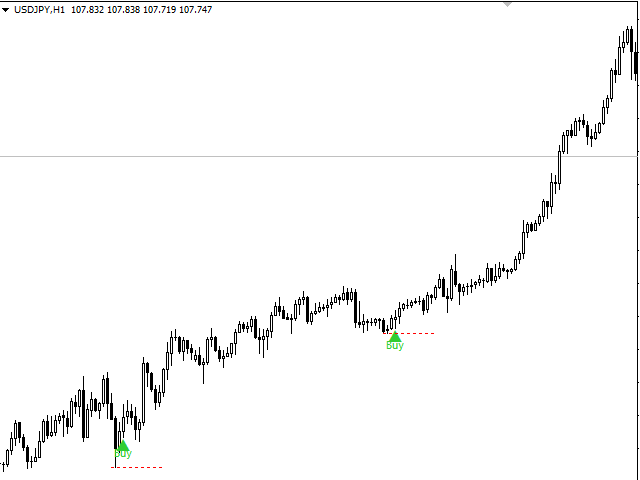
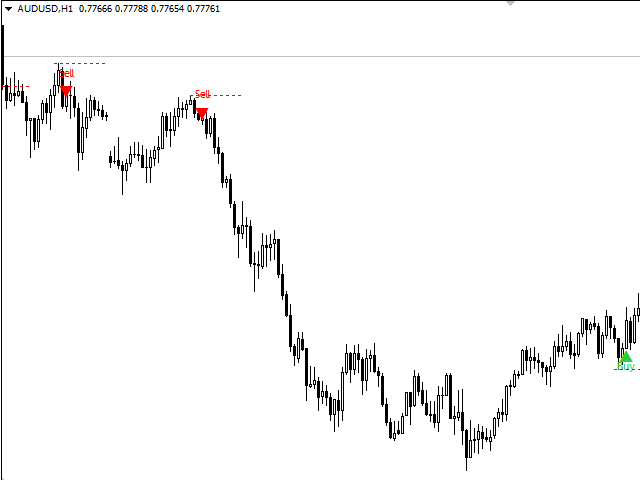
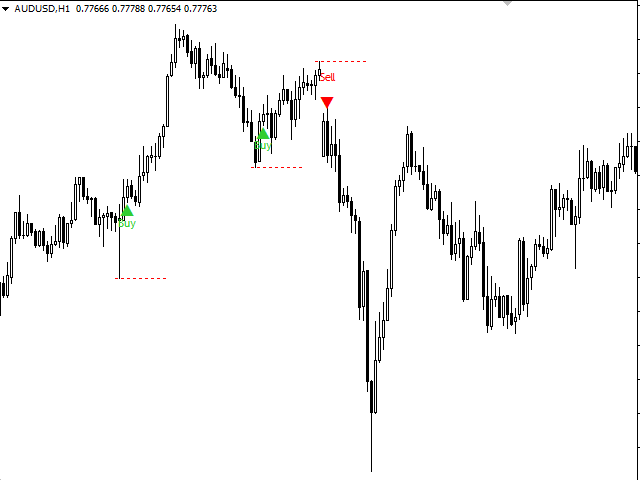
The swing continuation pattern happens in a trend direction after a short reversal / pull back . As the name suggests , these patterns occurs along the swing high and swing lows of a trend , this makes the patterns very low risk patterns with potential high rewards .
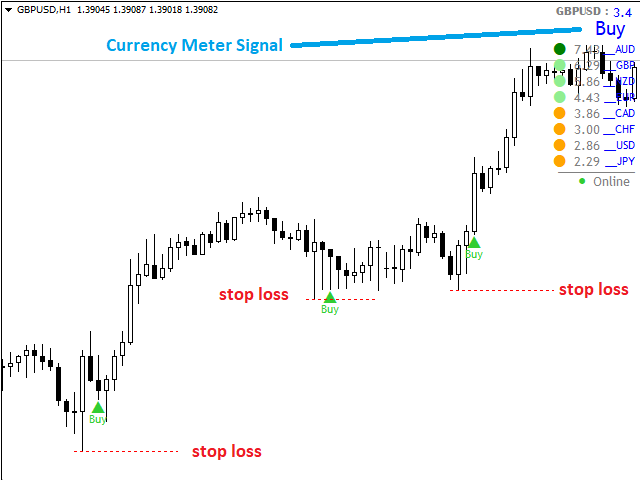
The swing continuation indicator also combines Currency Meter as a filter for its execution. The idea is to go with both the price trend flow and currency trend flow. Which means the price action must be supported by the currency strength.
The currency meter feature makes this indicator a very successful model that can spot and filter only highly profitable signals.
FEATUREs
1. Non-Repaint
2. Non-Backpaint
3. Currency Meter Dashboard
4. Stop Loss Level Indicated
HOW TO USE
Step 1. Can be used on M15 ( 15 minutes ) GBPUSD pair only.
Step 2. Wait for swing continuation signal
Step 3. Confirm continuation signal with currency meter
Step 4. Enter trade and set stop loss with stop loss level.
We Are Social
Join our Telegram Channel To get free daily signals and faster support on our products .
Also get daily trading tips , news and advice . Kindly Follow Us : Click Here


Nice pattern indi