Range Exhaustion MT5
- Indikatoren
- Robert Gerald Wood
- Version: 1.0
- Aktivierungen: 10
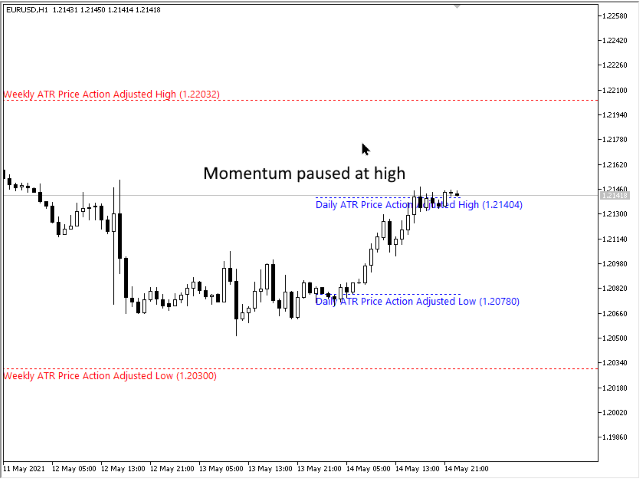
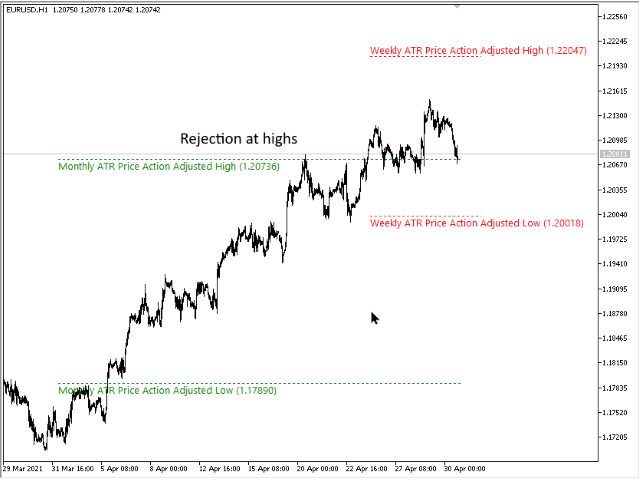
Spannenerschöpfung tritt auf, wenn der Preis die erwartete Spanne für den aktuellen Zeitraum erreicht oder überschreitet. Auf diesen Niveaus beginnt der Preis im Vergleich zu früher im Berichtszeitraum an Dynamik zu verlieren, daher ist es ein guter Zeitpunkt, um sicherzustellen, dass Sie keine neuen Positionen eingehen.
Dieser Indikator zeigt Ihnen, wo dies in Ihrem Diagramm wahrscheinlich passieren wird, und zeigt die Niveaus für tägliche, wöchentliche und monatliche Zeiträume an.
Wenn Sie sehen, dass der Preis diese Erschöpfungsniveaus überschreitet, sagt Ihnen das, dass das Momentum hinter der Bewegung sehr stark ist und wahrscheinlich auf das höhere Zeitrahmenniveau zusteuert.
Der Indikator kann je nach Ihren Vorlieben die Berechnung der Average True Range (ATR) oder der Average Range (ADR) verwenden. Standardmäßig verwenden wir ATR, da wir finden, dass es auf Forex-Charts besser funktioniert, aber ADR hat einen Vorteil bei aktienbasierten Indizes und Symbolen.
Der Indikator verfügt über eine Reihe von unten beschriebenen Zeichnungsmodi, mit denen Sie ihn an Ihre Bedürfnisse anpassen können.
EINSTELLUNGEN
Berechnungsmodus
Wählen Sie für die Berechnung der Werte zwischen AverageTrueRange (ATR) oder AverageDailyRange (ADR).
Zeichnungsmodus
Der Indikator kann auf verschiedene Arten angezeigt werden.
- Zeichnen Sie eine preisbereinigte Linie - Das Niveau passt sich im Laufe des Zeitraums an, basierend auf den erreichten Höchst- und Tiefstwerten. Dies ist die standardmäßige und am häufigsten verwendete Methode.
- Erwartetes Maximum zeichnen - Das Niveau ist ein fester Wert, dh der Schlusskurs der letzten Periode plus oder minus dem ATR- oder ADR-Wert.
- Zeichnen Sie beide Linien - Zeigt die beiden obigen Zeilen an.
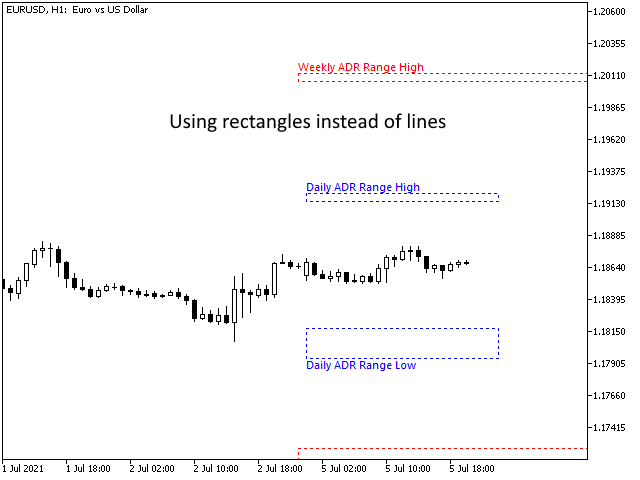
- Rechtecke zeichnen - Zeigt ein einzelnes Rechteck an, in dem die oberen und unteren Linien die preisbereinigten und erwarteten Höchst-/Mindestwerte darstellen
Berichtszeitraum
Der bei der Berechnung der ATR/ADR-Werte zu verwendende Zeitraum.
ShowDailyLimits
Wenn wahr, werden die täglichen Erschöpfungsstufen angezeigt.
Wochenlimits anzeigen
Wenn wahr, werden die wöchentlichen Erschöpfungsstufen angezeigt.
Monatslimits anzeigen
Wenn wahr, werden die monatlichen Erschöpfungsniveaus gezeichnet.
Beschreibungen anzeigen
Wenn wahr, werden beschreibende Bezeichnungen für die Ebenen gezeichnet. Wenn falsch, wird nur die Linie gezeichnet, aber die Linien haben QuickInfos, falls Sie wissen müssen, was sie darstellen.
ShowPriceInDescription
Wenn wahr, wird der Levelwert zur Beschreibung und zum Tooltip hinzugefügt.
BeschreibungFontSize
Schriftgröße zum Zeichnen von Beschreibungen
ExtendLines
Wenn dies der Fall ist, werden die Linien nicht bis zum Ende des Zeitraums gezeichnet, sondern endlos rechts vom Diagramm verlängert.
Die folgenden Einstellungen erscheinen für jeden Zeitraum, D1, W1 und MN1
XX_Farbe
Die beim Zeichnen der Linien und Beschreibungen zu verwendende Farbe
XX_Zeilenbreite
Die Breite der zu zeichnenden Linie. Wenn der LineStyle etwas anderes als Solid ist, wird dieser Wert ignoriert. Nur durchgezogene Linien können im MetaTrader eine Breite haben.
XX_Linienstil
Der Linientyp, der aus der Standardauswahl gezeichnet werden soll.