• Übersicht
  • Bewertungen (4)
  • Diskussion (15)
  • Neue Funktionen

MR Volume POC Levels 4

5
The most crucial price level in any "Volume Profile" is the "Point of Control". Is the price level with the highest traded volume. And mainly, is the level where the big guys start there their positions, so it's an accumulation/distribution level for smart money.

The idea of the indicator arose after the "MR Volume Profile Rectangles" indicator was made. When creating the "MR Volume Profile Rectangles" indicator, we spent a lot of time comparing the volumes with those from the volume profile in NinjaTrader 8 terminal with CQG datafeed. The settings of EURUSD-6E, GBPUSD-6B, AUDUSD-6A and other currency pairs were compared. After making sure that everything is working according to our requirements, we made the "MR Dynamic POC" indicator following the model used in NinjaTrader 8. Ultimately, we decided to take a step forward and create a new generation indicator that will track the actions of the "Big" players in the financial markets. This is how the "MR Volume POC Levels" indicator appeared. Over time, we further developed our idea...

Some of the most important benefits of the indicator are as follows:
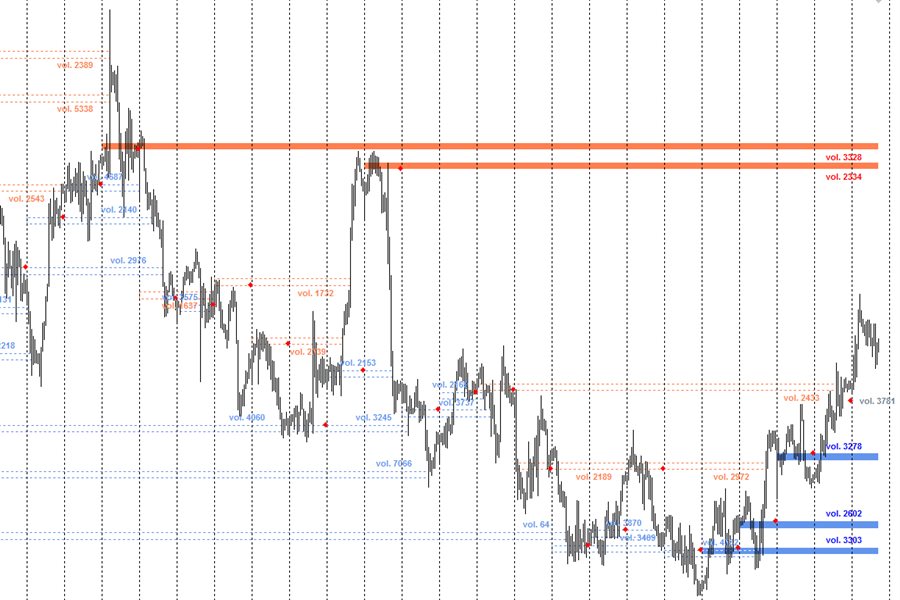
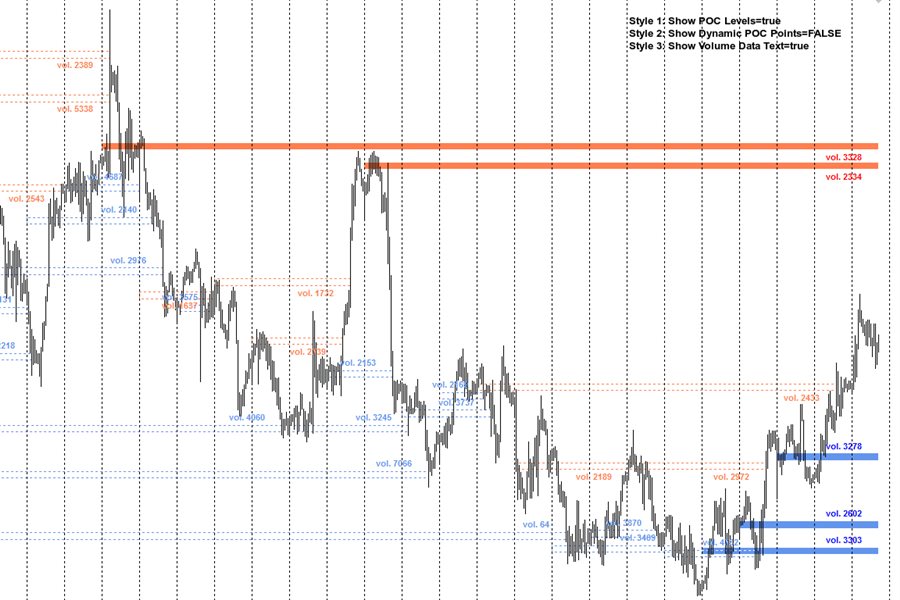
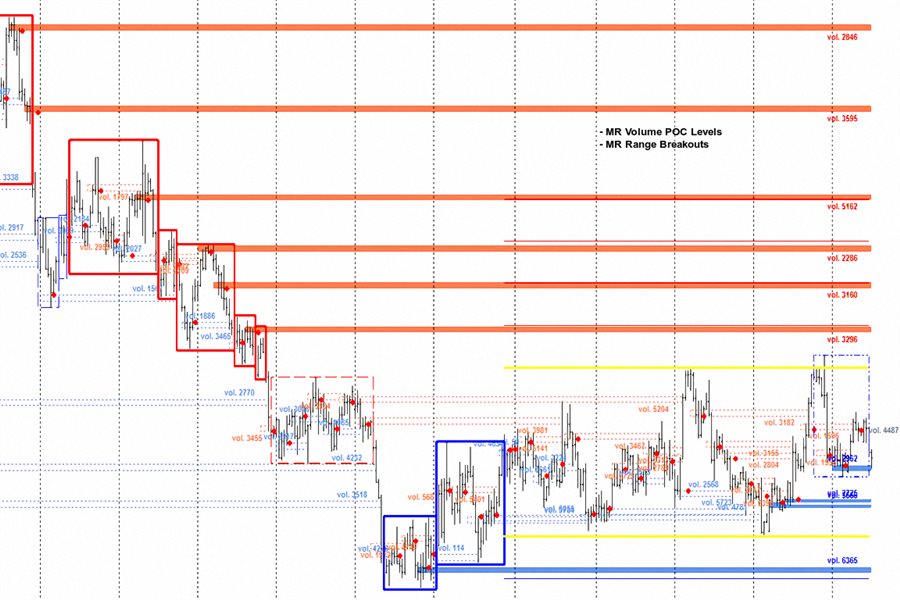
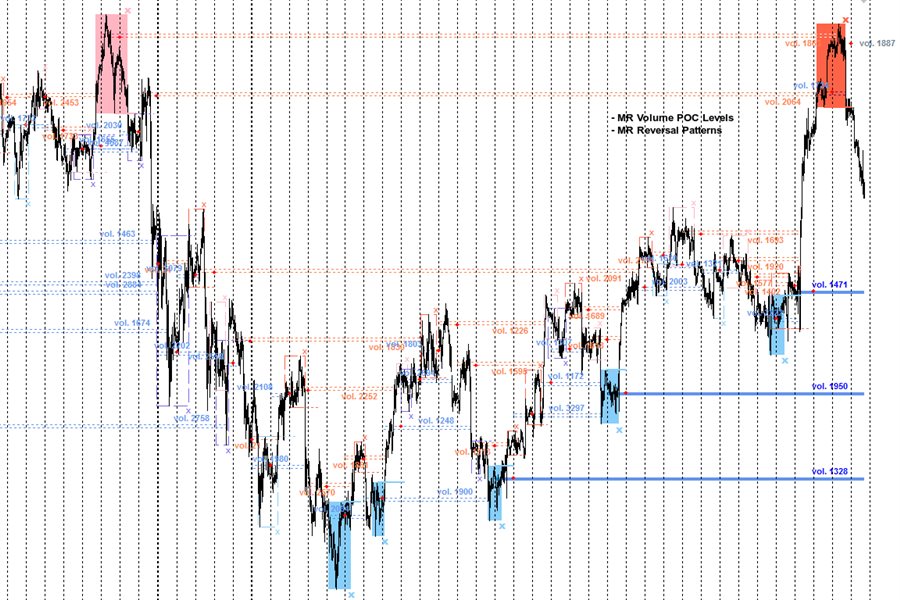
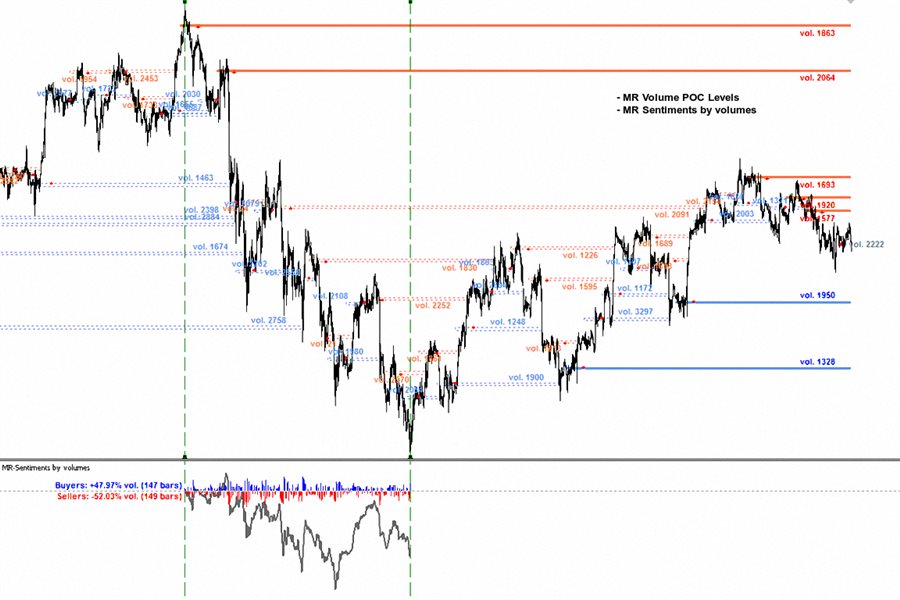
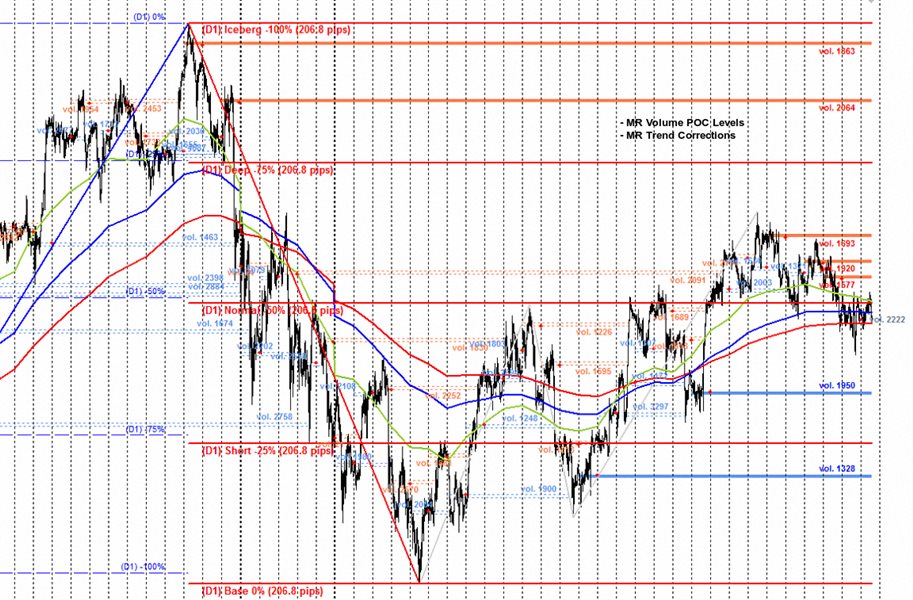
    • Indicator shows the POC (Point of Control) volume levels for the selected period of time.
    • "Point of Control" (POC) are not lines, they are zones.
    • Which zones are relevant and which are not, is determined by the author's methodology.
    • Using the indicator, you can track the actions of "Big" players in the market. At the extreme points of price movement (maximum, minimum), Market-Makers provide liquidity to "Big" players who change the direction of price movement.
    • At Volume POC Levels there is always a reaction. Whether the price movement will reverse its direction is decided only by the "Big" players in the market.
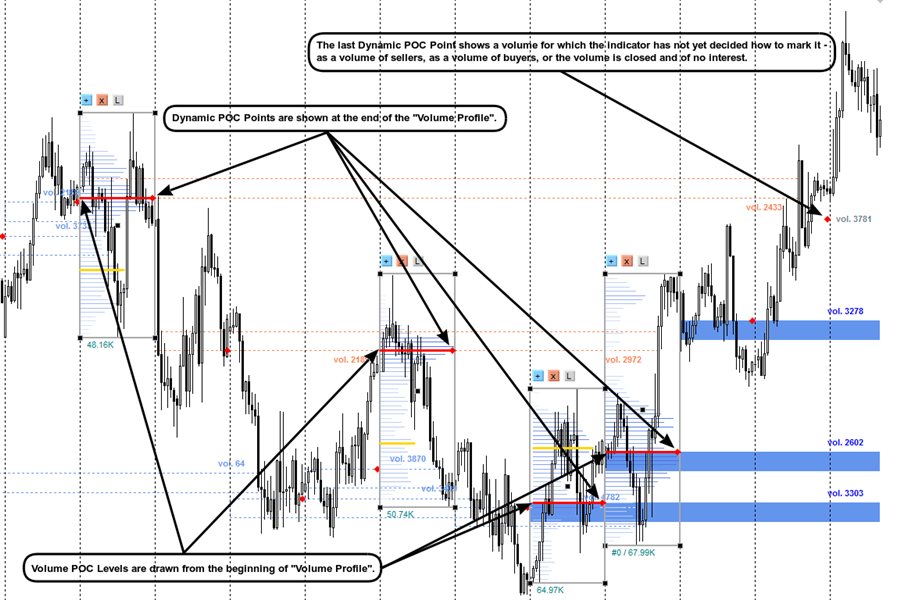
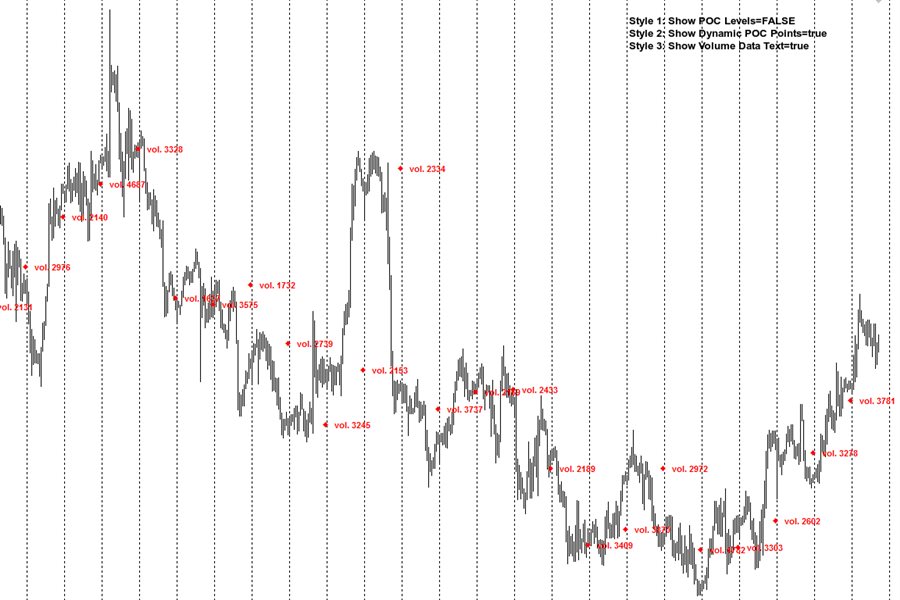
    • The indicator shows "points" from the new concept of the "MR Dynamic POC" indicator. Dynamic POC points are shown from the end of the "Volume Profile".
    • The last Dynamic POC Point (with gray text) shows a volume for which the indicator has not yet decided how to mark it - as a volume of sellers, as a volume of buyers, or the volume is closed and of no interest.
          • In combination with the "MR Range Breakouts" indicator, you can see where important volumes are left after the exit from the "Balances" and "Ranges". In addition, you can see how the volumes are absorbed in the "Range" and accumulate positions of buyers and sellers.
              • In combination with the "MR Reversal Patterns" indicator, you can track key places where volumes are absorbed and then new volumes appear in the opposite direction.
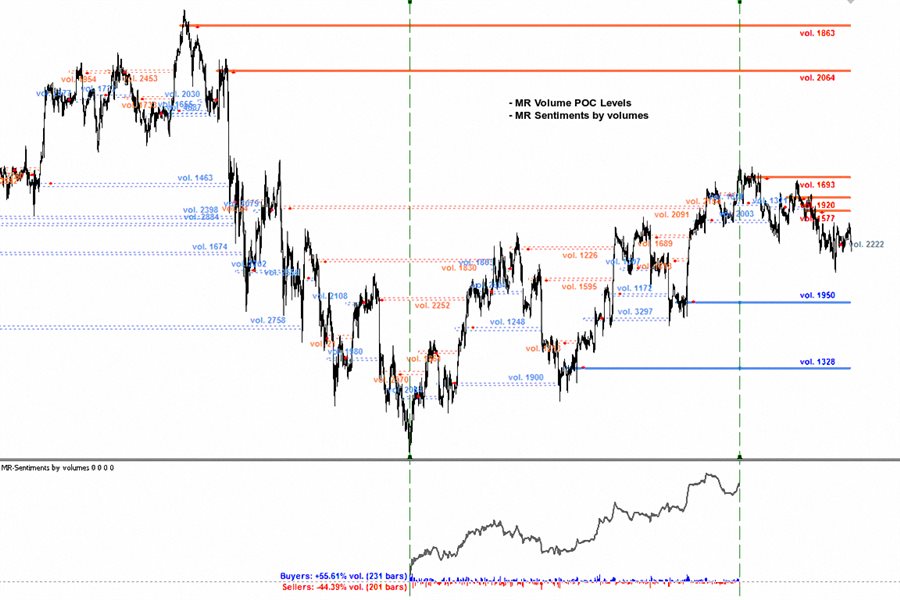
              • In combination with the "MR Sentiments by volumes" indicator, you can see when the volumes are used in the direction of the price movement and when the true reversal of the price movement occurs.
              • In combination with the "MR Trend Corrections" indicator, you can track the places where volumes are absorbed and accumulated. You will notice that in the "Impulse" movements, the volumes participate in the entrainment of the price movement in the direction of the "Impulse", and in the "Corrections" new places arise with volumes that keep the price movement in the range.
                • "MR Volume POC Levels 4" is based on indicator "VP: Volume Profile v6.0. © FXcoder".


                If you liked the indicator, please support our work by giving 5 stars!!!

                For MetaTrader 5 https://www.mql5.com/en/market/product/63565

                How to use indicators - Article


                Indicator settings:

                Points in 1 Pip - Offers you a choice of the number of Points in 1 Pip.
                Volume types - Offers you a choice to use tic volumes or real volumes. Note: To use real volumes, your Broker must provide them in the MetaTrader terminal.

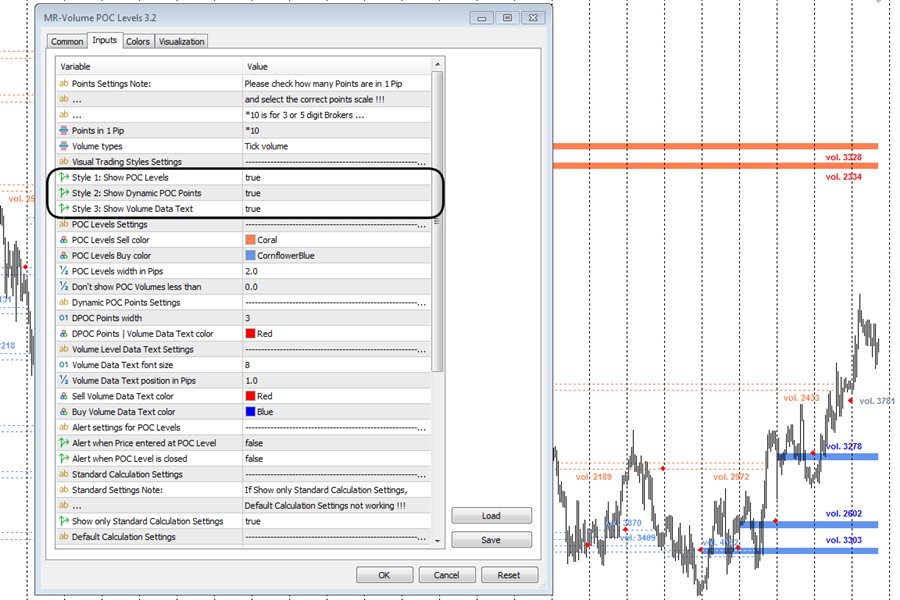
                Section "Visual Trading Styles Settings"
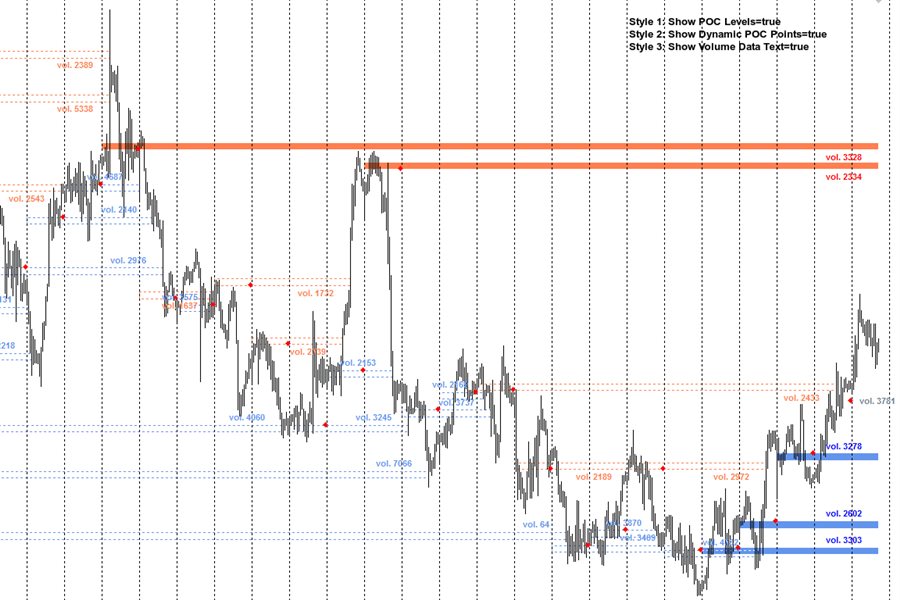
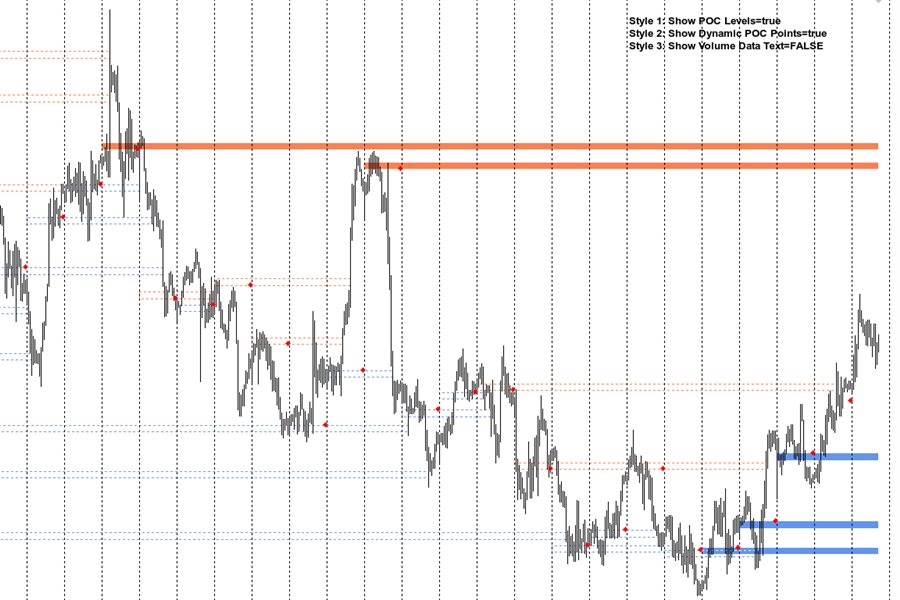
                Style 1: Show POC Levels - Shows or not Volume POC Levels. If the option is turned off, the option to show Dynamic POC Points is turned on by default.
                Style 2: Show Dynamic POC Points - Shows or not Dynamic POC Points.
                Style 3: Show Volume Data Text - Shows or not to display text with information about the amount of volumes for the POC level.

                Section "POC Levels Settings"
                POC Levels Sell color - Background color of POC Levels for Sell.
                POC Levels Buy color - Background color of POC Levels for Buy.
                POC Levels width in Pips - Specifies the width of the zone for POC levels in pips.
                Don't show POC Volumes less than - Filter to show or hide POC levels less than the specified amounts. When selected "0" displays all POC levels.

                Section "Dynamic POC Points Settings"
                DPOC Points width - Specifies the size of Dynamic POC Points.
                DPOC Points | Volume Data Text color - Specifies the color of Dynamic POC Points and data text.

                Section "Volume Level Data Text Settings"
                Volume Data Text font size - You can choose the data text size.
                Volume Data Text position in Pips - Position for displaying data text in pips.
                Sell Volume Data Text color - Data text color for Sell.
                Buy Volume Data Text color - Data text color for Buy.

                Section "Alert settings for POC Levels"
                Alert when Price entered at POC Level - Alert when price entered at POC Level.
                Alert when POC Level is closed - An alert occurs when the price closes the POC level.

                Section "Standard Calculation Settings"
                Show only Standard Calculation Settings - Enables or disables the default settings. If show only Standard calculation settings, Default calculation settings not working.

                Section "Default Calculation Settings"
                Default Number of Bars to calculate - Default number of Bars to calculate indicator.
                Default Volume Choice - You choose the volumes from which time frame to display on all lower time frames.

                Section "Standard Bars Calculation Settings"
                MN - Number of Bars to calculate - The number of monthly Bars to calculate the indicator.
                W1 - Number of Bars to calculate - The number of weekly Bars to calculate the indicator.
                D1 - Number of Bars to calculate - The number of daytime Bars to calculate the indicator.
                H4 - Number of Bars to calculate - The number of 4 hour Bars to calculate the indicator.
                H1 to M1 - Number of Bars to calculate - The number of Bars to calculate the indicator from a time frame lower than 4 hours.

                Section "Standard Volume Choice"
                In this section, you choose on which time frame to display the volumes of the time frame you have chosen for it...
                On D1 show Volumes from - W1
                On H4 show Volumes from - D1
                On H1 show Volumes from - D1
                On M30 show Volumes from - H4
                On M15 show Volumes from - H4
                On M5 show Volumes from - H4
                On M1 show Volumes from - H1

                  Bewertungen 4
                  elite luis
                  3037
                  elite luis 2023.03.27 04:44 
                   

                  Amazing POC indicator, Author is very Supportive and passionate to help user, Thanks alot :)

                  dcau93
                  946
                  dcau93 2022.12.30 09:13 
                   

                  HI I have MR reversal but still i was missing something in scalping and be catch where i believe it was a good trend ! MR Volume POC levels 4 give me immediately the view of a potential reversal because volume buyers was > volume sellers already absorbed ! i have differents tools but this one give me an very interesting view of the players which really help me a lot in the 2 problematics : 1) when to go 2) when to be very alert of possible change of trend (at least a reversal who can take me out) Well done and again thanks for your advice in my question in comments of MR Reversal Thanks a lot warmly

                  laptoplifestyle
                  1361
                  laptoplifestyle 2022.10.10 23:08 
                   

                  Really awesome indicator, very powerful! I reached out to Sergey and his team regarding a bug fix and he reached out right away and released an update the next day that fixed the issue! Thanks for your support and wanting to help =) Looking forward to using your other products =)

                  Empfohlene Produkte
                  Reverse side scalper is the manual trading system, that works on choppy(anti-trend) market. As a rule markets are on 80% choppy and only 20% is trend phase. System is based on custom step Moving and RSI and reverse pattern. System defines up movement, down movement, trend / choppy phases. Indicator plots Buy signal arrow when current direction is down and phase is trend, Sell signal arrow is plotted when currently is up movement and phase is trend. As a rule it allows to "catch" local maximum/mi
                  199 USD
                  Max Volume
                  Maksim Slovakov
                  Подкрашивает аномально большие тиковые объёмы в красный цвет. Имеет следующие настройки: "Процент" по умолчанию "70"  (Процент на который аномальный объём должен быть больше предыдущего) "Уровень" по умолчанию "500" (Количество тиков, больше которого будем брать во внимание аномальный объём) Внимание! Данный индикатор был разработан для мелких таймфреймов M1,M5,M15. Идея в том, что на таких Таймфреймах увеличение количества тиков говорит об увеличении количество сделок, увеличения интереса к цен
                  500 USD
                  In the age of speed, everyone wants to gets what he/she wants quickly. Trading is all about gaining money, and scalping is a way of doing it in a short time. The "Scorpion Scalper Pro" has been named on the scorpion because of its speed. The indicator serves to provide signals for the M15 timeframe. It also sends Alerts (window alert, email alert, push notification alert) whenever a buy/sell signal occurs, and the alerts are customizable (they can be turned ON or OFF). Indicator inputs : - Buy
                  50 USD
                  Urgently
                  Tatiana Savkevych
                  The Urgently indicator is designed to quickly determine the situation in the market, reflect the state of the market and signal profitable levels for opening trades. Market conditions change quickly enough, requiring constant calibration of trading strategies. Recommended for use in conjunction with any of the oscillators. The Urgently forex market trend indicator shows the trend direction and entry points. It smooths out price fluctuations when generating a signal by averaging the data and the
                  66 USD
                  PRO Renko System ist ein hochpräzises Handelssystem, das speziell für den Handel mit RENKO-Charts entwickelt wurde. Dies ist ein universelles System, das auf verschiedene Handelsinstrumente angewendet werden kann. Das System neutralisiert effektiv so genannte Marktgeräusche, die Ihnen Zugang zu genauen Umkehrsignalen geben. Der Indikator ist sehr einfach zu bedienen und hat nur einen Parameter, der für die Signalerzeugung verantwortlich ist. Sie können das Tool einfach an jedes Handelsinstr
                  75 USD
                  Night ghost
                  Dmitriy Kashevich
                  Night Ghost - Pfeilanzeige für binäre Optionen. Dies ist ein zuverlässiger Assistent für Sie in der Zukunft! - Kein Neuzeichnen auf dem Diagramm -Funktioniert hervorragend bei allen Währungspaaren! - Anzeigegenauigkeit bis zu 90 % (besonders nachts) -Keine lange Einrichtung erforderlich (perfekt für binäre Optionen eingerichtet) - Keine späten Signale - Das Erscheinen eines Signals auf der aktuellen Kerze -Perfekt für die M1-Periode (nicht mehr!) - Augenfreundliche Kerzenfar
                  350 USD
                  Dark Sniper
                  Dmitriy Kashevich
                  Dark Sniper arrow indicator. complete lack of redrawing percentage of correct indicator predictions from 80 85% The arrow indicates the direction of the next candle and the possible direction of the trend in the future.  suitable for small m1 timeframes. It is recommended to open deals from 1 to 2 candles. The signal appears on the last candle advantages of the indicator: 1. leading signals. 2.complete lack of redrawing 3. high signal accuracy.
                  820 USD
                  Greasy scalper is an indicator for scalping. Shows in which direction now with a high probability there will be a price movement. This may be a movement of several points, or several tens of points. But most likely this movement will happen with a high degree of probability. And the larger the timeframe, the greater the likelihood that the price will go in the direction of the arrow. Knowing this information, we can use it for profit. We can open short trades in the direction of the arrow. As s
                  147 USD
                  Indicator for binary options arrow is easy to use and does not require configuration works on all currency pairs, cryptocurrencies buy signal blue up arrow sell signal red down arrow tips do not trade during news and 15-30 minutes before their release, as the market is too volatile and there is a lot of noise it is worth entering trades one or two candles from the current period (recommended for 1 candle) timeframe up to m 15 recommended money management fixed lot or fixed percentage of the depo
                  100 USD
                  Magic Oscilator
                  REIVER YOHAN MOLINA
                  Oszillator basierend auf Datenkonvergenz zwischen Volumen und Liquidität. Es wird empfohlen, es paarweise mit hohem Volumen und hoher Liquidität zu verwenden, z. B. EURUSD. Vorzugsweise in TF 4H oder höher. Wie benutzt man: Wenn die Linien in OVERPURCHASE konvergieren und sich kreuzen, wird empfohlen, zu verkaufen. Wenn die Linien in SURVEY konvergieren und sich kreuzen, wird der Kauf empfohlen. Bei Fragen stehe ich Ihnen gerne per Chat zur Verfügung. Wenn Sie es für eine Fälschung halten o
                  531.95 USD
                  Hrumer Alpha - ein grundlegend neuer Devisenindikator, der auf dem Algorithmus der Verfolgung der Spitzenwerte des Preises basiert. Das ist nicht ZigZag und nicht Fraclals und hat trotz der visuellen Ähnlichkeit nichts mit diesen Indikatoren zu tun. Es zeichnet seine Werte nicht neu und arbeitet mit dem Null-Balken, also mit Open [0]. Er reagiert schnell auf Preisänderungen und informiert den Händler über die Stornierungen. Funktioniert auf allen Währungspaaren und Zeitrahmen. Sie können für lan
                  147 USD
                  Quantum Currency Array Indicator
                  QUANTUM TRADING SOFTWARE LIMITED
                  This indicator has been developed to identify and display these trends quickly and easily, allowing you to see instantly, those currency pairs which are trending, and those which are not – and in all timeframes, with just one click. The 28 currency pairs are displayed as a fan as they sweep from strong to weak and back again, and this is why we call it the ‘currency array’. All 28 pairs are arrayed before you, giving an instant visual description of those pairs that are trending strongly, those
                  197 USD
                  The indicator scans for stop grabber (special pattern of Joe Dinapoli which gives very high probability buy / sell signals and does not repaint ) signals in multiple timeframes for the all markets filtered and shows the results on Dashboard. Key Features Dashboard can be used for all markets It can scan for stop grabber pattern on MN1, W1, D1, H4, H1, M30, M15 ,M5, M1 timeframes Parameters UseMarketWatch: Set true to copy all symbols available in market watch MarketWatchCount : Set the numbe
                  95 USD
                  Deal Trading SPT
                  Sukunthakan Ngernbamrung
                  Deal Trading SPT (Super Trend) is an indicator, shows the market trend direction, entry position, take profit level, stop loss level and trend strength. Utility Help to further filter and develop strategy to trade Market overview on the chart Stop loss and take profit calculation with market volatility Resistance and support for trialing stop No repaint after the finished bar Works in any timeframe and financial instrument, including forex, CFD and crypto etc. Message pop-up, notification wi
                  69 USD
                  Entry Arrows Visual - is an arrow indicator designed for scalping and intraday trading. The principle of the indicator is based on the search for potential entries. Contains internal reversal filters. Built-in definition level TP and SL automates the process of selecting parameters for setting up a trading strategy. Product Features Can be used on all time frames and trading instruments. Can be used on M1, M5, M15 time frames for scalping or M30, H1, H4 for intraday trading, recommended fo
                  48 USD
                  TPO Profile MT4
                  Kyra Nickaline Watson-gordon
                  5 (1)
                  Definition : TPO is a Time Price Opportunity. Instead of using bars or candles with an Open, High, Low, and Close price, each "bar" in a Market Profile is represented by horizontal bars against the price It is called Market Profile terminology. In other words time-price-opportunity (TPO) profiles are histograms of how much time was spent at each price within the span of the profile. By using a TPO chart, you are able to analyze the amount of trading activity, based on time, for each price lev
                  60 USD
                  RelicusRoad Pro
                  Relicus LLC
                  4.94 (101)
                  JETZT 147 $ (602 $ RABATT) - UNBEGRENZTE KONTEN - PREISERHÖHUNGEN BEIM NÄCHSTEN UPDATE - VERGESSEN SIE NICHT, EINE 5-STERNE-BEWERTUNG ZU VERLASSEN RelicusRoad Benutzerhandbuch + Schulungsvideos + Zugang zur privaten Discord-Gruppe + VIP-Status EINE NEUE ART, DEN MARKT ZU BETRACHTEN RelicusRoad ist der weltweit leistungsstärkste Handelsindikator für Forex, Futures, Kryptowährungen, Aktien und Indizes und gibt Händlern alle Informationen und Tools, die sie benötigen, um profitabel zu bleib
                  147 USD
                  Blahtech Market Profile
                  Blahtech Limited
                  4.63 (19)
                  Market Profile defines a number of day types that can help the trader to determine market behaviour. A key feature is the Value Area, representing the range of price action where 70% of trading took place. Understanding the Value Area can give traders valuable insight into market direction and establish the higher odds trade. It is an excellent addition to any system you may be using. Blahtech Limited presents their Market Profile indicator for the MetaTrader community. Inspired by Jim Dalton’s
                  99 USD
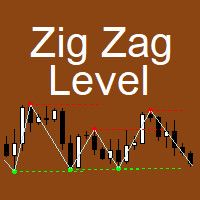
                  The indicator implements the author's approach to the construction of the popular "Zig-Zag" indicator. The advantages of the "ZIgZag Level" indicator is that it filters out market noise and shows levels. "ZIg Zag Level" is based on peaks and troughs, displays levels. These levels can be disabled and configured. The indicator displays the price of the level, the price tag can be disabled. The "zigzag" line between the points can also be disabled. The indicator has a built-in notific
                  49 USD
                  This is an algorithmic signal that mainly diagnoses the current direction based on data analysis, statistical algorithms, price breakout algorithms, and strategies based on some major indicators. This signal will display all the signals from a historical period on the main chart and is a good choice if you like to show the direction of the signals on the chart. Advantage: Suitable for all breeds. Applies to all cycles. Only one adjustable parameter, easy to use. Notice: This signal only provides
                  145 USD
                  Sagitta
                  Manuel Rodriguez Fernandez
                  EA based on SlingShots, composed of an exclusive configuration of indicators that trigger accurate operations. Various configuration options: to use individually, or opt for a conservative configuration to be able to combine the EA with others in a portfolio. Sagitta MT5 Stochastics Setup High level stochastic -> high level Low level stochastic -> low level Order Settings Distance between orders (in candlesticks) Autobatch -> true/false batch size -> start batch (fixed batch, if autobatch -> fa
                  267 USD
                  ADM Multiframe
                  Dmitriy Susloparov
                  ADM Oscillator Multiframe Unlike the classic indicator " Average Direction Movement index ", this indicator shows directly the difference between the +DI and -DI values. When +DI is greater than -DI results above zero and vice versa. This is more visual and, in addition, allows you to clearly see the interaction of indicator readings for different timeframes. It also uses a proprietary technology that allows you to see different timeframes simultaneously on a single time scale. For example, f
                  35 USD
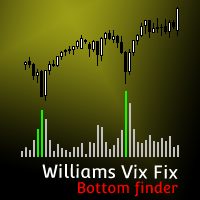
                  MT5-Version Williams Vix Reparatur MT4 Benötigen Sie Hilfe beim Versuch, den Tiefpunkt des Marktes zu timen? Williams Vix Fix MT4 basiert auf der Marktvolatilität und bietet eine hervorragende Unterstützung, um herauszufinden, wann die Korrekturen vorbei sind. JETZT KOSTENLOS AUSPROBIEREN! Williams Vix Fix MT4 Abgeleitet von Larry Williams' VixFix-Indikator zum Anpassen   jede Anlageklasse   . VIX repräsentiert die Angst und Gier des Marktes basierend auf seiner Volatilität. Ein hoher VIX-Wert
                  129 USD
                  The King of Forex Trend Cloud Indicator is a trend following indicator based on moving averages. The Indicator is meant to Capture both the beginning and the end of a trend. This indicator can be used to predict both short and long terms market trends.  The king of Forex Trend Cloud if paired together with the King of Forex Trend Indicator can give a broad picture in market analysis and forecasts. I have attached images for both the  The king of Forex Trend Cloud on its own and  The king of Fore
                  335 USD
                  KizzFTMO
                  Hossein Davarynejad
                  ////  KIZZFTMO   /////                                                                                    Live Signal 1     =        https://www.mql5.com/en/signals/1901176                                                                      Live Signal 2     =        https://www.mql5.com/en/signals/1925137                                                                      Live Signal 3     =        https://www.mql5.com/en/signals/1929195                                        
                  30 000 USD
                  AAA Traders Tools One of the most desirable talents a trader can have, is an ability to see near-term activity in a long-term context. Exceptional traders know when to enter the market and how long to hold position.  When you know how the market works and you have a big picture which identifies critical price levels, you can react quickly to capitalize on current activity. Professional Traders Only!  Education included **** you will need an additional file snd.ex4 to your indicator fo
                  3 000 USD
                  hi traders I am a Forex and binary expert trader from 2012 . I have many robust & highly profitable trading strategies. I've created these trading system with a long time effort and experience of vast knowledge. All my trading indicator will give 95 to 99% accurate performance. If you follow the signal it will give almost 100% success. They are extremely powerful, accurate & easy to trade. New Trader friendly no past experience needed. clear and friendly interface  Alert notification 100% non re
                  50 USD
                  Note: The price is subject to increase at any time from now!  Hi Traders, I would like to introduce to you my new indicator called the Infinity Oscillator Indicator. This indicator is designed for both newbies and professional traders. Parameters The inputs that can be changed by the user are colors of the lines only so as to not disturb the original trading strategy this indicator uses. The indicator will not provide buy and sell arrow signals but will help traders in market analysis approach
                  250 USD
                  KT Asian Breakout Indicator
                  KEENBASE SOFTWARE SOLUTIONS
                  KT Asian Breakout indicator scans and analyzes a critical part of the Asian session to generate bi-directional buy and sell signals with the direction of a price breakout. A buy signal occurs when the price breaks above the session high, and a sell signal occurs when the price breaks below the session low. MT5 Version is available here https://www.mql5.com/en/market/product/41704 Things to remember If the session box is vertically too wide, a new trade should be avoided as most of the price
                  120 USD
                  Chinetti Pip Collector XL ist ein komplettes schlüsselfertiges Handelssystem. Wenn ein Händler noch kein eigenes Handelssystem hat, kann er Chinetti Pip Collector XL auf den Handel anwenden. Der Handel mit diesem Indikator ist sehr einfach. Sogar ein Anfänger in Forex kann damit umgehen. Handelsregeln: Warten Sie, bis der Indikator eine blaue Linie zeichnet. Dies bedeutet, dass die Preisentwicklung jetzt beginnt. Jetzt warten wir darauf, dass der Indikator den Markt analysiert und einen Aufwä
                  147 USD
                  Käufer dieses Produkts erwarben auch
                  Derzeit 20% Rabatt! Die beste Lösung für jeden Neueinsteiger oder Expert Händler! Dieses Dashboard arbeitet mit 28 Währungspaaren. Es basiert auf 2 unserer Hauptindikatoren (Advanced Currency Strength 28 und Advanced Currency Impulse). Es bietet einen hervorragenden Überblick über den gesamten Forex-Markt. Es zeigt die Werte der Advanced Currency Strength, die Veränderungsrate der Währungen und die Signale für 28 Devisenpaare in allen (9) Zeitrahmen. Stellen Sie sich vor, wie sich Ihr Hande
                  199 USD
                  Ultimate Sniper Dashboard
                  Hispraise Chinedum Abraham
                  4.82 (22)
                  Ermäßigt auf $299! Die Preise können in Zukunft steigen! Lesen Sie die Beschreibung unten! Bestes Einstiegssystem für Ultimate Sniper Dashboard: ULTIMATIVE DYNAMISCHE EBENEN. (Bitte überprüfen Sie meine Produkte) Das Ultimate Sniper Dashboard funktioniert NUR auf Live-Märkten aufgrund der MT4 Multicurrency Testlimits. Wir stellen Ihnen das Ultimate-Sniper Dashboard vor! Unser bestes, das sowohl HA-Sniper, MA-Sniper und viele spezielle Modi enthält. Das Ultimate Sniper Dashboard ist ein
                  299 USD
                  PZ Trend Trading
                  PZ TRADING SLU
                  4.75 (4)
                  Trend Trading ist ein Indikator, der so weit wie möglich von den Markttrends profitiert, indem er Pullbacks und Breakouts zeitlich festlegt. Sie findet Handelsmöglichkeiten, indem sie analysiert, was der Preis während etablierter Trends tut. [ Installationsanleitung | Update-Anleitung | Fehlerbehebung | FAQ | Alle Produkte ] Handeln Sie mit Zuversicht und Effizienz an den Finanzmärkten Profitieren Sie von etablierten Trends, ohne ins Wanken zu geraten Profitable Pullbacks, Ausbrüche und vor
                  175 USD
                  Ultimate Dynamic Levels
                  Hispraise Chinedum Abraham
                  4.88 (8)
                  Derzeit auf Urlaub Rabatt bei $ 399! Die Preise können in Zukunft steigen. Lesen Sie die Beschreibung unten!  Einführung von Ultimate Dynamic Levels - der BESTE Einstiegsindikator für das Ultimate Sniper Dashboard! Extrem risikoarme, rechtzeitige Einstiege und hohe RR!! Finden Sie das Ultimate Sniper Dashboard HIER. Die wichtigste Fähigkeit sowohl für Anfänger als auch für Profis ist es, genau zu erkennen, wo und wann ein Markt am wahrscheinlichsten dreht, und wie man sicher einsteigt und mi
                  199 USD
                  Moonwalker
                  Cengiz Erkoyuncu
                  5 (6)
                  Der Moonwalker MT4 Indikator ist ein leistungsstarkes Werkzeug, das Ihre Trend-Handelsstrategie auf Renko-Charts revolutionieren kann. Seine fortschrittlichen Algorithmen bieten unübertroffene Zuverlässigkeit durch die Verfolgung von Markttrends, während plötzliche Schwankungen und Marktrauschen herausgefiltert werden. Dies ermöglicht es Ihnen, ohne den Stress einer ständigen Überwachung der Märkte mit Leichtigkeit und Vertrauen zu handeln. Im Gegensatz zu anderen Indikatoren ist der Moonwalker
                  250 USD
                  A. Was ist A2SR ?   * Es ist ein führender technischer Indikator (kein Repaint, kein Verzögern). -- Orientierungshilfe : -- unter  https://www.mql5.com/en/blogs/post/734748/page4#comment_16532516 -- und  https://www.mql5.com/en/users/yohana/blog A2SR verfügt über eine spezielle Technik zur Bestimmung der Unterstützungsniveaus (Nachfrage) und des Widerstands (Angebot). Im Gegensatz zu der gewöhnlichen Methode, die wir im Internet gesehen haben, hat A2SR ein originelles Konzept zur Bestimmung d
                  386 USD
                  NAM Order Blocks
                  NAM TECH GROUP, CORP.
                  5 (1)
                  MT4-Erkennungsanzeige für Auftragsblöcke mit mehreren Zeitrahmen. Eigenschaften - Vollständig anpassbar auf dem Diagrammbedienfeld, bietet vollständige Interaktion. - Verstecken und zeigen Sie das Bedienfeld, wo immer Sie möchten. - Erkennen Sie OBs in mehreren Zeiträumen. - Wählen Sie die anzuzeigende OB-Menge aus. - Verschiedene OBs Benutzeroberfläche. - Verschiedene Filter an OBs. - OB-Näherungsalarm. - ADR High- und Low-Leitungen. - Benachrichtigungsdienst (Bildschirmwar
                  200 USD
                  PZ Harmonacci Patterns
                  PZ TRADING SLU
                  3.43 (7)
                  Dies ist wahrscheinlich der vollständigste Indikator für die automatische Erkennung der harmonischen Preisbildung, den Sie für die MetaTrader-Plattform finden können. Es erkennt 19 verschiedene Muster, nimmt Fibonacci-Projektionen genauso ernst wie Sie, zeigt die potenzielle Umkehrzone (PRZ) an und findet geeignete Stop-Loss- und Take-Profit-Werte. [ Installationsanleitung | Update-Anleitung | Fehlerbehebung | FAQ | Alle Produkte ] Es erkennt 19 verschiedene harmonische Preisbildungen Dar
                  249 USD
                  Please send me Direct message on MQL5 CHAT after purchasing the Indicator for Training and Installation Support There are some additional files that is important to use with the Indicator . So be sure to contact me after purchasing the Indicator So that I can add you for training and support . If you find any difficulty with installation then send me Direct message here So that I can connect with you via Anydesk or Teamview for the product installation. " Smart Order Block Indicator " to find
                  249 USD
                  Supply and Demand Dashboard PRO
                  Bernhard Schweigert
                  4.8 (20)
                  Derzeit 20% reduziert! Dieses Dashboard ist eine sehr leistungsfähige Software, die mit mehreren Symbolen und bis zu 9 Zeitrahmen arbeitet. Es basiert auf unserem Hauptindikator (Beste Bewertungen: Advanced Supply Demand ).   Das Dashboard gibt einen guten Überblick. Es zeigt: Gefilterte Angebots- und Nachfragewerte einschließlich der Zonenstärkebewertung, Pips-Abstände zu/und innerhalb von Zonen, Es hebt verschachtelte Zonen hervor, Es gibt 4 Arten von Alarmen für die gewählten Symbole in
                  199 USD
                  Cycle Sniper
                  Elmira Memish
                  4.5 (32)
                  NEW YEAR SALE PRICE FOR LIMITED TIME!!! Please contact us after your purchase and we will send you the complimentary indicators to complete the system. Cycle Sniper is not a holy grail but when you use it in a system which is explained in the videos, you will feel the difference. If you are not willing to focus on the charts designed with Cycle Sniper and other free tools we provide, we recommend not buying this indicator. We recommend watching the videos about the indiactor and system before
                  200 USD
                  Introduction to Fractal Pattern Scanner Fractal Indicator refers to the technical indicator that makes use of the fractal geometry found in the financial market. Fractal Pattern Scanner is the advanced Fractal Indicator that brings the latest trading technology after the extensive research and development work in the fractal geometry in the financial market. The most important feature in Fractal Pattern Scanner is the ability to measure the turning point probability as well as the trend probabi
                  185 USD
                  Der Forex TPA Indikator deckt die wahren Aktionen der Marktmacher auf, immer dann wenn sie passieren. "Kämpfe nicht gegen die Marktmacher an, sondern folge ihnen", ist wohl der beste Rat, den ein Trader bekommen kann. Der TPA Indikator zeigt jedesmal seine Signale an wenn die Bullen definitiv stärker sind als die Bären und umgekehrt. Dieser Indikator wurde VON Tradern FÜR Trader gemacht und ist 100% NICHT NACHZEICHNEND! Signale werden STRENG am Schluss einer Kerze  generiert. Das sagen unsere Ku
                  168 USD
                  Blitz Scalper
                  Cengiz Erkoyuncu
                  Blitz Scalper ist ein auf Preisaktionen basierender Scalping-Indikator, der dazu entwickelt wurde, Händlern schnell profitables Trading auf dem Forex-Markt zu ermöglichen, einschließlich EINSTIEG-AUSGANG. Dieser Indikator funktioniert auf mehreren Zeitrahmen und ist optimiert, um mit den wichtigsten Währungspaaren zu arbeiten. Der Blitz Scalper-Indikator basiert auf einer Kombination aus leistungsstarken Trading-Strategien, einschließlich Preisaktionen, Unterstützung und Widerstand sowie Trenda
                  250 USD
                  THEQ Volumen
                  Luis Alberto Vazquez Carpio
                  2 (1)
                  THEQ Volume zeigt einen präzisen Lautstärkeoszillator an. Es kann verwendet werden, um folgenden Trends oder möglichen Trendänderungen zu handeln. THEQ Volume enthält auch THEQ Volume Arrows, einen Indikator mit Signalen und Warnungen sowie THEQ Volume EA für Real / Demo, Backtesting und Optimierung oder zum Erstellen einer eigenen Strategie. Zusätzlicher Indikator und Robot EA werden nach Zahlungseingang separat geliefert. THEQ Volume wird nicht neu gestrichen, weist keine Verzögerung auf und d
                  495 USD
                  Naked Forex Big Shadow Indicator Big Shadow Indicator is a pattern recognition indicator for Forex, Stocks, Indices, Futures, Commodities and Cryptos. When you have a Big Shadow on your chart then this is a strong signal meaning that you might be ahead of a reversal. You can take other elements (momentum, trend, volatility, price action, fundamentals) to build a complete strategy and confirm your entries. Beware that you might not make money just following the arrows generated by the pattern r
                  177 USD
                  TradeighT
                  Lorenzo Monari
                  www.tradeightrading.com The tool identifies the real movement that the forex market uses, with real mathematical calculations based on the price changes. Tradeight execution is based on this mathematical relationship that be always existed. Most traders look at the same things on charts and study the same information.. the reason because the majority lose money. It is a tool based not on the ideas of the majority but on the real foundations that rule the forex market. The tool is a visual tool,
                  2 300 USD
                  The Nihilist 5.0 Indicator includes Forexalien and Nihilist Easy Trend trading strategies and systems. It is composed of an MTF Dashboard where you can analyze the different input possibilities of each strategy at a glance. It has an alert system with different types of configurable filters. You can also configure which TF you want to be notified on your Metatrader 4 platform and Mobile application The indicator has the option to view how could be a TP and SL by using ATR or fixed points, even
                  299 USD
                  DESCRIPTION The CHAOS INDICATOR has been developed to be used for the TRADING STRATEGY OF CHAOS, as described in the book. The book is in italian language only and can be obtained only on my website indicated below. DATAS COLLECTED AND SHOWN ON GRAPHS The CHAOS INDICATOR apply easily to any graph and any asset, and it is a TRADING FACILITATOR, as it identify immediately the following items on any graph: - The GP (= RIGHT PRICE) i.e. the price to which the asset should be attracted within 24
                  380 USD
                  Hello, I am Ayman from Egypt, I want to present an interesting indicator to you. It depends on Ichimoku Kinko Hyo, but there is a secret that i use in it. By using my indicator, you will be able to know a lot of important information in the market such as: Live Signal : https://www.mql5.com/en/signals/821024 Features You can avoid entry during market turbulence You can enter orders on the general trend only You will know if the trend is strong or weak If you entered an any orders by the help o
                  300 USD
                  Introduction to EFW Analytics EFW Analytics was designed to accomplish the statement "We trade because there are regularities in the financial market". EFW Analytics is a set of tools designed to maximize your trading performance by capturing the repeating fractal geometry, known as the fifth regularity in the financial market. The functionality of EFW Analytics consists of three parts. Firstly, Equilibrium Fractal Wave Index is an exploratory tool to support your trading logic to choose which r
                  200 USD
                  Volume by Price MT4
                  Brian Collard
                  5 (14)
                  The Volume by Price Indicator for MetaTrader 4 features Volume Profile and Market Profile TPO (Time Price Opportunity). Get valuable insights out of currencies, equities and commodities data. Gain an edge trading financial markets. Volume and TPO histogram bar, line and metric charts. TPO letter and block marker charts including split structures. Positioning and styling options to suit the user's needs and context. Volume Profile and Market Profile TPO Point of Control (VPOC and TPOC), Imbalanc
                  179.95 USD
                  Agreement: Before Buy/Rent, make sure you have read this product description, slide images and video in more details  ️ Indicator USER MANUAL, Trade setups, solving issues, etc please visit   https://www.mql5.com/en/blogs/post/750802 Exclusive All In One   --- ( My Own Strategy )   Approach to trading based on: Smart Money Concept | SMC Elliott Wave Pattern | SMR Smart Money Reversal Harmonic Patterns | HP Fibonacci Pivot Points | FPP Quarters Points |  RN Round Numbers Average Daily
                  189 USD
                  Gartley Hunter Multi MT4
                  Siarhei Vashchylka
                  5 (2)
                  The Gartley Hunter Multi indicator is designed to search for Gartley patterns on a very large number of currency pairs (maximum 60) and on all standard time frames (m1, m5, m15, m30, H1, H4, D1, Wk, Mn) at the same time. The search is carried out automatically. After finding the pattern, the indicator will send an Alert or notification to the mobile phone. List of patterns At the moment, there are patterns in the indicator: Alternate bat Bat Butterfly Crab Cypher Deep crab Gartley Indicator cont
                  199 USD
                  Robot Choppiness
                  Diego Mauricio Padilla Mendez
                  5 (1)
                  Der Choppines-Roboter wird als Indikator im MT4-Indikatorordner geladen Es wird empfohlen, einen Candlestick-Zeitrahmen von 5 Minuten zu verwenden. Die empfohlene Ablaufzeit des Roboters beträgt 5 Minuten. Der Roboter kann so konfiguriert werden, dass er Signale an die Plattformen MT2, MX2 und PRICEPRO sendet. Um Signale zu senden, müssen Sie das Connector-Programm der Plattform verwenden, mit der Sie arbeiten möchten. Um den Connector zu installieren, führen Sie das folgende Verfahren du
                  599 USD
                  Order Blocks ICT MT4
                  Diego Arribas Lopez
                  5 (1)
                  MT5 Version   Kill Zones   SMT Divergences Order Blocks ICT The Order Blocks ICT indicator is a powerful tool for traders looking to gain an edge in the market. This indicator is based on the order flow and volume analysis, which allows traders to see the buying and selling pressure behind the price action. This information can be extremely valuable in identifying key levels of support and resistance, as well as potential turning points in the market. The Order Blocks ICT indicator is easy
                  177 USD
                  Order Block Indicator MT4
                  Diego Arribas Lopez
                  5 (2)
                  [   MT5-Version   ]  Orderblock-Indikator MT4 Der Order Block Indicator MT4 ist derzeit der genaueste und anpassbarste Indikator auf dem Markt. Es wurde entwickelt, um die Analyse von Operationen basierend auf Auftragsblöcken und Angebots- und Nachfragezonen zu erleichtern. Diese Zonen sind mögliche Umkehrpunkte einer Bewegung. Orderblock Indicator MT4 hebt aktive Orderblöcke von bis zu 4 TFs gleichzeitig hervor. Gleichzeitig bietet der Order Block Indicator MT4 ein visuelles Warnsystem, mit dem
                  224 USD
                  Congestioni
                  Stefano Frisetti
                  5 (1)
                  This indicator is very usefull to TRADE Trading Ranges and helps identify the following TREND. Every Trader knows that any market stay 80% of the time in trading ranges and only 20% of the time in TREND; this indicator has been built to help traders trade trading ranges. Now instead of waiting for the next TREND, You can SWING TRADE on trading ranges with this simple yet very effective indicator. TRADING with CONGESTIONI INDICATOR: The CONGESTIONI Indicator identify a new trading range and a
                  200 USD
                  Welcome to the world of SMC (Smart Money Concepts) Trading, where we empower traders with the tools and knowledge to make smarter trading decisions. Our latest addition to our suite of trading tools is the SMC Trading Pro indicator, version 1.0. Key Features: Major Market Structure Identification with BODY break. Order Block must be in Major Swing ( not Small Swing ). Order Block with Fair Value Gap Detection. Order Block in Discount | Premium zone. Filter for only Bullish, Bearish or All Order
                  199 USD
                  Noize Absorption Index - is the manual trading system that measures the difference of pressure between bears forces and bulls forces. Green line - is a noize free index that showing curent situation. Zero value of index shows totally choppy/flat market.Values above zero level shows how powerfull bullish wave is and values below zero measures bearish forces.Up arrow appears on bearish market when it's ready to reverse, dn arrow appears on weak bullish market, as a result of reverse expectation. S
                  199 USD
                  Weitere Produkte dieses Autors
                  " A trading range occurs when a financial instrument trades between constant high and low prices over a period of time. The upper part of the trading range of a financial instrument often provides price resistance, while the lower part of the trading range usually offers price support.  Traders can enter in the direction of a breakout or breakdown from a trading range... " This is the "Classical Theory" understanding of ranges. We have a different understanding of the nature of ranges and th
                  150 USD
                  A "Volume Profile" is an advanced charting indicator that displays total volume traded at every price level over a user specified time period. The main components of the volume profile are POC ( Point Of Control - the price level, at which the maximum number of contracts were executed during a selected period), VAH ( Value Area High - the highest price in the Value Area) and VAL ( Value Area Low - the lowest price in the Value Area). When we settled on the original indicator, we spent a lot o
                  150 USD
                  We publish the indicator as a useful tool in trading and call this indicator the "Swiss Army Knife" because it provides many possibilities and combinations to help understand the material on the "Masters of Risk" trading system. The indicator itself is not part of the tools used in the "Masters of Risk" trading system. The indicator consists of 3 separate multi-timeframe indicators, which in combination with each other help to reduce the "noise" of false signals. The first of the indicators ar
                  150 USD
                  "Sentiments of traders" in the financial markets is a topic that has been of interest to us for a long time. In time, we could not find the right formula to define these sentiments. We went through many stages in the search for the right methodology - from taking data from external sources to calculate open positions of buyers and sellers to calculating tick volumes, but still we were not satisfied with the results. The calculation of open positions of buyers and sellers from external sources ha
                  150 USD
                  MR Reversal Patterns 4
                  Sergey Khramchenkov
                  5 (1)
                  In the "Masters of Risk" trading system, one of the main concepts is related to places where markets change direction. In fact, this is a change in priority and a violation of the trend structure at the extremes of the market, where supposedly there are or would be stop-losses of "smart" participants who are outside the boundaries of the accumulation of volume. For this reason, we call them "Reversal Patterns" - places with a lot of weight for the start of a new and strong trend. Some of the imp
                  150 USD
                  MR Dynamic POC 4
                  Sergey Khramchenkov
                  The most crucial price level in any "Volume Profile" is the "Point of Control" . Is the price level with the highest traded volume. And mainly, is the level where the big guys start there their positions, so it's an accumulation/distribution level for smart money. The idea of the indicator arose after the "MR Volume Profile Rectangles" indicator was made. When creating the "MR Volume Profile Rectangles" indicator, we spent a lot of time comparing the volumes with those from the volume profil
                  150 USD
                  MR Reversal Patterns 5
                  Sergey Khramchenkov
                  5 (1)
                  In the "Masters of Risk" trading system, one of the main concepts is related to places where markets change direction. In fact, this is a change in priority and a violation of the trend structure at the extremes of the market, where supposedly there are or would be stop-losses of "smart" participants who are outside the boundaries of the accumulation of volume. For this reason, we call them "Reversal Patterns" - places with a lot of weight for the start of a new and strong trend. Some of the im
                  150 USD
                  MR Range Breakouts 5
                  Sergey Khramchenkov
                  5 (2)
                  " A trading range occurs when a financial instrument trades between constant high and low prices over a period of time. The upper part of the trading range of a financial instrument often provides price resistance, while the lower part of the trading range usually offers price support.  Traders can enter in the direction of a breakout or breakdown from a trading range... " This is the "Classical Theory" understanding of ranges. We have a different understanding of the nature of ranges and th
                  150 USD
                  The most crucial price level in any "Volume Profile" is the "Point of Control" . Is the price level with the highest traded volume. And mainly, is the level where the big guys start there their positions, so it's an accumulation/distribution level for smart money. The idea of the indicator arose after the "MR Volume Profile Rectangles" indicator was made. When creating the "MR Volume Profile Rectangles" indicator, we spent a lot of time comparing the volumes with those from the volume profil
                  150 USD
                  A "Volume Profile" is an advanced charting indicator that displays total volume traded at every price level over a user specified time period. The main components of the volume profile are POC ( Point Of Control - the price level, at which the maximum number of contracts were executed during a selected period), VAH ( Value Area High - the highest price in the Value Area) and VAL ( Value Area Low - the lowest price in the Value Area). When we settled on the original indicator, we spent a lot o
                  150 USD
                  MR Dynamic POC 5
                  Sergey Khramchenkov
                  The most crucial price level in any "Volume Profile" is the "Point of Control" . Is the price level with the highest traded volume. And mainly, is the level where the big guys start there their positions, so it's an accumulation/distribution level for smart money. The idea of the indicator arose after the "MR Volume Profile Rectangles" indicator was made. When creating the "MR Volume Profile Rectangles" indicator, we spent a lot of time comparing the volumes with those from the volume profil
                  150 USD
                  We publish the indicator as a useful tool in trading and call this indicator the "Swiss Army Knife" because it provides many possibilities and combinations to help understand the material on the "Masters of Risk" trading system. The indicator itself is not part of the tools used in the "Masters of Risk" trading system. The indicator consists of 3 separate multi-timeframe indicators, which in combination with each other help to reduce the "noise" of false signals. The first of the indicators ar
                  150 USD
                  "Sentiments of traders" in the financial markets is a topic that has been of interest to us for a long time. In time, we could not find the right formula to define these sentiments. We went through many stages in the search for the right methodology - from taking data from external sources to calculate open positions of buyers and sellers to calculating tick volumes, but still we were not satisfied with the results. The calculation of open positions of buyers and sellers from external sources ha
                  150 USD
                  Auswahl:
                  elite luis
                  3037
                  elite luis 2023.03.27 04:44 
                   

                  Amazing POC indicator, Author is very Supportive and passionate to help user, Thanks alot :)

                  Sergey Khramchenkov
                  1860
                  Antwort vom Entwickler Sergey Khramchenkov 2023.03.27 06:41
                  Thank you!!!
                  dcau93
                  946
                  dcau93 2022.12.30 09:13 
                   

                  HI I have MR reversal but still i was missing something in scalping and be catch where i believe it was a good trend ! MR Volume POC levels 4 give me immediately the view of a potential reversal because volume buyers was > volume sellers already absorbed ! i have differents tools but this one give me an very interesting view of the players which really help me a lot in the 2 problematics : 1) when to go 2) when to be very alert of possible change of trend (at least a reversal who can take me out) Well done and again thanks for your advice in my question in comments of MR Reversal Thanks a lot warmly

                  Sergey Khramchenkov
                  1860
                  Antwort vom Entwickler Sergey Khramchenkov 2022.12.30 10:34
                  Thank you!!!
                  laptoplifestyle
                  1361
                  laptoplifestyle 2022.10.10 23:08 
                   

                  Really awesome indicator, very powerful! I reached out to Sergey and his team regarding a bug fix and he reached out right away and released an update the next day that fixed the issue! Thanks for your support and wanting to help =) Looking forward to using your other products =)

                  Sergey Khramchenkov
                  1860
                  Antwort vom Entwickler Sergey Khramchenkov 2022.10.11 06:27
                  Thank you !!!
                  Roman Kovalenko
                  1050
                  Roman Kovalenko 2021.10.12 07:36 
                   

                  хорошая работа.Достойный индикатор.

                  Sergey Khramchenkov
                  1860
                  Antwort vom Entwickler Sergey Khramchenkov 2021.10.13 19:26
                  Спасибо !!!
                  Antwort auf eine Rezension
                  Version 3.2 2023.03.15
                  - Fixed some technical details.
                  Version 3.1 2022.12.16
                  - Fixed some technical details in the program code.
                  Version 3.0 2022.12.02
                  - Updated the formula for determining which Volume POC Levels to keep showing.
                  - Added the display of Points from Dynamic POC indicator. Volume POC Levels are drawn from the beginning of the Volume Profile and Dynamic POC Points are shown from the end of the Volume Profile.
                  Version 2.1 2022.10.09
                  - Corrected the problem with determining the history of the indicator calculation bars.
                  Version 2.0 2022.09.01
                  - The indicator automatically selects the data source (from M1, M5, M15 or M30 timeframes).
                  - The indicator automatically determines the height of the Volume POC Levels (zones).
                  - Fixed some technical issues.
                  Version 1.31 2021.03.16
                  Fixed an issue with the alert when selecting a TF lower than H4.