• Übersicht
  • Bewertungen (40)
  • Diskussion (21)
  • Neue Funktionen

Tabajara VWAP Ogro RSJ

4.81
Setup Tabajara wurde von einem brasilianischen Händler namens "The OGRO of Wall Street" erstellt.

Die Idee dieses Setups besteht darin, dem Händler den aktuellen Trend der Preise und die Art der Operation anzuzeigen, nach der in der Grafik gesucht werden sollte.

Betrieb

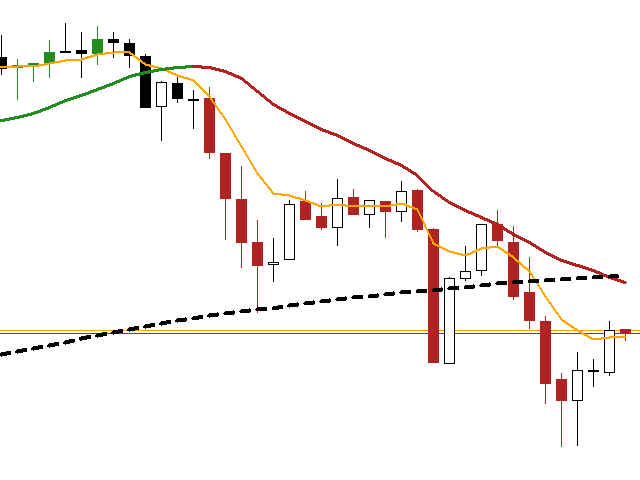
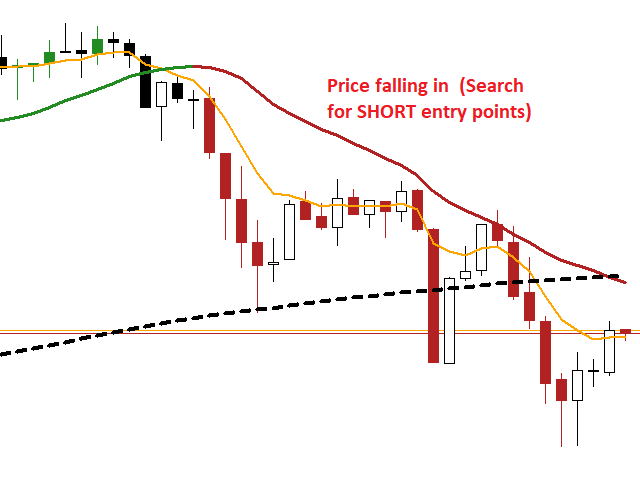
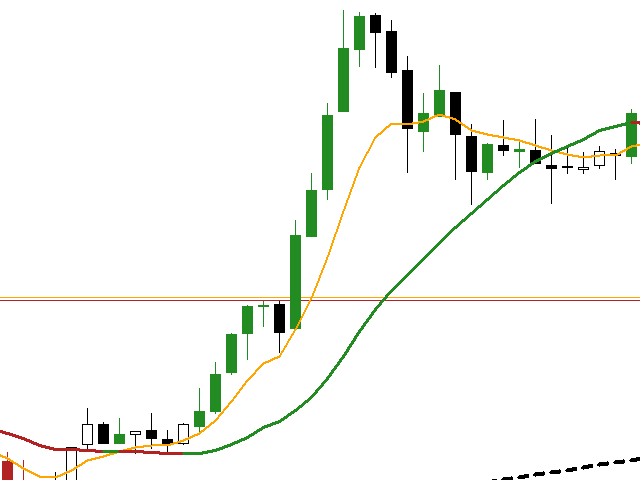
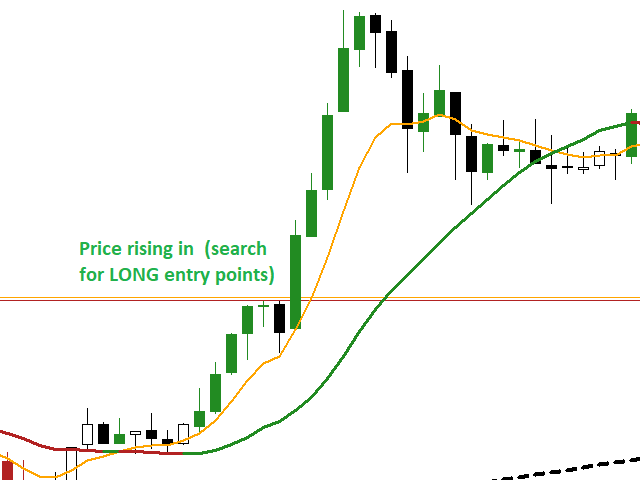
  • Dies geschieht durch die Positionierung des Schließens der Kerzen und des VWAP bis 10:40 Uhr und danach durch das arithmetische Mittel von 20 Perioden, die die Kerzen in 4 möglichen Farben bemalen:
    • Grün -> Preis steigt im Aufwärtstrend (Einstiegspunkte für KAUF suchen)
    • Schwarz -> Preiskorrektur im bullischen Trend (Einstiegspunkte für Kauf suchen)
    • Rot -> Preis fällt im Abwärtstrend (Einstiegspunkte für Verkauf suchen)
    • Weiß -> Preiskorrektur im Abwärtstrend (Einstiegspunkte suchen)
  • Außerdem setze ich noch folgende Indikatoren in das Skript:
    • Exponentieller Durchschnitt von 8 Perioden: Um kurzfristige Preisbewegungen zu identifizieren
    • Arithmetischer Durchschnitt von 50 Perioden: Um mittelfristige Preisbewegungen zu erkennen
    • Exponentieller Durchschnitt von 80 Perioden: Zur Identifizierung mittelfristiger Preisbewegungen
    • Arithmetischer Durchschnitt von 200 Perioden: Um langfristige Preisbewegungen zu erkennen

Wenn Sie noch Fragen haben, kontaktieren Sie mich bitte per Direktnachricht: https://www.mql5.com/de/users/robsjunqueira/


Bewertungen 20
Tanya Silver
24
Tanya Silver 2024.02.06 21:38 
 

Awesome indicator. Simple, customisable, effective.

mohamad.H Valipour
295
mohamad.H Valipour 2023.12.15 12:34 
 

awesome

eduardonascimentto23
14
eduardonascimentto23 2023.08.30 02:38 
 

Já uso a muito tempo... MARAVILHOSO

Empfohlene Produkte
Pivot Point Fibo RSJ ist ein Indikator, der die Unterstützungs- und Widerstandslinien des Tages mithilfe von Fibonacci-Kursen verfolgt. Dieser spektakuläre Indikator erzeugt bis zu 7 Unterstützungs- und Widerstandsebenen durch Pivot Point unter Verwendung von Fibonacci-Kursen. Es ist fantastisch, wie die Preise jedes Niveau dieser Unterstützung und dieses Widerstands respektieren, wo es möglich ist, mögliche Einstiegs- / Ausstiegspunkte einer Operation zu erkennen. Merkmale Bis zu 7 Unter
FREE
Bollinger colorido
Sergio Domingues
5 (1)
Funciona como bandas de bollinger normais. Criado por Joe Ross, é um setup de maior risco por ser contra-tendência. Pode ser usado para Day Trade, Swing Trade e Position. Para identificar, é necessário inserir no gráfico as Bandas de Bollinger, com uma Média Móvel Simples de 20 períodos e largura (desvio) 2. Verifica-se um fechamento de determinado candle abaixo da banda inferior de Bollinger. Se o próximo candle fechar dentro das Bandas, marca-se a máxima dele. O rompimento dessa máxima será o
FREE
Rejection Zones
Paulo Henrique Faquineli Garcia
Este poderoso indicador analisa o gráfico e mostra zonas de Rejeição de Preços! Isto é, locais onde o preço foi, mas não foi aceito pelo mercado! A visualização desta zona de Rejeição, facilita o entendimento do trader na tomada de decisões de onde operar e como operar! O indicador é composto por 4 linhas, sendo classificadas em 2 grupos: Linhas Vermelha e Amarela: Denotam os extremos onde o preço conseguiu chegar, mas não foi aceito! Linhas Laranja e Azul: A partir delas, denotam o Início da
FREE
Price Momentum
Flavio Javier Jarabeck
4.92 (13)
Value Chart indicator presents the Price evolution in a new form. This indicator, Price Momentum , was developed taking all the calculations presented in the book " Dynamic Trading Indicators " by Mark W. Helweg and David Stendahl (2002). The technique involves de-trended Prices from a user-defined Period of analysis and the addition of a Volatility index correction. The result is an Oscillator with 3 zones: Fair Price Value, Overbought/Oversold and Extremely Overbought/Oversold zones. Adding th
FREE
LT Donchian Channel
Thiago Duarte
4.75 (4)
Donchian Channel is an indicator created by Richard Donchian. It is formed by taking the highest high and the lowest low of the last specified period in candles. The area between high and low is the channel for the chosen period. Its configuration is simple. It is possible to have the average between the upper and lower lines, plus you have alerts when price hits one side. If you have any questions or find any bugs, please contact me. Enjoy!
FREE
Donchian Clouds
Samuel Manoel De Souza
The Indicator indicator draws 2 clouds based on Donchian Channels indicator values. The upper cloud is formed by the upper lines values and the lower cloud by the lowers lines values. The indicator allows to change the Channels parameters and the clouds colors the period of the base line and the multiplier of each Donchian Channels instance. The indicator holds 5 buffer index as follow: [0] - Outer values of the upper cloud [1]  - Inner values of the upper cloud [2]  - Base/Center line values [3
FREE
Projected Volume
Fernando Lahude Ritter
Volume Projection Indicator The Volume Projection Indicator is a specialized tool designed for traders who focus on the relationship between volume and price action. This intuitive indicator projects the expected volume for the ongoing candle, aiding in decision-making during live market conditions. The indicator presents volume data in a histogram format directly on the chart for quick analysis. Features: Bullish Volume Representation : Each green bar in the histogram signifies the volume for a
FREE
Tabajara V5
Flavio Javier Jarabeck
4.87 (38)
Metatrader 5 version of the famous Andre Machado's Tabajara indicator. If you don't know Andre Machado's Technical Analysis work you don't need this indicator... For those who need it and for those several friend traders who asked this porting from other platforms, here it is... FEATURES 8-period Moving Average 20-period Moving Average 50-period Moving Average 200-period Moving Average Colored candles according to the inflexion of the 20-period MA SETTINGS You can change the Period of all M
FREE
Wave Box Market Frenquency
Jean Jacques Huve Ribeiro
4.83 (6)
Totally linked to the result of a movement and the duration he had. Its height records how many ticks the asset walked during a given movement, its width shows us the duration that movement had. Its configuration must be in line with the Weis Wave Indicator configuration to observe the movement force and can indicate a possible accumulation or distribution of the movement;
FREE
MACD Mago Trader
Flavio Javier Jarabeck
4.4 (5)
For those traders and students who follow the famous brazilian trader Igor Rodrigues (Mago Trader) here it is another tool he uses: a 2-line MACD specially set with Phi ratios. This MACD is packed with a twist: a Filling Area , to easily and visually spot the corresponding trend on the chart. Obviously, you can turn On and Off this filling feature. If you don't know Igor Rodrigues and you are a brazilian trader and student, just google for him... Very simple and useful indicator. If you are lo
FREE
MACD Intraday Trend ist ein Indikator, der durch eine Adaption des ursprünglichen MACD von Gerald Appel in den 1960er Jahren entwickelt wurde. Im Laufe der Jahre des Handels wurde beobachtet, dass wir durch die Änderung der Parameter des MACD mit Fibonacci-Proportionen eine bessere Darstellung der Kontinuität der Trendbewegungen erreichen, wodurch es möglich ist, den Beginn und das Ende eines Preistrends effizienter zu erkennen. Aufgrund seiner Effizienz bei der Erkennung von Kurstrends ist
FREE
MIDAS Super VWAP
Flavio Javier Jarabeck
4.29 (14)
Imagine VWAP, MVWAP and MIDAS in one place... Well, you found it! Now you can track the movement of Big Players in various ways, as they in general pursue the benchmarks related to this measuring, gauging if they had good execution or poor execution on their orders. Traders and analysts use the VWAP to eliminate the noise that occurs throughout the day, so they can measure what prices buyers and sellers are really trading. VWAP gives traders insight into how a stock trades for that day and deter
FREE
Indicador Regressão Linear – Par de Ativos Indicador é um oscilador que faz o plot do Resíduo resultado da regressão linear entre os dois ativos inseridos como input do indicador, representado pela fórmula: Y = aX + b + R Onde Y é o valor do ativo dependente, X é o valor do ativo independente, a é a inclinação da reta entre os dois ativos, b é a intersecção da reta e R é o resíduo. O resíduo representa a quantidade da variabilidade que Y que o modelo ajustado não consegue explicar. E os resíduos
FREE
High Low Open Close
Alexandre Borela
4.97 (35)
Wenn Sie dieses Projekt mögen, hinterlassen Sie eine 5-Sterne-Bewertung. Folgen Sie instagram: borelatech Dieser Indikator zieht die offenen, hohen, niedrigen und schließenden Preise für die angegebenen und kann für eine bestimmte Zeitzone eingestellt werden. Dies sind wichtige Ebenen, die von vielen institutionellen und professionellen Händler und kann nützlich sein, um die Orte, wo sie vielleicht mehr aktiv. Die verfügbaren Zeiträume sind: Vorheriger Tag. Vorherige Woche. Vorheriger Monat
FREE
PZ Oscillator MT5
PZ TRADING SLU
3.8 (10)
This is a smooth and responsive accelerometer which reveals the market trend and strength. [ Installation Guide | Update Guide | Troubleshooting | FAQ | All Products ] Two moving averages indicate trend direction The histogram represents strength of the price movement It draws buy and sell zones as colored vertical lines Should be used as a confirmation indicator Customizable line widths and colors It implements alerts of all kinds This indicator is similar to MACD but aims to react faster t
FREE
MACD Colored ZeroLag
Farzin Sadeghi Bonjar
4.14 (7)
It is the MQL5 version of zero lag MACD that was available for MT4 here: https://www.mql5.com/en/code/9993 Also there was a colored version of it here but it had some problems: https://www.mql5.com/en/code/8703 I fixed the MT4 version which has 95 lines of code. It took me 5 days to write the MT5 version.(reading the logs and testing multiple times and finding out the difference of MT5 and MT4!) My first MQL5 version of this indicator had 400 lines of code but I optimized my own code again and n
FREE
Stackable VWAP
Flavio Javier Jarabeck
3.33 (6)
Volume Weighted Average Price (VWAP) is a trading benchmark commonly used by Big Players that gives the average price a Symbol has traded throughout the day. It is based on both Volume and price. Additionally we put in this indicator the MVWAP (Moving Volume Weighted Average Price). For those who do not know the usage and the importance od this indicator I recommend a great article about this subject at Investopedia ( https://www.investopedia.com/articles/trading/11/trading-with-vwap-mvwap.asp
FREE
Donchian Pro
Paulo Henrique Faquineli Garcia
5 (2)
The Donchian Channel Channels are among the most popular tools of technical analysis, as they visually convey to the analyst the limits within which most price movement tends to occur. Channel users know that valuable information can be obtained at any time, whether prices are in the central region of a band or close to one of the border lines. One of the best known techniques to explore these concepts is Bollinger Bands. However, John Bollinger was not the only one to research the applicatio
FREE
Follow The Line MT5
Oliver Gideon Amofa Appiah
4.4 (30)
This indicator obeys the popular maxim that: "THE TREND IS YOUR FRIEND" It paints a GREEN line for BUY and also paints a RED line for SELL. (you can change the colors). It gives alarms and alerts of all kinds. IT DOES NOT REPAINT and can be used for all currency pairs and timeframes. Yes, as easy and simple as that. Even a newbie can use it to make great and reliable trades. NB: For best results, get my other premium indicators for more powerful and reliable signals. Get them here: https://www.m
FREE
The   OHLC indicator   shows the current and historical values of High, Low, Open, Close and Mid for a specific time period. It can plot the current values or the values from the previous session. The indicator's range can be calculated from a daily, weekly, monthly, or user-specified session. Levels High  of the current or previous session. Low  of the current or previous session. Open  of current or previous session. Close  of the current or previous session. Midpoint  of the current or pre
FREE
This is the best Support and Resistance Indicator on the market, and it shows both confirmed Support and Resistance as well as Retests. Support & Resistance: Support marks where buying demand halts price declines, acting as a safety net. Resistance caps price surges, driven by selling pressure. Traders leverage these levels to predict reversals, plan entries, exits, and manage risks, making them trading's fundamental guideposts. You can also find Premium and Discount Levels, Strong High/Low,  
FREE
Cybertrade Keltner Channels
Emanuel Andriato
4.67 (3)
Cybertrade Keltner Channels - MT5 Created by Chester Keltner, this is a volatility indicator used by technical analysis. It is possible to follow the trend of financial asset prices and generate support and resistance patterns. In addition, envelopes are a way of tracking volatility in order to identify opportunities to buy and sell these assets. It works on periods longer than the period visible on the chart. All values ​​are available in the form of buffers to simplify possible automations.
FREE
Bollinger Bands B
Flavio Javier Jarabeck
5 (3)
John Bollinger created this indicator in 2010 as a way to read the original indicator (Bollinger Bands) in a more "technical" way, shown as an oscillator. The typical range of the Bollinger Bands %B is 0 - 0.5 - 1.0, where "0" represents the lower band, the "0.5" the middle band, and "1" the upper band. The line on the indicator represents the Closing prices. As simple as that. SETTINGS Bollinger Bands period of analysis Standard Deviation multiplier Shift Price type to be analyzed If you
FREE
Supports And Resistances Lines
Francisco Gomes Da Silva
4.76 (38)
Indikator für Unterstützungs- und Widerstandszonen MT5 Dieser Indikator kann Hochs und Tiefs automatisch erkennen. Dieser Unterstützungs- und Widerstandsindikator erstellt Unterstützungslinien und Widerstandslinien basierend auf Hochs und Tiefs. wie man Unterstützungs- und Widerstandslinien erstellt. Dies ist ein Indikator, um automatische Unterstützungs- und Widerstandslinien zu erstellen. wie man das Unterstützungsniveau mit dem Indikator findet. Dieser Indikator findet automatisch Hochs und T
FREE
SDivergence
Mobin Zarekar
1 (1)
SDivergence Indicator calculates and shows regular divergences and hidden divergences for MACD and Stochastic(for now). The benefit of this indicator is multiple input variables. Using these inputs you can modify to get more adaptive RD and HD's to your strategy. Guide : 1- First put your desired oscillator (MACD or Stochastic or Both) on the chart. 2- Run SDivergence indicator and set corresponding sub-window index of previously put oscillator in SDivergence input window. -Note: the chart sub-w
FREE
LT Colored Fibo
Thiago Duarte
4.33 (6)
LT Colored Fibo is a simple indicator that paints the price zones between Fibonacci Retracement levels. Its configuration is extremely simple. It is possible to change the colors of each level of the retracement, choose between background or front of the chart and also work only with the current asset or all open. If you found a bug or have any suggestion for improvement, please contact me. Enjoy! This is a free indicator, but it took hours to develop. If you want to pay me a coffee, I appreci
FREE
What is this indicator? This indicator is the MACD (Moving Average Convergence/Divergence) supporting Virtual Trading mode of  Knots Compositor . When the mode is turned on, the indicator will be recalculated based on the displayed candlesticks. When the mode is turned off, the indicator will be recalculated based on the original chart candlesticks. Types of the applied price - Close - Open - High - Low - Median Price (HL/2) - Typical Price (HLC/3) - Weighted Price (HLCC/4) KC-Indicators
FREE
Midas VWAP
Paulo Henrique Faquineli Garcia
4 (1)
Volume Weighted Average Price (VWAP) is a trading benchmark commonly used by Big Players that gives the average price a Symbol has traded throughout the day. It is based on both Volume and price. This indicator contains Daily VWAP and MIDAS' VWAP, which means you are able to anchor the beggining of MIDAS' calculations and, therefore you will be able to use this methodology to study price versus volume moves after anchor point. You will be able to anchor up to 3 HIGH MIDAS VWAP's and 3 LOW. Wis
FREE
Rainbow MT5
Jamal El Alama
4.33 (3)
Description : Rainbow MT5 is a technical indicator based on Moving Average with period 34 and very easy to use. When price crosses above MA and MA changes color to green, then this is a signal to buy. When price crosses below MA and MA changes color to red, then this is a signal to sell. The Expert advisor ( Rainbow EA MT5 ) based on Rainbow MT5 indicator is now available here . MT4 version is available here .
FREE
Show Pips for MT5
Roman Podpora
4.59 (17)
This information indicator will be useful for those who always want to be aware of the current situation on the account. - More useful indicators The indicator displays data such as profit in points, percentage and currency, as well as the spread for the current pair and the time until the bar closes on the current timeframe. There are several options for placing the information line on the chart: - To the right of the price (runs behind the price); - As a comment (in the upper left corner
FREE
Käufer dieses Produkts erwarben auch
Atomic Analyst MT5
Issam Kassas
4.22 (9)
Zunächst einmal ist es erwähnenswert, dass dieser Handelsindikator nicht neu malt, nicht neu zeichnet und keine Verzögerung aufweist, was ihn sowohl für manuellen als auch für Roboterhandel ideal macht. Der Atom-Analyst ist ein PA-Preisaktionsindikator, der die Stärke und das Momentum des Preises nutzt, um einen besseren Vorteil auf dem Markt zu finden. Ausgestattet mit fortschrittlichen Filtern, die helfen, Rauschen und falsche Signale zu entfernen, und das Handelspotenzial zu erhöhen. Durch
Zunächst einmal ist es wichtig zu betonen, dass dieses Handelssystem ein Nicht-Repainting-, Nicht-Redrawing- und Nicht-Verzögerungsindikator ist, was es sowohl für manuelles als auch für automatisches Trading ideal macht. Das "Smart Trend Trading System MT5" ist eine umfassende Handelslösung, die für neue und erfahrene Trader maßgeschneidert ist. Es kombiniert über 10 Premium-Indikatoren und bietet mehr als 7 robuste Handelsstrategien, was es zu einer vielseitigen Wahl für verschiedene Marktbe
Quantum Trend Sniper
Bogdan Ion Puscasu
5 (36)
Wir stellen vor       Quantum Trend Sniper Indicator   , der bahnbrechende MQL5-Indikator, der die Art und Weise, wie Sie Trendumkehrungen erkennen und handeln, verändert! Entwickelt von einem Team erfahrener Händler mit über 13 Jahren Handelserfahrung,       Quantum Trend Sniper-Indikator       wurde entwickelt, um Ihre Trading-Reise mit seiner innovativen Methode zur Identifizierung von Trendumkehrungen mit extrem hoher Genauigkeit auf ein neues Niveau zu heben. ***Kaufe Quantum Trend Snipe
Trend Screener Pro MT5
STE S.S.COMPANY
4.88 (60)
Nutzen Sie die Macht des Trendhandels mit Trend Screener Indicator: Ihrer ultimativen Trendhandelslösung, die auf Fuzzy-Logik und einem System mit mehreren Währungen basiert! Steigern Sie Ihren Trendhandel mit Trend Screener, dem revolutionären Trendindikator mit Fuzzy-Logik. Es handelt sich um einen leistungsstarken Trendfolgeindikator, der über 13 Premium-Tools und -Funktionen sowie 3 Handelsstrategien kombiniert und ihn zu einer vielseitigen Wahl macht, um Ihren Metatrader in einen Trendanaly
Gold Stuff mt5
Vasiliy Strukov
4.88 (162)
Gold Stuff mt5-Ein Trendindikator, der speziell für Gold entwickelt wurde, kann auch auf allen Finanzinstrumenten verwendet werden. Der Indikator wird nicht neu gezeichnet und verzögert sich nicht. Empfohlener Zeitrahmen H1. WICHTIG! Kontaktieren Sie mich sofort nach dem Kauf, um Anweisungen und Bonus zu erhalten! DATEN Draw Arrow - inkl.aus. zeichnen von Pfeilen in einem Diagramm. Alerts-inkl.aus.akustische Warnungen. E - mail notification-inkl.aus. benachrichtigungen per E-Mail. Puch-
Advanced Supply Demand MT5
Bernhard Schweigert
4.53 (15)
Derzeit 33% Rabatt! Die beste Lösung für jeden Anfänger oder erfahrenen Händler! Dieser Indikator ist ein einzigartiges, qualitativ hochwertiges und erschwingliches Trading-Tool, da wir eine Reihe von proprietären Funktionen und eine neue Formel integriert haben. Mit diesem Update werden Sie in der Lage sein, doppelte Zeitrahmenzonen anzuzeigen. Sie können nicht nur einen höheren TF (Zeitrahmen) anzeigen, sondern sowohl den Chart-TF als auch den höheren TF: SHOWING NESTED ZONES. Alle Supply Dema
Zunächst einmal ist es wichtig zu betonen, dass dieses Handelstool ein Nicht-Repaint-, Nicht-Redraw- und Nicht-Verzögerungsindikator ist, was es ideal für professionelles Trading macht. Der Smart Price Action Concepts Indikator ist ein sehr leistungsstarkes Werkzeug sowohl für neue als auch erfahrene Händler. Er vereint mehr als 20 nützliche Indikatoren in einem und kombiniert fortgeschrittene Handelsideen wie die Analyse des Inner Circle Traders und Strategien des Smart Money Concepts. Diese
RelicusRoad Pro MT5
Relicus LLC
4.81 (21)
Jetzt 147 US -Dollar (nach ein paar Aktualisierungen auf 499 US -Dollar) - Unbegrenzte Konten (PCs oder MACs) RelicusRoad Benutzerhandbuch + Schulungsvideos + Zugang zur privaten Discord-Gruppe + VIP-Status EINE NEUE ART, DEN MARKT ZU BETRACHTEN RelicusRoad ist der weltweit leistungsstärkste Handelsindikator für Forex, Futures, Kryptowährungen, Aktien und Indizes und gibt Händlern alle Informationen und Tools, die sie benötigen, um profitabel zu bleiben. Wir bieten technische Analysen un
FX Power MT5 NG
Daniel Stein
5 (4)
Erhalten Sie Ihr tägliches Marktupdate mit Details und Screenshots über unser Morning Briefing hier auf mql5 und auf Telegram ! FX Power MT5 NG ist die nächste Generation unseres langjährig sehr beliebten Währungsstärkemessers FX Power. Und was bietet dieser Stärkezähler der nächsten Generation? Alles, was Sie am ursprünglichen FX Power geliebt haben PLUS GOLD/XAU-Stärkeanalyse Noch präzisere Berechnungsergebnisse Individuell konfigurierbare Analysezeiträume Anpassbares Berechnungslimit für noc
FX Volume MT5
Daniel Stein
4.94 (17)
Erhalten Sie Ihr tägliches Marktupdate mit Details und Screenshots über unser Morning Briefing hier auf mql5 und auf Telegram ! FX Volume ist der ERSTE und EINZIGE Volumenindikator, der einen ECHTEN Einblick in die Marktstimmung aus Sicht eines Brokers bietet. Es bietet fantastische Einblicke in die Positionierung von institutionellen Marktteilnehmern, wie z.B. Brokern, auf dem Forex-Markt, viel schneller als COT-Berichte. Diese Informationen direkt auf Ihrem Chart zu sehen, ist der wahre Game
AW Trend Predictor MT5
AW Trading Software Limited
4.76 (54)
Die Kombination von Trend- und Aufschlüsselungsebenen in einem System. Ein fortschrittlicher Indikatoralgorithmus filtert Marktrauschen, bestimmt den Trend, Einstiegspunkte sowie mögliche Ausstiegsniveaus. Indikatorsignale werden in einem Statistikmodul aufgezeichnet, das es Ihnen ermöglicht, die am besten geeigneten Tools auszuwählen, die die Wirksamkeit der Signalhistorie zeigen. Der Indikator berechnet Take-Profit- und Stop-Loss-Marken. Handbuch und Anleitung ->   HIER   / MT4-Version ->   H
Dies ist ein Indikator für MT5, der genaue Signale für den Einstieg in einen Handel ohne Repainting (Neuzeichnen) liefert. Er kann auf alle Finanzwerte angewendet werden: Forex, Kryptowährungen, Metalle, Aktien, Indizes. Er liefert ziemlich genaue Schätzungen und sagt Ihnen, wann es am besten ist, eine Position zu eröffnen und zu schließen. Sehen Sie sich das Video (6:22) mit einem Beispiel für die Verarbeitung nur eines Signals an, das sich für den Indikator gelohnt hat! Die meisten Händler ver
TPSpro TRENDPRO  - is a trend indicator that automatically analyzes the market and provides information about the trend and each of its changes, as well as giving signals for entering trades without redrawing! The indicator uses each candle, analyzing them separately. referring to different impulses - up or down impulse. Exact entry points into transactions for currencies, crypto, metals, stocks, indices!  -  Version MT4                  DETAILED DESCRIPTION        /       TRADING SETUPS       
Wir stellen vor       Quantum Breakout PRO   , der bahnbrechende MQL5-Indikator, der die Art und Weise, wie Sie mit Breakout-Zonen handeln, verändert! Entwickelt von einem Team erfahrener Händler mit über 13 Jahren Handelserfahrung,       Quantum Breakout PRO       ist darauf ausgelegt, Ihre Handelsreise mit seiner innovativen und dynamischen Breakout-Zone-Strategie auf ein neues Niveau zu heben. Der Quantum Breakout Indicator zeigt Ihnen Signalpfeile auf Breakout-Zonen mit 5 Gewinnzielzone
TrendDecoder Premium MT5
Christophe, Pa Trouillas
5 (1)
Top bewertet auf anderem MarketPlace -  Jetzt verfügbar auf METATRADER Identifizieren Sie Bereiche und die nächsten wahrscheinlichen Bewegungen     |    Erhalten Sie früheste Signale und die Stärke von Trends     |    Klare Ausstiegssignale vor Umkehrung     |    Erkennen Sie die Fibo-Levels, die der Kurs testen wird    |  Indikator, der nicht zurückverfolgt, nicht verzögert - ideal für den manuellen und automatisierten Trading - geeignet für alle Vermögenswerte und Zeiteinheiten - 50% Rabatt  
Bill Williams Advanced
Siarhei Vashchylka
5 (3)
Bill Williams Advanced is designed for automatic chart analysis using Bill Williams' "Profitunity" system. The indicator analyzes four timeframes at once. Manual (Be sure to read before purchasing) Advantages 1. Automatically analyzes the chart using the "Profitunity" system of Bill Williams. The found signals are placed in a table in the corner of the screen. 2. Equipped with a trend filter based on the Alligator indicator. Most of the system signals are recommended to be used only accordi
XQ Indicator MetaTrader 5
Marzena Maria Szmit
5 (1)
Step into the realm of Forex trading with confidence and precision using XQ, a cutting-edge Forex indicator designed to elevate your trading game to unprecedented heights. Whether you're a seasoned trader or just stepping into the world of currency exchange, XQ Forex Indicator empowers you with the insights and signals needed to make informed trading decisions. The signal conditions are a combination of three indicators, and XQ Forex Indicator only display  medium and long-term trends . The ind
Werden Sie Breaker Trader und profitieren Sie von Änderungen der Marktstruktur, wenn sich der Preis umkehrt. Der Order Block Breaker Indikator zeigt an, wann sich eine Trend- oder Preisbewegung der Erschöpfung nähert und bereit ist, sich umzukehren. Es weist Sie auf Änderungen in der Marktstruktur hin, die normalerweise auftreten, wenn eine Umkehrung oder ein größerer Rückzug bevorsteht. Der Indikator verwendet eine proprietäre Berechnung, die Ausbrüche und Preisdynamik identifiziert. Jedes
Auto Order Block with break of structure based on ICT and Smart Money Concepts Futures Break of Structure ( BoS )             Order block ( OB )            Higher time frame Order block / Point of Interest ( POI )    shown on current chart           Fair value Gap ( FVG ) / Imbalance   ,  MTF      ( Multi Time Frame )    Volume Imbalance     ,  MTF          vIMB Gap’s Equal High / Low’s     ,  MTF             EQH / EQL Liquidity               Current Day High / Low           HOD /
IX Power MT5
Daniel Stein
5 (1)
IX Power   bringt die unschlagbare Präzision von FX Power endlich auch zu Nicht-Forex-Symbolen. Es bestimmt präzise die Intensität von kurz-, mittel- und langfristigen Trends in Ihren Lieblingsindizes, Aktien, Rohstoffen, ETFs und sogar Kryptowährungen. Sie können   alles analysieren, was   Ihr Terminal zu bieten hat. Probieren Sie es aus und erleben Sie, wie   sich Ihr Timing   beim Handel   deutlich verbessert . IX Power Hauptmerkmale 100% präzise, nicht nachpinselnde Berechnungsergebni
The Volume by Price Indicator for MetaTrader 5 features Volume Profile and Market Profile TPO (Time Price Opportunity). Get valuable insights out of currencies, equities and commodities data. Gain an edge trading financial markets. Volume and TPO histogram bar and line charts. Volume Footprint charts. TPO letter and block marker charts including split structures. Versatile segmentation and compositing methods. Static, dynamic and flexible ranges with relative and/or absolute visualizations. Lay
TrendLine PRO MT5
Evgenii Aksenov
4.78 (49)
The Trend Line PRO indicator is an independent trading strategy. It shows the trend change, the entry point to the transaction, as well as automatically calculates three levels of Take Profit and Stop Loss protection Trend Line PRO is perfect for all Meta Trader symbols: currencies, metals, cryptocurrencies, stocks and indices Advantages of Trend Line PRO Never redraws its signals The possibility of using it as an independent strategy It has three automatic levels Take Profit and Stop Loss lev
ICT, SMC, SMART MONEY CONCEPTS, SMART MONEY, Smart Money Concept, Support and Resistance, Trend Analysis, Price Action, Market Structure, Order Blocks, BOS/CHoCH,   Breaker Blocks ,  Momentum Shift,   Supply&Demand Zone/Order Blocks , Strong Imbalance,   HH/LL/HL/LH,    Fair Value Gap, FVG,  Premium  &   Discount   Zones, Fibonacci Retracement, OTE, Buy Side Liquidity, Sell Side Liquidity, BSL/SSL Taken, Equal Highs & Lows, MTF Dashboard, Multiple Time Frame, BigBar, HTF OB, HTF Market Structure
Quantum Heiken Ashi PRO MT5
Bogdan Ion Puscasu
4.5 (8)
Wir stellen den   Quantum Heiken Ashi PRO   vor Die Heiken-Ashi-Kerzen wurden entwickelt, um klare Einblicke in Markttrends zu geben und sind bekannt für ihre Fähigkeit, Rauschen herauszufiltern und falsche Signale zu eliminieren. Verabschieden Sie sich von verwirrenden Preisschwankungen und begrüßen Sie eine glattere, zuverlässigere Diagrammdarstellung. Was den Quantum Heiken Ashi PRO wirklich einzigartig macht, ist seine innovative Formel, die traditionelle Candlestick-Daten in leicht lesbare
Gartley Hunter Multi
Siarhei Vashchylka
5 (5)
Gartley Hunter Multi - An indicator for searching for harmonic patterns simultaneously on dozens of trading instruments and on all classic timeframes: (m1, m5, m15, m30, H1, H4, D1, Wk, Mn). Manual (Be sure to read before purchasing) | Version for MT4 Advantages 1. Patterns: Gartley, Butterfly, Shark, Crab. Bat, Alternate Bat, Deep Crab, Cypher 2. Simultaneous search for patterns on dozens of trading instruments and on all classic timeframes 3. Search for patterns of all possible sizes. Fr
Was: $249  Now: $99   Market Profile defines a number of day types that can help the trader to determine market behaviour. A key feature is the Value Area, representing the range of price action where 70% of trading took place. Understanding the Value Area can give traders valuable insight into market direction and establish the higher odds trade. It is an excellent addition to any system you may be using. Inspired by Jim Dalton’s book “Mind Over Markets”, this indicator is designed to suit the
A key element in trading is zones or levels from which decisions to buy or sell a trading instrument are made. Despite attempts by major players to conceal their presence in the market, they inevitably leave traces. Our task was to learn how to identify these traces and interpret them correctly. Reversal First Impulse levels (RFI)   -  Version MT4                  INSTRUCTIONS                 RUS                 ENG                         R ecommended to use with an indicator   -  TREND PRO  
Owl Smart Levels MT5
Sergey Ermolov
4.47 (36)
MT4-Version  |  FAQ Der Owl Smart Levels Indikator ist ein komplettes Handelssystem innerhalb eines Indikators, der so beliebte Marktanalysetools wie die fortschrittlichen Fraktale von Bill Williams , Valable ZigZag, das die richtige Wellenstruktur des Marktes aufbaut, und Fibonacci-Levels , die die genauen Einstiegslevels markieren, enthält in den Markt und Orte, um Gewinne mitzunehmen. Detaillierte Strategiebeschreibung Anleitung zur Verwendung des Indikators Berater-Assistent im Handel Owl H
Swing Scanner MT5
Reza Aghajanpour
5 (5)
**   All Symbols   x   All Time frames   scan just by pressing scanner button ** ***Contact me after the purchase to send you instructions and add you in "Swing scanner group" for sharing or seeing experiences with other users. Introduction: Swing Scanner   is the indicator designed to detect swings in the direction of the trend and possible reversal swings. The indicator studies several price and time vectors to track the aggregate trend direction and detects situations in which the market is o
Dark Power MT5
Marco Solito
4.84 (56)
Dark Power  is an Indicator for intraday trading. This Indicator is based on   Trend Following  strategy, also adopting the use of an histogram to determine the right power . We can enter in good price with this Indicator, in order to follow the   strong trend   on the current instrument. The histogram is calculated based on the size of the bars and two moving averages calculated on the histogram determine the direction of the signal Key benefits Easily visible take profit/stop loss lines Int
Weitere Produkte dieses Autors
Der Kerzen-Timer-Countdown zeigt die verbleibende Zeit an, bevor der aktuelle Balken geschlossen wird und sich ein neuer Balken bildet. Es kann für das Zeitmanagement verwendet werden. MT4-Version hier ! Feature-Highlights Verfolgt die Serverzeit, nicht die lokale Zeit Konfigurierbare Textfarbe und Schriftgröße Optionale Visualisierung der täglichen Variation des Symbols Optimiert, um die CPU-Auslastung zu reduzieren Eingabeparameter Tagesvariation anzeigen: wahr/falsch Schriftgröße des
FREE
MACD Intraday Trend ist ein Indikator, der durch eine Adaption des ursprünglichen MACD von Gerald Appel in den 1960er Jahren entwickelt wurde. Im Laufe der Jahre des Handels wurde beobachtet, dass wir durch die Änderung der Parameter des MACD mit Fibonacci-Proportionen eine bessere Darstellung der Kontinuität der Trendbewegungen erreichen, wodurch es möglich ist, den Beginn und das Ende eines Preistrends effizienter zu erkennen. Aufgrund seiner Effizienz bei der Erkennung von Kurstrends ist
FREE
Der Kerzen-Timer-Countdown zeigt die verbleibende Zeit an, bevor der aktuelle Balken geschlossen wird und sich ein neuer Balken bildet. Es kann für das Zeitmanagement verwendet werden. MT5-Version hier ! Feature-Highlights Verfolgt die Serverzeit, nicht die lokale Zeit Konfigurierbare Textfarbe und Schriftgröße Optionale Visualisierung der täglichen Variation des Symbols Optimiert, um die CPU-Auslastung zu reduzieren Eingabeparameter Tagesvariation anzeigen: wahr/falsch Schriftgröße des
FREE
Candle Counter ist ein Indikator, der die Anzahl der Kerzen ab der ersten Kerze des Tages druckt. Die erste Kerze des Tages ist die Nummer 1 und jede neue Kerze wird in dieser Zählung um 1 erhöht. Eingabeparameter Wählen Sie aus gerade, ungerade oder alle Entfernung von Kerze zum Drucken der Zahl Schriftgröße des Textes Schriftfarbe des Textes Wenn Sie noch Fragen haben, kontaktieren Sie mich bitte per Direktnachricht:   https://www.mql5.com/de/users/robsjunqueira/
FREE
Pivot Point Fibo RSJ ist ein Indikator, der die Unterstützungs- und Widerstandslinien des Tages mithilfe von Fibonacci-Kursen verfolgt. Dieser spektakuläre Indikator erzeugt bis zu 7 Unterstützungs- und Widerstandsebenen durch Pivot Point unter Verwendung von Fibonacci-Kursen. Es ist fantastisch, wie die Preise jedes Niveau dieser Unterstützung und dieses Widerstands respektieren, wo es möglich ist, mögliche Einstiegs- / Ausstiegspunkte einer Operation zu erkennen. Merkmale Bis zu 7 Unter
FREE
MACD Intraday Trend ist ein Indikator, der durch eine Adaption des ursprünglichen MACD von Gerald Appel in den 1960er Jahren entwickelt wurde. Im Laufe der Jahre des Handels wurde beobachtet, dass wir durch die Änderung der Parameter des MACD mit Fibonacci-Proportionen eine bessere Darstellung der Kontinuität der Trendbewegungen erreichen, wodurch es möglich ist, den Beginn und das Ende eines Preistrends effizienter zu erkennen. Aufgrund seiner Effizienz bei der Erkennung von Kurstrends ist
FREE
Delta Aggression Volume PRO is an indicator developed to monitor the strength and continuity of the aggression volume of sell and buy negotiations. Note: This indicator DOES NOT WORK for Brokers and/or Markets WITHOUT the type of aggression (BUY or SELL). Cryptocurrencies and Forex do not provide this type of data, that is, it does not work with them. O Delta Agrression Volume PRO has features that allow you to view beyond the delta volume of the day. Operation Multi symbols  (those who pro
Pivot Point Fibo RSJ ist ein Indikator, der die Unterstützungs- und Widerstandslinien des Tages mithilfe von Fibonacci-Kursen verfolgt. Dieser spektakuläre Indikator erzeugt bis zu 7 Unterstützungs- und Widerstandsebenen durch Pivot Point unter Verwendung von Fibonacci-Kursen. Es ist fantastisch, wie die Preise jedes Niveau dieser Unterstützung und dieses Widerstands respektieren, wo es möglich ist, mögliche Einstiegs- / Ausstiegspunkte einer Operation zu erkennen. Merkmale Bis zu 7 Unter
FREE
Weis Waves RSJ
JETINVEST
4.67 (9)
The Weis Waves RSJ Indicator sums up volumes in each wave. This is how we receive a bar chart of cumulative volumes of alternating waves. Namely the cumulative volume makes the Weis wave charts unique. It allows comparing the relation of the wave sequence characteristics, such as correspondence of the applied force (expressed in the volume) and received result (the price progress). If you still have questions, please contact me by direct message:  https://www.mql5.com/en/users/robsjunqueira/
FREE
Tabajara Ogro
JETINVEST
4.75 (12)
Setup Tabajara was created by a Brazilian trader known as  "The OGRO of Wall Street" . The idea of this setup is to indicate to the trader the current trend of prices and  the type of operation should be looked for in the graph. Operation It does this through the relation of the closing price position and the     of 20 periods, by painting the candles in 4 possible colors : Green -> Price rising in upward trend (Search entry points for PURCHASE) Black -> Price correcting in Bullish Trend
FREE
VWAP Fibo Bands RSJ is an indicator that traces the lines of the daily VWAP and from it creates bands using Fibonacci proportions. This spectacular indicator creates 10 band levels through the selected VWAP period using Fibonacci ratios. It is fantastic how the prices respect each level of the bands, where it is possible to realize that almost every time the price closes above / below a level of the bands he will seek the next one. If close above will seek to reach the level above and if close
FREE
MACD Intraday Trend PRO ist ein Indikator, der durch eine Adaption des ursprünglichen MACD von Gerald Appel in den 1960er Jahren entwickelt wurde. Im Laufe der Jahre des Handels wurde beobachtet, dass wir durch die Änderung der Parameter des MACD mit Fibonacci-Proportionen eine bessere Darstellung der Kontinuität der Trendbewegungen erreichen, wodurch es möglich ist, den Beginn und das Ende eines Preistrends effizienter zu erkennen. Aufgrund seiner Effizienz bei der Erkennung von Kurstrends
Trend WIN B3
JETINVEST
5 (4)
Trend WIN B3 ist ein professionelles Handelssystem, das für die MT5-Plattform entwickelt und für die Arbeit mit MINI FUTURE INDEX (WIN) auf B3 in BRASILIEN optimiert wurde. Das System verwendet Fuzzy Logic in mehreren Zeitrahmen (1M, 5M, 15M, 30M, H1, H4, D1), um den Preistrend zu identifizieren, wobei in jedem Zeitrahmen Gewichtungen gemäß den durchgeführten Berechnungen angewendet werden. Nachdem der Trend erkannt wurde, platziert das System eine STOP-Order (KAUF oder VERKAUF) entsprechend de
MACD Intraday Trend PRO ist ein Indikator, der durch eine Adaption des ursprünglichen MACD von Gerald Appel in den 1960er Jahren entwickelt wurde. Im Laufe der Jahre des Handels wurde beobachtet, dass wir durch die Änderung der Parameter des MACD mit Fibonacci-Proportionen eine bessere Darstellung der Kontinuität der Trendbewegungen erreichen, wodurch es möglich ist, den Beginn und das Ende eines Preistrends effizienter zu erkennen. Aufgrund seiner Effizienz bei der Erkennung von Kurstrends
This simple indicator paints with a darker color on the volume bar when the quantity traded is above the average of select number of periods of the volume itself, highlighting the moments when there was a large volume of deals above the average. It is also possible to use a configuration of four colors where the color tone shows a candle volume strength. The indicator defaults to the simple average of 20 periods, but it is possible to change to other types of averages and periods. If you like
FREE
Vwap RSJ
JETINVEST
4.93 (14)
VWAP RSJ is an indicator that plots the Hourly, Daily, Weekly and Monthly  VWAP Lines. Large institutional buyers and   mutual funds   use the VWAP ratio to help move into or out of stocks with as small of a market impact as possible. Therefore, when possible, institutions will try to buy below the VWAP, or sell above it. This way their actions push the price back toward the average, instead of away from it. Based on this information I developed this indicator that combines 4 types of VWAP T
FREE
Sniper Major
JETINVEST
5 (1)
Der EA verwendet Volatilität, Spread, Häufigkeit und Timing, um zu entscheiden, wann er tradet. Der EA verwendet die Limit-Orders-Methode, um Positionen zu eröffnen. In diesem Fall wird die Slippage beim Ausführen der Eingaben allenfalls positiv sein. Der EA verwendet die Trailing Take Profit-Logik, da der Fokus des Systems darauf liegt, Geld zu verdienen und gleichzeitig Ihr Kapital zu schützen. Die meisten Trades werden schnell geschlossen, also wie ein Scharfschützen-Kopfschuss. Haupteigen
This indicator sums up the difference between the sells aggression and the buys aggression that occurred in each Candle, graphically plotting the waves of accumulation of the aggression volumes.   Through these waves an exponential average is calculated that indicates the direction of the business flow. Note: This indicator DOES NOT WORK for Brokers and/or Markets WITHOUT the type of aggression (BUY or SELL).   Be sure to try our Professional version with configurable features and alerts:  Agr
FREE
This indicator calculates the difference between the SELL aggression and the BUY aggression that occurred in each Candle, plotting the balance of each one graphically. Note: This indicator DOES NOT WORK for Brokers and/or Markets WITHOUT the type of aggression (BUY or SELL). Be sure to try our   Professional   version with configurable features and alerts:   Delta Agression Volume PRO Settings Aggression by volume (Real Volume) or by number of trades (Tick Volume) Start of the Aggression De
FREE
Netting Panel RSJ
JETINVEST
4.2 (5)
Funcionamento: O Painel  Netting Panel RSJ  funciona com   qualquer ativo   e em   qualquer tempo gráfico . Ele funciona em contas do tipo " Netting " e " Hedge ", mas gerencia apenas uma posição por ativo, por isso o nome   Netting.   Se ele for executado em contas do tipo " Hedge ", ele fará o gerenciamento e proteção   apenas da posição mais antiga , ou seja, da primeira posição que foi aberta por ele. Em contas " Netting " quando os botões " SELL " ou " BUY " forem pressionados,   ocorrer
FREE
This simple indicator paints with a darker color on the volume bar when the quantity traded is above the average of select number of periods of the volume itself, highlighting the moments when there was a large volume of deals above the average. It is also possible to use a configuration of four colors where the color tone shows a candle volume strength. The indicator defaults to the simple average of 20 periods, but it is possible to change to other types of averages and periods. If you like
FREE
RENKO PRICE ACTION ATR ist ein "Expert Advisor", der durch die Konstruktion des Renko-Charts entwickelt wurde, wobei jeder BRICK die Größe hat, die durch die ATR des vom Benutzer ausgewählten Zeitraums berechnet wird. Renko-Charts wurden entwickelt, um kleinere Preisbewegungen herauszufiltern und es Händlern so zu erleichtern, sich auf wichtige Trends zu konzentrieren. Aufgrund seiner Effizienz bei der Erkennung von Kurstrends ist es auch möglich, Unterstützungen und Widerstände sowie Top- und
Der Indikator Angebotsnachfrage RSJ PRO berechnet und zeichnet die Zonen "Angebot" und "Nachfrage" auf dem Diagramm, identifiziert den Zonentyp (schwach, stark, verifiziert, nachgewiesen) und zeigt im Falle von erneuten Tests der Zone an, wie oft es ist wurde erneut getestet. "Angebots"-Zonen sind die Preiszonen, in denen mehr Angebot als Nachfrage aufgetreten ist, was die Preise nach unten treibt. "Nachfrage"-Zonen sind die Preiszonen, in denen mehr Nachfrage als Angebot aufgetreten ist, was d
Aggression Wave PRO is an indicator developed to monitor the divergence, strength, and continuity of the aggression volume of sell and buy negotiations.  The  Agrression Wave PRO   has features that allow you to view beyond the accumulated delta volume of the day. Note: This indicator DOES NOT WORK for Brokers and/or Markets WITHOUT the type of aggression (BUY or SELL). Cryptocurrencies and Forex do not provide this type of information, that is, it does not work with it. Operation It is pos
Der Indikator Angebotsnachfrage RSJ PRO berechnet und zeichnet die Zonen "Angebot" und "Nachfrage" auf dem Diagramm, identifiziert den Zonentyp (schwach, stark, verifiziert, nachgewiesen) und zeigt im Falle von erneuten Tests der Zone an, wie oft es ist wurde erneut getestet. "Angebots"-Zonen sind die Preiszonen, in denen mehr Angebot als Nachfrage aufgetreten ist, was die Preise nach unten treibt. "Nachfrage"-Zonen sind die Preiszonen, in denen mehr Nachfrage als Angebot aufgetreten ist, was di
Trend WDO B3
JETINVEST
5 (2)
Trend WDO B3 ist ein professionelles Handelssystem, das für die MT5-Plattform entwickelt und für die Arbeit mit MINI DOLAR INDEX (WDO) auf B3 in BRASILIEN optimiert wurde. Das System verwendet Fuzzy Logic in mehreren Zeitrahmen (1M, 5M, 15M, 30M, H1, H4, D1), um den Preistrend zu identifizieren, wobei in jedem Zeitrahmen Gewichtungen gemäß den durchgeführten Berechnungen angewendet werden. Nachdem der Trend erkannt wurde, platziert das System eine STOP-Order (KAUF oder VERKAUF) entsprechend der
Der EA verwendet Volatilität, Spread, Häufigkeit und Timing, um zu entscheiden, wann er tradet. Der EA verwendet die Limit-Orders-Methode, um Positionen zu eröffnen. In diesem Fall wird die Slippage beim Ausführen der Eingaben allenfalls positiv sein. Der EA verwendet die Trailing Take Profit-Logik, da der Fokus des Systems darauf liegt, Geld zu verdienen und gleichzeitig Ihr Kapital zu schützen. Die meisten Trades werden schnell geschlossen, also wie ein Scharfschützen-Kopfschuss. Haupteigen
JetBot
JETINVEST
This is an EXPERT with a FOCUS on LEARNING and PROFESSIONAL DEVELOPMENT!!! The idea of this product is to commercialize the source code, allowing those who want to develop their own robots, or start a professional activity developing customized experts, to have a reference source code that helps them in the learning and development process. This source code will be increased, that is, new functionalities will be created, thus allowing the project to continue evolving. For every 10 sales a new v
Auswahl:
Tanya Silver
24
Tanya Silver 2024.02.06 21:38 
 

Awesome indicator. Simple, customisable, effective.

JETINVEST
245099
Antwort vom Entwickler Roberto Sant Ana Junqueira 2024.02.07 12:02
tks
mohamad.H Valipour
295
mohamad.H Valipour 2023.12.15 12:34 
 

awesome

JETINVEST
245099
Antwort vom Entwickler Roberto Sant Ana Junqueira 2023.12.15 13:00
tks
eduardonascimentto23
14
eduardonascimentto23 2023.08.30 02:38 
 

Já uso a muito tempo... MARAVILHOSO

JETINVEST
245099
Antwort vom Entwickler Roberto Sant Ana Junqueira 2023.08.30 11:44
Obrigado pelo review
TonyynoT
29
TonyynoT 2023.04.05 09:06 
 

Ótimo indicador! Só acho que os candles deveriam manter a cor do tipo se desce ficar vermelho... sobe ficar verde, porque confunde um pouco isso, mas é muito bom!

JETINVEST
245099
Antwort vom Entwickler Roberto Sant Ana Junqueira 2023.08.30 11:44
Bom dia Tony, mas o indicador pinta os candles conforme a posição das médias. Da uma lida na descrição que você vai compreender a ideia. Abraço
dallagnol81
17
dallagnol81 2023.02.17 15:04 
 

entrega o que esta descrito valeu

JETINVEST
245099
Antwort vom Entwickler Roberto Sant Ana Junqueira 2023.02.17 15:12
tks
teatime
76
teatime 2023.01.18 02:23 
 

very good indicator !!! tysm for many green pips !!!

JETINVEST
245099
Antwort vom Entwickler Roberto Sant Ana Junqueira 2023.02.17 15:12
tks
KinGor
71
KinGor 2023.01.05 13:46 
 

Der Benutzer hat keinen Kommentar hinterlassen

JETINVEST
245099
Antwort vom Entwickler Roberto Sant Ana Junqueira 2023.02.17 15:12
tks
kravaneda
19
kravaneda 2022.12.20 03:12 
 

Der Benutzer hat keinen Kommentar hinterlassen

JETINVEST
245099
Antwort vom Entwickler Roberto Sant Ana Junqueira 2022.12.20 18:17
obrigado pelo review
goldenjumper
47
goldenjumper 2022.10.17 22:31 
 

Show de bola! Estou tendo bons resultados.

JETINVEST
245099
Antwort vom Entwickler Roberto Sant Ana Junqueira 2022.10.18 11:42
obrigado pelo review
grummel2
14
grummel2 2022.09.19 20:04 
 

prima Indicator. sehr nützlich.

JETINVEST
245099
Antwort vom Entwickler Roberto Sant Ana Junqueira 2022.09.19 20:08
tks
DDDD7777777PPPP
44
DDDD7777777PPPP 2022.05.22 12:43 
 

Muito Bom!

JETINVEST
245099
Antwort vom Entwickler Roberto Sant Ana Junqueira 2022.09.19 20:08
obrigado
y728115
329
y728115 2022.04.30 04:02 
 

Thank you very much. I will utilize it.

JETINVEST
245099
Antwort vom Entwickler Roberto Sant Ana Junqueira 2022.04.30 15:54
tks
sanobalano
99
sanobalano 2022.04.28 10:38 
 

Very good indicator!!!

JETINVEST
245099
Antwort vom Entwickler Roberto Sant Ana Junqueira 2022.04.30 15:53
tks
Johan Taljaard
18
Johan Taljaard 2022.03.27 09:21 
 

Unable to get it working

JETINVEST
245099
Antwort vom Entwickler Roberto Sant Ana Junqueira 2022.03.28 01:18
explain....
dragonmark
175
dragonmark 2022.03.23 11:36 
 

Good indicator!

JETINVEST
245099
Antwort vom Entwickler Roberto Sant Ana Junqueira 2022.03.28 01:18
tks
Silvio Sam
18
Silvio Sam 2022.03.17 03:51 
 

muito bom funciona muito bem, está me ajudando bastante.

JETINVEST
245099
Antwort vom Entwickler Roberto Sant Ana Junqueira 2022.03.17 10:32
Aproveite
AyrtonMB
59
AyrtonMB 2022.03.09 21:57 
 

Muito bom auxiliar

JETINVEST
245099
Antwort vom Entwickler Roberto Sant Ana Junqueira 2022.03.09 21:59
obrigado
ahmadiiiii
198
ahmadiiiii 2022.02.28 07:58 
 

not bad

Jose Manuel Gonzalez Esquivel
57
Jose Manuel Gonzalez Esquivel 2022.02.27 13:56 
 

Excelente indicador, lo uso desde hace tiempo en Tradinview!

JETINVEST
245099
Antwort vom Entwickler Roberto Sant Ana Junqueira 2022.02.27 14:32
Obrigado
gfedrigo
94
gfedrigo 2022.02.23 11:30 
 

Excelente

JETINVEST
245099
Antwort vom Entwickler Roberto Sant Ana Junqueira 2022.02.27 14:31
Obrigado
12
Antwort auf eine Rezension
Version 1.20 2021.03.19
Fixed an error in which, depending on the settings, the SMA 20 was not plotted.
Version 1.10 2021.03.17
There was an error in the management of the VWAP calculation that sometimes caused it to lose reference.