Trend and Flat and Volatility MT5
- Indikatoren
- Pavel Verveyko
- Version: 1.1
- Aktualisiert: 16 Januar 2021
- Aktivierungen: 5
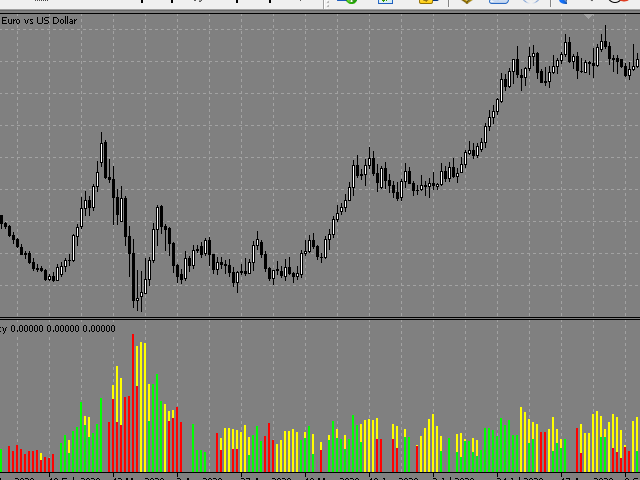
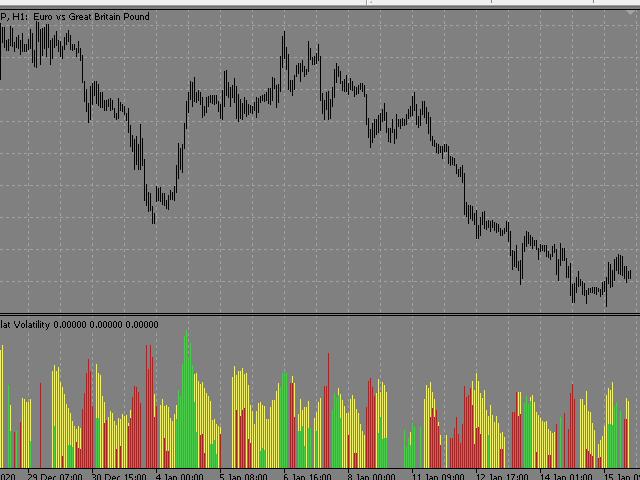
The indicator determines the state of the market: trend or flat.
The state of the market is determined by taking into account volatility.
The flat (trading corridor)is displayed in yellow.
The green color shows the upward trend.
The red color shows the downward trend.
The height of the label corresponds to the volatility in the market.
The indicator does not redraw.
Settings
- History_Size - the amount of history for calculation.
- Period_Candles - the number of candles to calculate the indicator.
- Send_Sound - sound alert.
- Send_Mail - send an email notification.
- Send_Notification - send a mobile notification.
- Send_Alert - standard terminal alert.