Tick Chart MT5
- Utilitys
- Boris Sedov
- Version: 1.0
- Aktivierungen: 5
Tick Chart — full-featured chart for MetaTrader 5.
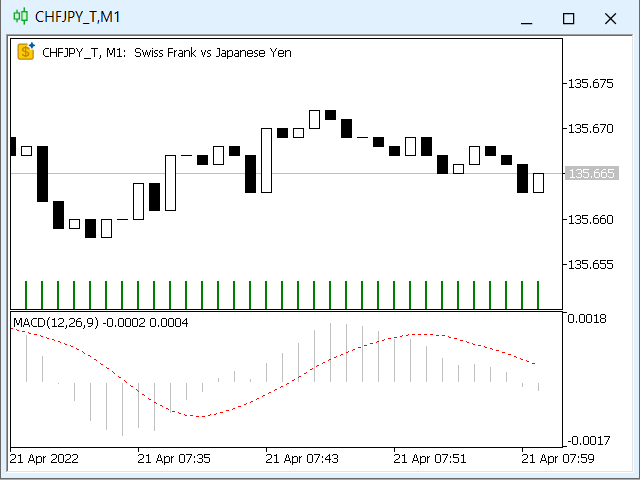
A utility for creating and working with a tick chart in the MetaTrader 5 terminal. You can create a tick chart that works exactly the same as a regular chart. You can apply indicators, Expert Advisors and scripts to the tick chart. You get a fully functional tick chart on which you can work just as well as on a regular chart.
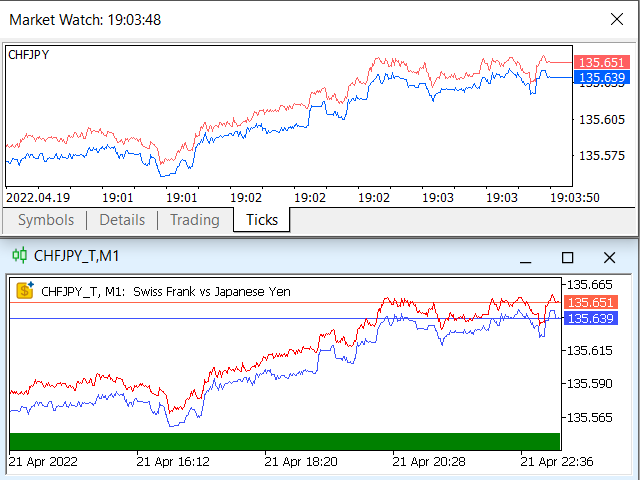
You can enable the output of the Ask price data. The data are generated in the form of the upper shadow of a tick bar. From these data, we can accurately estimate the spread value at any time on a cumulative tick history.
The tick chart is built not only in real time, but also on history, due to the existing tick database. Thus, at any time, you can open a tick chart on which the history has already been accumulated.
At the same time the data is updated synchronously with the basic chart with no delays.
You can open several charts at the same time.
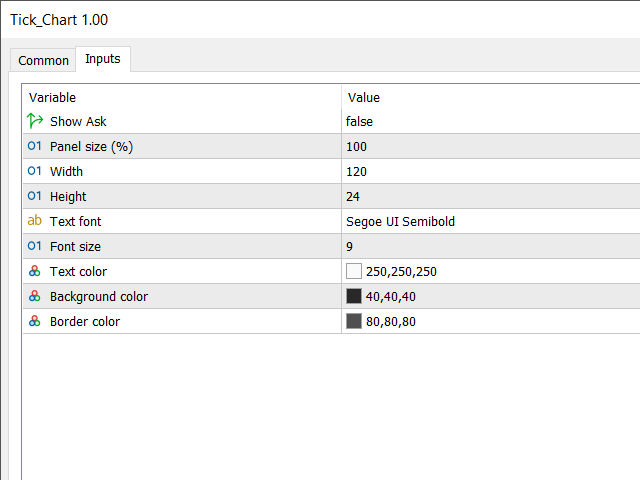
Inputs
- Show Ask — enable the output of the Ask price data.
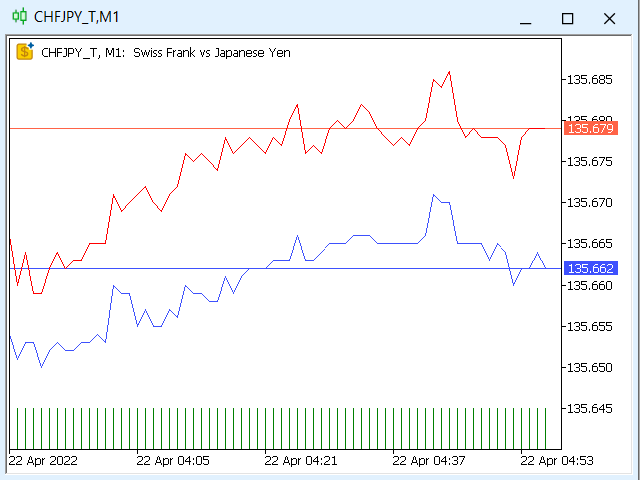
You can enable the display of data on Ask prices, then apply a simple moving average with a period of 1 based on High prices to the tick chart. Thus, you will see the Ask price development line on the tick chart, that is, the entire tick history at Ask prices. - Panel size (%) — you can use the zoom to increase or decrease the size of all buttons.
The default value is 100%, but you can change this value to increase or decrease the size of all buttons. - Graphic settings — this is a group of parameters for configuring graphics.
Launch
- Open the "Navigator" window.
- Find the Tick Chart and drag it to the desired chart (any timeframe).
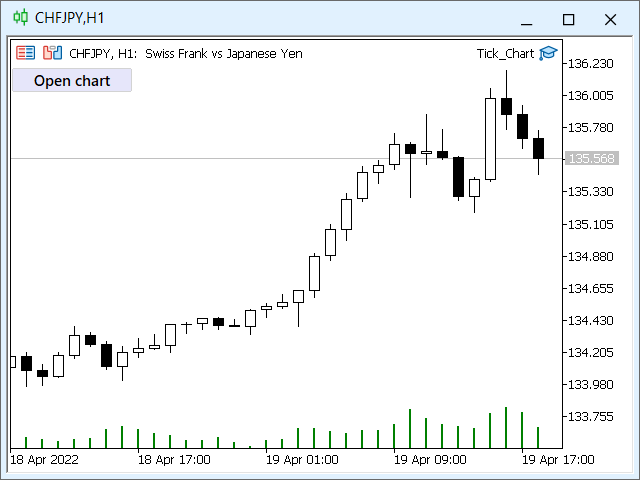
- Open the resulting chart by clicking the corresponding "Open chart" button.