• Übersicht
  • Bewertungen (5)
  • Diskussion (6)

ChannelRSI5

5

ChannelRSI5


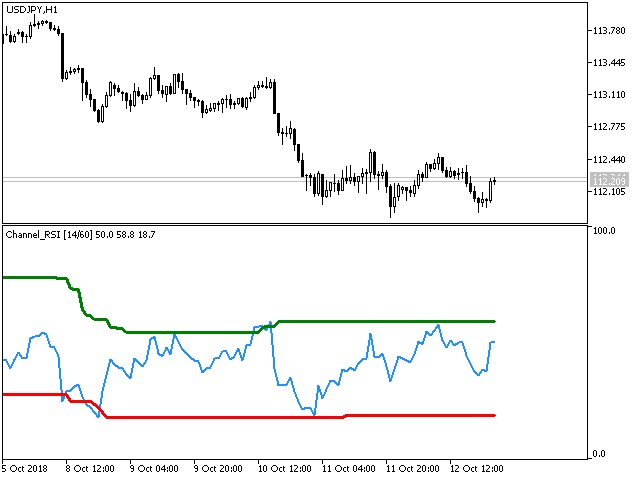
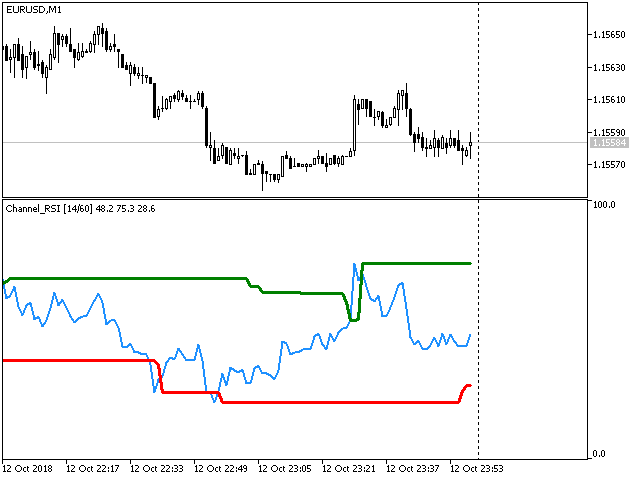
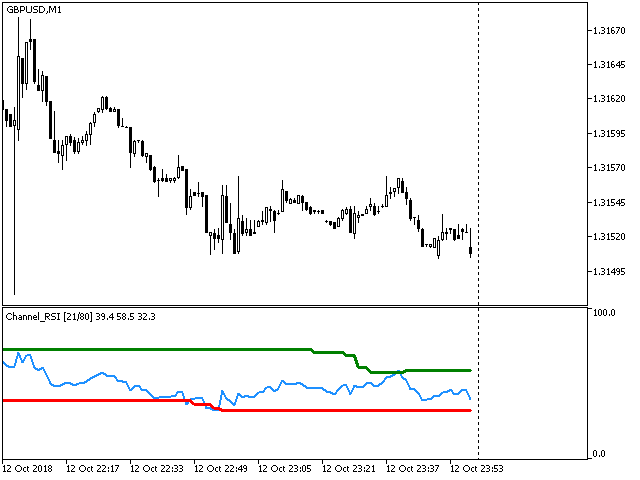
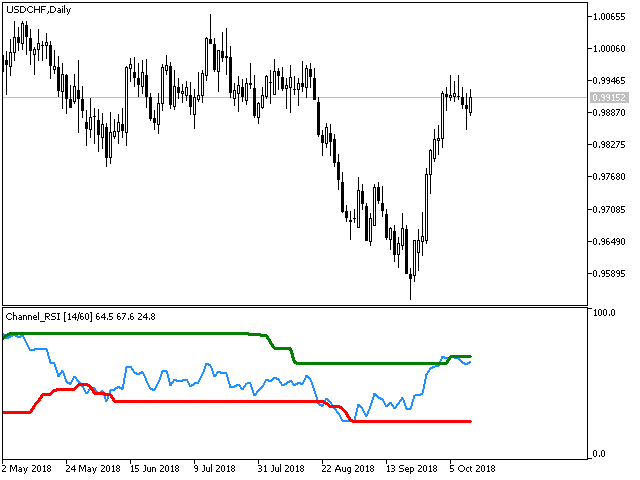
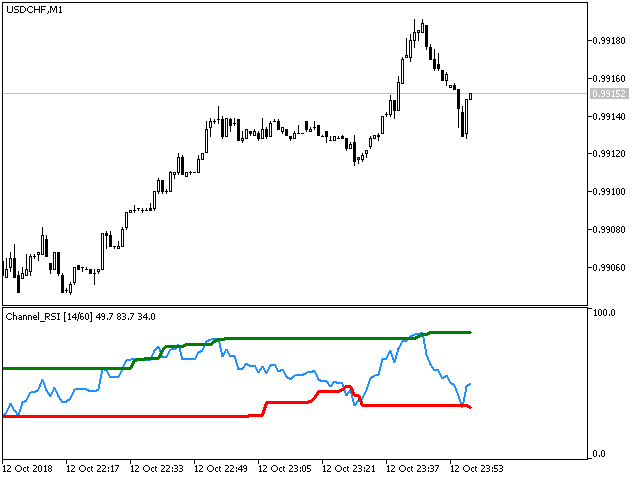
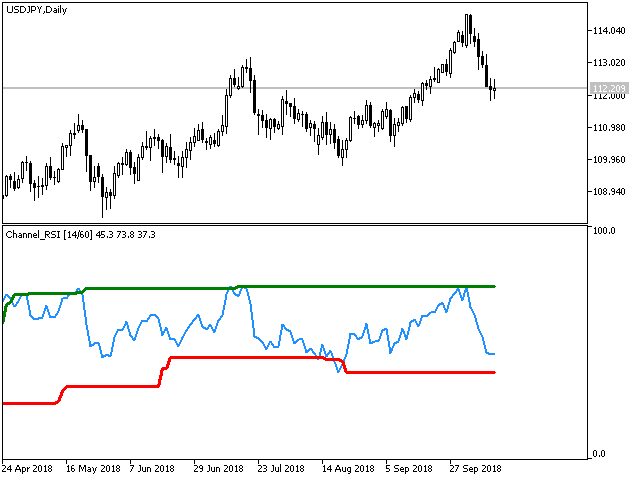
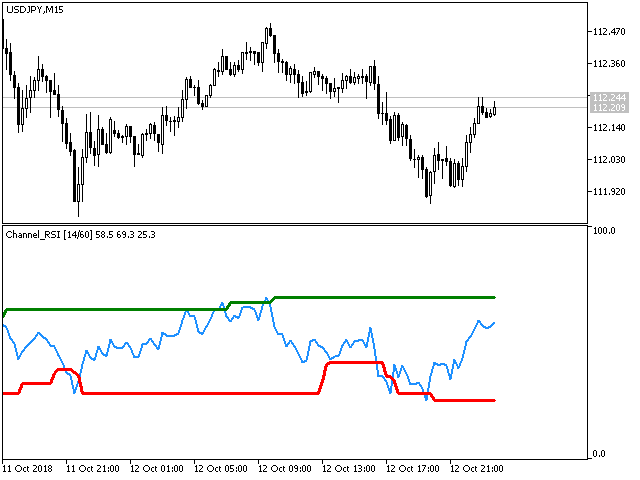
Der Relative Strength Index (RSI) Indikator mit dynamischen Niveaus von überkauften und überverkauften Zonen.
Dynamische Niveaus ändern sich und passen sich den aktuellen Veränderungen des Indikators und der Preise an und stellen eine Art Kanal dar.

Anzeigeeinstellungen

  • period_RSI - Mittelungsperiode für die Berechnung des RSI-Index.
  • angewandt_RSI - Der angewendete Preis. Es kann eine der Preiskonstanten sein: PRICE_CLOSE - Schlusskurs, PRICE_OPEN - Eröffnungspreis, PRICE_HIGH - Höchstpreis für den Zeitraum, PRICE_LOW - Mindestpreis für den Zeitraum, PRICE_MEDIAN - Medianpreis (Hoch + Tief) / 2, PRICE_TYPICAL - Typischer Preis (Hoch + Tief + Schlusskurs) / 3, PRICE_WEIGHTED - Gewichteter Durchschnittspreis (Hoch + Tiefst + Schluss + Schlusskurs) / 4.
  • period_channel - Berechnungszeitraum für den dynamischen Kanal der überkauften und überverkauften Zonen.


Bewertungen 5
Chun Hong Yang
141
Chun Hong Yang 2024.02.21 02:58 
 

Cool indicator, how do I call via EA, please reply to me, thanks

BTV InvestingTrading
48
BTV InvestingTrading 2023.11.28 12:13 
 

Great, thank’s !!!

elkonsis
227
elkonsis 2021.11.28 20:06 
 

Good indicator.

Empfohlene Produkte
FractalEfficiencyIndicator   A ratio between 0 and 1 with the higher values representing a more efficient or trending market,  It is used in the calculation of Perry J. Kaufman Adaptive Moving Average (KAMA), dividing the price change over a period by the absolute sum of the price movements that occurred to achieve that change. The Fractal Efficiency or also known as Efficiency Ratio was first published by Perry J. Kaufman in his book   ‘Smarter Trading‘. This is mostly considered a filter for v
FREE
Big data Triple Average
Cesar Afif rezende Oaquim
This project did not reach the basic funding number, so I am abandoning it momentarily. The system is now free for other traders to continue the idea. You can follow my new project through my signals. A tool for institutional investor, now avaliable for Home users. We equip you like banks equip their analysts! How it works Focused on the Forex market, it takes advantage of the need of nations to control the value of their currency and the world exchange variations to analyze, through the
FREE
An analogue of the Stochastic oscillator based on algorithms of singular spectrum analysis (SSA) SSA is an effective method to handle non-stationary time series with unknown internal structure. It is used for determining the main components (trend, seasonal and wave fluctuations), smoothing and noise reduction. The method allows finding previously unknown series periods and make forecasts on the basis of the detected periodic patterns. Indicator signals are identical to signals of the original i
FREE
SSACD - Singular Spectrum Average Convergence/Divergence This is an analogue of the MACD indicator based on the Caterpillar-SSA ( Singular Spectrum Analysis ) method. Limited version of the SSACD Forecast indicator. Limitations include the set of parameters and their range. Specificity of the method The Caterpillar-SSA is an effective method to handle non-stationary time series with unknown internal structure. The method allows to find the previously unknown periodicities of the series and mak
FREE
KeltnerChannelIndicatorMT5
Todd Terence Bates
3 (2)
The Keltner Channel is a volatility-based technical indicator composed of three separate lines. The middle line is an exponential moving average (EMA) of the price. Additional lines are placed above and below the EMA. The upper band is typically set two times the Average True Range (ATR) above the EMA, and the lower band is typically set two times the ATR below the EMA. The bands expand and contract as volatility (measured by ATR) expands and contracts. Since most price action will be encompasse
FREE
PZ The Zone MT5
PZ TRADING SLU
5 (1)
This indicator displays buy or sell signals according to Bill Williams' definition of the Trading Zone. [ Installation Guide | Update Guide | Troubleshooting | FAQ | All Products ] Easy to use and understand Avoid trading flat markets Deterministic indicator with clear rules The indicator is non-repainting It implements alerts of all kinds It has straightforward trading implications. A blue arrow is a buy signal A red arrow is a sell signal According to Bill Williams trading in the zone helps t
FREE
Donchian Channel DC is the indicator of Donchian Channels, that plots maximum and minimum values of a specific period, besides mean value line. It´s possible to configure simple period for analysis and the indicator will plot all three values. You can trade with this indicator as trend or reversal, according to each strategy. Do not let to test others indicators as soon as others expert advisors.
RSI talking, benutze alle deine Sinne beim Handeln! Die Idee Beim Trading können deine Augen sehr beansprucht werden. Deshalb habe ich RSItalking programmiert, der dir sagt, wenn der RSI in einem Extembereich steht. Handel, was du siehst und was du hörst ! Funktion Dieser Indikator sagt "rsioverbought", wenn der rsi über einem Schwellenwert liegt (Standard 75%) und "rsioversold", wenn er unter einem unteren Grenzwert liegt (Standard 25%). Wenn Sie eine Long-Position halten, empfehlen w
FREE
Renko Chart
Marcin Konieczny
4.27 (11)
This indicator allows to display Renko charts in the indicator window. Renko charts show only price movements that are bigger than the specified box size. It helps to eliminate noise and allows to focus on main trends. Time is not a factor here. Only price movements are taken into account. That's why Renko chart is not synchronized with the main chart it is attached to. Indicator works in two modes: CLOSE - only close prices are taken into account while building the chart HIGH_LOW - only high/
FREE
AdaptiveCCiMt5
Francis Dube
4 (4)
The Commodity Channel Index computes the deviation of the typical price of each bar from the average price over a particular time period. Multiplying the median deviation by 0.015 facilitates normalization, which makes all deviations below the first standard deviation less than  -100, and all deviations above the first standard deviation more than 100. This adaptive version is based on the indicator described by John Ehlers, in the book Rocket Science for traders. The indicator uses the homodyne
FREE
Follow The Line MT5
Oliver Gideon Amofa Appiah
4.42 (31)
This indicator obeys the popular maxim that: "THE TREND IS YOUR FRIEND" It paints a GREEN line for BUY and also paints a RED line for SELL. (you can change the colors). It gives alarms and alerts of all kinds. IT DOES NOT REPAINT and can be used for all currency pairs and timeframes. Yes, as easy and simple as that. Even a newbie can use it to make great and reliable trades. NB: For best results, get my other premium indicators for more powerful and reliable signals. Get them here: https://www.m
FREE
Custom Panel
Marcin Konieczny
4.67 (6)
Custom Panel allows you to gather all kind of important information and display it as one handy table in the upper right corner of the chart. You can choose the contents of the panel yourself. Every row will show your own customized condition or value. Every column shows a different timeframe. The panel may contain up to 10 rows and up to 8 columns. Sample usage Row : Price > EMA(30) Mode : YES_NO Meaning : is current price above EMA(30) Row : Ask < Bands[L] Mode : YES_NO Meaning : is cur
FREE
Ribbon Trend for MT5
Sutthichai Mungdee
4.8 (5)
This indicator is a simple tool to spot a possible trend. When the ribbon below the price bars, It will turn to Green color and the trend is seen to be bullish When the   ribbon above the price bars, it will turn to Red color and the trend is seen to be bearish. It can be used a either Entry Signal Exit Signal or trailing stop, so it is very versatile. By default color : Green is UP trend and Red is Down trend and this work perfect with   Bar4Colors.ex5
FREE
Indicador Regressão Linear – Par de Ativos - INTRADAY Indicador é um oscilador que faz o plot do Resíduo resultado da regressão linear entre os dois ativos inseridos como input do indicador, representado pela fórmula: Y = aX + b + R Onde Y é o valor do ativo dependente, X é o valor do ativo independente, a é a inclinação da reta entre os dois ativos, b é a intersecção da reta e R é o resíduo. O resíduo representa a quantidade da variabilidade que Y que o modelo ajustado não consegue explicar. E
FREE
Introduction This indicator detects volume spread patterns for buy and sell opportunity. The patterns include demand and supply patterns. You might use each pattern for trading. However, these patterns are best used to detect the demand zone (=accumulation area) and supply zone (=distribution area). Demand pattern indicates generally potential buying opportunity. Supply pattern indicates generally potential selling opportunity. These are the underlying patterns rather than direct price action. T
FREE
Ema Cross Alert V1
Paul Conrad Carlson
Alert Indicator for exponential moving average cross blue arrow for buy alert , fast ema 14 crosses above 50 pink arrow for sell alert , fast ema 14 crosses below 50 Default 14 ema fast & 50 ema slow add these indicators to chart Full Alerts , push, email, phone  inputs for moving average lengths and alarm on off settings Please contact for help of an indicator alert suggestion 
FREE
HighLow MT5
Azamat Mullayanov
4.2 (5)
The indicator plots two lines by High and Low prices. The lines comply with certain criteria. The blue line is for buy. The red one is for sell. The entry signal - the bar opens above\below the lines. The indicator works on all currency pairs and time frames It can be used either as a ready-made trading system or as an additional signal for a custom trading strategy. There are no input parameters. Like with any signal indicator, it is very difficult to use the product during flat movements. You
FREE
The indicator identifies when a divergence occurs between price and an indicator or oscillator. It identifies both regular and hidden divergences. Combined with your own rules and techniques, this indicator will allow you to create (or enhance) your own powerful system. Features Can detect divergences for the following oscillators/indicators:   MACD, OsMA, Stochastics, RSI, CCI, RVI, Awesome, ADX, ATR, OBV, Composite index, MFI and Momentum. Only one oscillator/indicator can be selected. Draws
FREE
Mitimom
Danil Poletavkin
The indicator is based on Robert Miner's methodology described in his book "High probability trading strategies" and displays signals along with momentum of 2 timeframes. A Stochastic oscillator is used as a momentum indicator. The settings speak for themselves period_1 is the current timeframe, 'current' period_2 is indicated - the senior timeframe is 4 or 5 times larger than the current one. For example, if the current one is 5 minutes, then the older one will be 20 minutes The rest of the
FREE
RSI magic kjuta trial is the demo version of RSI magic kjuta. Custom Indicator (RSI magic kjuta) based on the standard   (Relative Strength Index, RSI) with additional settings and functions. The maximum and minimum RSI lines on the chart have been added to the standard RSI line. Now you can visually observe the past highs and lows of RSI, and not only the values of the closing bars, which avoids confusion in the analysis of trades. For example, the EA opened or closed an order, but the RSI l
FREE
A professional tool for trading - the divergence indicator between the RSI and the price, which allows you to receive a signal about a trend reversal in a timely manner or catch price pullback movements (depending on the settings). The indicator settings allow you to adjust the strength of the divergence due to the angle of the RSI peaks and the percentage change in price, which makes it possible to fine-tune the signal strength. The indicator code is optimized and is tested very quickly as par
FREE
ToolBot Probabilistic Analysis
Josue De Matos Silva
4.33 (3)
ToolBot   Probabilistic Analysis -  FREE   An effective indicator for your negotiations The toolbot indicator brings the calculation of candles and a probabilistic analysis so that you have more security on your own. Also test our   FREE   tops and bottoms indicator: :    https://www.mql5.com/pt/market/product/52385#description Also test our   FREE   (RSI, ATR, ADX, OBV)  indicator :    https://www.mql5.com/pt/market/product/53448#description Try our EA ToolBot for free:   https://www.mql
FREE
Tick Speed Free MT5
John Louis Fernando Diamante
Tick Speed Free povides a on-chart label of tick speed to allow you to see the ebb and flow of market activity. Observing rises and falls in tick speed may allow you to better time entries to reduce slippage and re-quotes. Options include: - colores for low-mid-high tick speeds - placement and styling - prefix & suffix to customise the speed label Troubleshooting: - Note, in the tester environment, tick timings are limited to what is supplied by the tester environment and it's speed - If
FREE
The indicator draws a normal chart by coloring it in colors based on prices calculated by the Heiken Ashi indicator algorithm. That is, the shape of the candles does not change. In fact, this is the same Heiken Ashi that does not distort the price chart. Then there will be a drawing of a cat, because there is nothing more to write about the indicator. .                                                       
FREE
Indicador Volatilidade Histórica Indicador é um oscilador que faz o plot da volatilidade histórica de um ativo, representado pelas fórmulas: Volatilidade Histórica = Raiz quadrada da média das diferenças ao quadrado * Fator de anualização. Média das diferenças ao quadrado = soma de todas as diferenças de retorno diário / número total das diferenças. Retorno diário = (preço atual - preço anterior) / preço anterior. Nesse indicador estamos utilizando os preços de fechamento de cada barra e fazemos
FREE
True Volatility
Cristian Eriksson
5 (1)
ATR is an excellent indicator to visualize if volatility is increasing or decreasing. But what if you want to compare the volatility to another pair or instrument? Since each pair with different quote currency has different pip value, the output of the ATR doesn't really say that much. Comparing pairs to other instruments is even harder.  What you as a trader care about is how much the pair has moved up or down in percentage, therefore normalizing ATR to percent would make things much easier.  T
FREE
We have all seen a currency pair enter the overbought or oversold territory and stay there for long periods of time. What this indicator does is gives you the emphasis. So if you are looking for reversals then you may want to take notice when oversold territory is entered into with a bullish engulfing candle or if the trend is your thing then check for bearish engulfing candles while entering oversold. This indicator will show a downward arrow when it detects a bearish engulfing candle while cro
FREE
MACalcAuto MT5
Tatiana Savkevych
As you know, the main invariable indicator of all traders is the moving average; it is used in some way in most strategies. It is also obvious that this indicator is capable of showing good entries in every local area. For which it usually needs to be optimized or just visually adjusted. This development is intended for automatic optimization of the indicator. Once placed on the chart, the indicator will automatically re-optimize itself with the specified period ( PeriodReOptimization ) and dis
SSA Trend Predictor
Roman Korotchenko
4.25 (4)
This indicator extracts a trend from a price series and forecasts its further development. Algorithm is based on modern technique of Singular Spectral Analysis ( SSA ). SSA is used for extracting the main components (trend, seasonal and wave fluctuations), smoothing and eliminating noise. It does not require the series to be stationary, as well as the information on presence of periodic components and their periods. It can be applied both for trend and for another indicators. Features of the m
FREE
HMA Color with Alerts MT5
Pavel Zamoshnikov
4.72 (50)
Hull Moving Average (HMA) is well-deservedly popular among traders because of the effective averaging of market noise and a relatively small delay. The current MetaTrader 5 version changes its color when the movement direction changes. Sound and text signals are available. It also supports sending email and push messages. It is possible to trigger a signal on the current incomplete bar, although such a signal may be canceled before completion if conditions are no longer appropriate. One of the p
FREE
Käufer dieses Produkts erwarben auch
Atomic Analyst MT5
Issam Kassas
3.64 (11)
Zunächst einmal ist es erwähnenswert, dass dieser Handelsindikator nicht neu malt, nicht neu zeichnet und keine Verzögerung aufweist, was ihn sowohl für manuellen als auch für Roboterhandel ideal macht. Der Atom-Analyst ist ein PA-Preisaktionsindikator, der die Stärke und das Momentum des Preises nutzt, um einen besseren Vorteil auf dem Markt zu finden. Ausgestattet mit fortschrittlichen Filtern, die helfen, Rauschen und falsche Signale zu entfernen, und das Handelspotenzial zu erhöhen. Durch
Zunächst einmal ist es wichtig zu betonen, dass dieses Handelssystem ein Nicht-Repainting-, Nicht-Redrawing- und Nicht-Verzögerungsindikator ist, was es sowohl für manuelles als auch für automatisches Trading ideal macht. Das "Smart Trend Trading System MT5" ist eine umfassende Handelslösung, die für neue und erfahrene Trader maßgeschneidert ist. Es kombiniert über 10 Premium-Indikatoren und bietet mehr als 7 robuste Handelsstrategien, was es zu einer vielseitigen Wahl für verschiedene Marktbe
Quantum Trend Sniper
Bogdan Ion Puscasu
5 (37)
Wir stellen vor       Quantum Trend Sniper Indicator   , der bahnbrechende MQL5-Indikator, der die Art und Weise, wie Sie Trendumkehrungen erkennen und handeln, verändert! Entwickelt von einem Team erfahrener Händler mit über 13 Jahren Handelserfahrung,       Quantum Trend Sniper-Indikator       wurde entwickelt, um Ihre Trading-Reise mit seiner innovativen Methode zur Identifizierung von Trendumkehrungen mit extrem hoher Genauigkeit auf ein neues Niveau zu heben. ***Kaufe Quantum Trend Snipe
Trend Screener Pro MT5
STE S.S.COMPANY
4.89 (61)
Nutzen Sie die Macht des Trendhandels mit Trend Screener Indicator: Ihrer ultimativen Trendhandelslösung, die auf Fuzzy-Logik und einem System mit mehreren Währungen basiert! Steigern Sie Ihren Trendhandel mit Trend Screener, dem revolutionären Trendindikator mit Fuzzy-Logik. Es handelt sich um einen leistungsstarken Trendfolgeindikator, der über 13 Premium-Tools und -Funktionen sowie 3 Handelsstrategien kombiniert und ihn zu einer vielseitigen Wahl macht, um Ihren Metatrader in einen Trendanaly
Gold Stuff mt5
Vasiliy Strukov
4.88 (164)
Gold Stuff mt5-Ein Trendindikator, der speziell für Gold entwickelt wurde, kann auch auf allen Finanzinstrumenten verwendet werden. Der Indikator wird nicht neu gezeichnet und verzögert sich nicht. Empfohlener Zeitrahmen H1. WICHTIG! Kontaktieren Sie mich sofort nach dem Kauf, um Anweisungen und Bonus zu erhalten! DATEN Draw Arrow - inkl.aus. zeichnen von Pfeilen in einem Diagramm. Alerts-inkl.aus.akustische Warnungen. E - mail notification-inkl.aus. benachrichtigungen per E-Mail. Puch-
FX Volume MT5
Daniel Stein
4.94 (17)
Erhalten Sie Ihr tägliches Marktupdate mit Details und Screenshots über unser Morning Briefing hier auf mql5 und auf Telegram ! FX Volume ist der ERSTE und EINZIGE Volumenindikator, der einen ECHTEN Einblick in die Marktstimmung aus Sicht eines Brokers bietet. Es bietet fantastische Einblicke in die Positionierung von institutionellen Marktteilnehmern, wie z.B. Brokern, auf dem Forex-Markt, viel schneller als COT-Berichte. Diese Informationen direkt auf Ihrem Chart zu sehen, ist der wahre Game
FX Power MT5 NG
Daniel Stein
5 (4)
Erhalten Sie Ihr tägliches Marktupdate mit Details und Screenshots über unser Morning Briefing hier auf mql5 und auf Telegram ! FX Power MT5 NG ist die nächste Generation unseres langjährig sehr beliebten Währungsstärkemessers FX Power. Und was bietet dieser Stärkezähler der nächsten Generation? Alles, was Sie am ursprünglichen FX Power geliebt haben PLUS GOLD/XAU-Stärkeanalyse Noch präzisere Berechnungsergebnisse Individuell konfigurierbare Analysezeiträume Anpassbares Berechnungslimit für noc
Zunächst einmal ist es wichtig zu betonen, dass dieses Handelstool ein Nicht-Repaint-, Nicht-Redraw- und Nicht-Verzögerungsindikator ist, was es ideal für professionelles Trading macht. Der Smart Price Action Concepts Indikator ist ein sehr leistungsstarkes Werkzeug sowohl für neue als auch erfahrene Händler. Er vereint mehr als 20 nützliche Indikatoren in einem und kombiniert fortgeschrittene Handelsideen wie die Analyse des Inner Circle Traders und Strategien des Smart Money Concepts. Diese
Advanced Supply Demand MT5
Bernhard Schweigert
4.53 (15)
Derzeit 33% Rabatt! Die beste Lösung für jeden Anfänger oder erfahrenen Händler! Dieser Indikator ist ein einzigartiges, qualitativ hochwertiges und erschwingliches Trading-Tool, da wir eine Reihe von proprietären Funktionen und eine neue Formel integriert haben. Mit diesem Update werden Sie in der Lage sein, doppelte Zeitrahmenzonen anzuzeigen. Sie können nicht nur einen höheren TF (Zeitrahmen) anzeigen, sondern sowohl den Chart-TF als auch den höheren TF: SHOWING NESTED ZONES. Alle Supply Dema
RelicusRoad Pro MT5
Relicus LLC
4.81 (21)
Jetzt 147 US -Dollar (nach ein paar Aktualisierungen auf 499 US -Dollar) - Unbegrenzte Konten (PCs oder MACs) RelicusRoad Benutzerhandbuch + Schulungsvideos + Zugang zur privaten Discord-Gruppe + VIP-Status EINE NEUE ART, DEN MARKT ZU BETRACHTEN RelicusRoad ist der weltweit leistungsstärkste Handelsindikator für Forex, Futures, Kryptowährungen, Aktien und Indizes und gibt Händlern alle Informationen und Tools, die sie benötigen, um profitabel zu bleiben. Wir bieten technische Analysen un
XQ Indicator MetaTrader 5
Marzena Maria Szmit
5 (1)
Step into the realm of Forex trading with confidence and precision using XQ, a cutting-edge Forex indicator designed to elevate your trading game to unprecedented heights. Whether you're a seasoned trader or just stepping into the world of currency exchange, XQ Forex Indicator empowers you with the insights and signals needed to make informed trading decisions. The signal conditions are a combination of three indicators, and XQ Forex Indicator only display  medium and long-term trends . The ind
The Volume by Price Indicator for MetaTrader 5 features Volume Profile and Market Profile TPO (Time Price Opportunity). Get valuable insights out of currencies, equities and commodities data. Gain an edge trading financial markets. Volume and TPO histogram bar and line charts. Volume Footprint charts. TPO letter and block marker charts including split structures. Versatile segmentation and compositing methods. Static, dynamic and flexible ranges with relative and/or absolute visualizations. Lay
Wir stellen vor       Quantum Breakout PRO   , der bahnbrechende MQL5-Indikator, der die Art und Weise, wie Sie mit Breakout-Zonen handeln, verändert! Entwickelt von einem Team erfahrener Händler mit über 13 Jahren Handelserfahrung,       Quantum Breakout PRO       ist darauf ausgelegt, Ihre Handelsreise mit seiner innovativen und dynamischen Breakout-Zone-Strategie auf ein neues Niveau zu heben. Der Quantum Breakout Indicator zeigt Ihnen Signalpfeile auf Breakout-Zonen mit 5 Gewinnzielzone
Dies ist ein Indikator für MT5, der genaue Signale für den Einstieg in einen Handel ohne Repainting (Neuzeichnen) liefert. Er kann auf alle Finanzwerte angewendet werden: Forex, Kryptowährungen, Metalle, Aktien, Indizes. Er liefert ziemlich genaue Schätzungen und sagt Ihnen, wann es am besten ist, eine Position zu eröffnen und zu schließen. Sehen Sie sich das Video (6:22) mit einem Beispiel für die Verarbeitung nur eines Signals an, das sich für den Indikator gelohnt hat! Die meisten Händler ver
ICT, SMC, SMART MONEY CONCEPTS, SMART MONEY, Smart Money Concept, Support and Resistance, Trend Analysis, Price Action, Market Structure, Order Blocks, BOS/CHoCH,   Breaker Blocks ,  Momentum Shift,   Supply&Demand Zone/Order Blocks , Strong Imbalance,   HH/LL/HL/LH,    Fair Value Gap, FVG,  Premium  &   Discount   Zones, Fibonacci Retracement, OTE, Buy Side Liquidity, Sell Side Liquidity, BSL/SSL Taken, Equal Highs & Lows, MTF Dashboard, Multiple Time Frame, BigBar, HTF OB, HTF Market Structure
AW Trend Predictor MT5
AW Trading Software Limited
4.76 (54)
Die Kombination von Trend- und Aufschlüsselungsebenen in einem System. Ein fortschrittlicher Indikatoralgorithmus filtert Marktrauschen, bestimmt den Trend, Einstiegspunkte sowie mögliche Ausstiegsniveaus. Indikatorsignale werden in einem Statistikmodul aufgezeichnet, das es Ihnen ermöglicht, die am besten geeigneten Tools auszuwählen, die die Wirksamkeit der Signalhistorie zeigen. Der Indikator berechnet Take-Profit- und Stop-Loss-Marken. Handbuch und Anleitung ->   HIER   / MT4-Version ->   H
Auto Order Block with break of structure based on ICT and Smart Money Concepts Futures Break of Structure ( BoS )             Order block ( OB )            Higher time frame Order block / Point of Interest ( POI )    shown on current chart           Fair value Gap ( FVG ) / Imbalance   ,  MTF      ( Multi Time Frame )    Volume Imbalance     ,  MTF          vIMB Gap’s Equal High / Low’s     ,  MTF             EQH / EQL Liquidity               Current Day High / Low           HOD /
Blahtech Supply Demand MT5
Blahtech Limited
4.57 (14)
Was: $299  Now: $99   Supply Demand uses previous price action to identify potential imbalances between buyers and sellers. The key is to identify the better odds zones, not just the untouched ones. Blahtech Supply Demand indicator delivers functionality previously unavailable on any trading platform. This 4-in-1 indicator not only highlights the higher probability zones using a multi-criteria strength engine, but also combines it with multi-timeframe trend analysis, previously confirmed swings
Der Gann Square Indikator ist ein leistungsstolles Marktanalyse-Tool, das auf dem Artikel "Mathematische Formel für Marktvorhersagen" von W.D. Gann basiert. Dieses Tool verwendet mathematische Konzepte und Gann-Theorien für eine präzise Marktanalyse. Es beinhaltet Quadratwerte von 144, 90, 52 und auch das Quadrat von 9. Darüber hinaus integriert es die Methode von  zur Quadratwurzel von 9 und deren Beziehung zu Kanälen und dem Sternmuster. Benutzerhandbuch und Anwendung: Vor der Verwendung diese
TrendMaestro5
Stefano Frisetti
note: this indicator is for METATRADER4, if you want the version for METATRADER5 this is the link:  https://www.mql5.com/it/market/product/108106 TRENDMAESTRO recognizes a new TREND in the bud, he never makes mistakes. The certainty of identifying a new TREND is priceless. DESCRIPTION TRENDMAESTRO identifies a new TREND in the bud, this indicator examines the volatility, volumes and momentum to identify the moment in which there is an explosion of one or more of these data and therefore the mome
Werden Sie Breaker Trader und profitieren Sie von Änderungen der Marktstruktur, wenn sich der Preis umkehrt. Der Order Block Breaker Indikator zeigt an, wann sich eine Trend- oder Preisbewegung der Erschöpfung nähert und bereit ist, sich umzukehren. Es weist Sie auf Änderungen in der Marktstruktur hin, die normalerweise auftreten, wenn eine Umkehrung oder ein größerer Rückzug bevorsteht. Der Indikator verwendet eine proprietäre Berechnung, die Ausbrüche und Preisdynamik identifiziert. Jedes
Trend Line Map Pro MT5
STE S.S.COMPANY
4.67 (9)
Trend Line Map Indicator ist ein Add-On für Trend Screener Indicator. Es arbeitet als Scanner für alle Signale, die vom Trendscreener (Trendliniensignale) erzeugt werden. Es ist ein Trend Line Scanner basierend auf dem Trend Screener Indicator. Wenn Sie keinen Trend Screener Pro Indicator haben, funktioniert die Trend Line Map Pro nicht. It's a Trend Line Scanner based on Trend Screener Indicator. If you don't have Trend Screener Pro Indicator,     the Trend Line Map Pro will not work .
TrendLine PRO MT5
Evgenii Aksenov
4.78 (49)
The Trend Line PRO indicator is an independent trading strategy. It shows the trend change, the entry point to the transaction, as well as automatically calculates three levels of Take Profit and Stop Loss protection Trend Line PRO is perfect for all Meta Trader symbols: currencies, metals, cryptocurrencies, stocks and indices Advantages of Trend Line PRO Never redraws its signals The possibility of using it as an independent strategy It has three automatic levels Take Profit and Stop Loss lev
Owl Smart Levels MT5
Sergey Ermolov
4.47 (36)
MT4-Version  |  FAQ Der Owl Smart Levels Indikator ist ein komplettes Handelssystem innerhalb eines Indikators, der so beliebte Marktanalysetools wie die fortschrittlichen Fraktale von Bill Williams , Valable ZigZag, das die richtige Wellenstruktur des Marktes aufbaut, und Fibonacci-Levels , die die genauen Einstiegslevels markieren, enthält in den Markt und Orte, um Gewinne mitzunehmen. Detaillierte Strategiebeschreibung Anleitung zur Verwendung des Indikators Berater-Assistent im Handel Owl H
TPSpro TRENDPRO  - is a trend indicator that automatically analyzes the market and provides information about the trend and each of its changes, as well as giving signals for entering trades without redrawing! The indicator uses each candle, analyzing them separately. referring to different impulses - up or down impulse. Exact entry points into transactions for currencies, crypto, metals, stocks, indices!  -  Version MT4                  DETAILED DESCRIPTION        /       TRADING SETUPS       
Gartley Hunter Multi
Siarhei Vashchylka
5 (5)
Gartley Hunter Multi - An indicator for searching for harmonic patterns simultaneously on dozens of trading instruments and on all classic timeframes: (m1, m5, m15, m30, H1, H4, D1, Wk, Mn). Manual (Be sure to read before purchasing) | Version for MT4 Advantages 1. Patterns: Gartley, Butterfly, Shark, Crab. Bat, Alternate Bat, Deep Crab, Cypher 2. Simultaneous search for patterns on dozens of trading instruments and on all classic timeframes 3. Search for patterns of all possible sizes. Fr
Was: $249  Now: $99   Market Profile defines a number of day types that can help the trader to determine market behaviour. A key feature is the Value Area, representing the range of price action where 70% of trading took place. Understanding the Value Area can give traders valuable insight into market direction and establish the higher odds trade. It is an excellent addition to any system you may be using. Inspired by Jim Dalton’s book “Mind Over Markets”, this indicator is designed to suit the
Black Dragon indicator mt5
Ramil Minniakhmetov
4.82 (56)
Der Trenderkennungsindikator ergänzt jede Strategie und kann auch als unabhängiges Werkzeug verwendet werden. Vorteile Einfach zu bedienen, überfrachtet das Diagramm nicht mit unnötigen Informationen; Kann als Filter für jede Strategie verwendet werden; Verfügt über eingebaute dynamische Unterstützungs- und Widerstandsebenen, die sowohl zur Gewinnmitnahme als auch zum Setzen von Stop-Loss verwendet werden können; Der Indikator ändert seine Farbe nicht, nachdem die Kerze geschlossen wurde;
Golden Spikes Detector
Batsirayi L Marango
5 (1)
Golden Spikes Detector This indicator is based on an advanced strategy primarily for trading spikes on Boom and Crash Indices. Complex algorithms were implemented to detect high probability entries only. It alerts on potential Buy and Sell entries. To trade spikes on the Deriv or Binary broker, only take Buy Boom and Sell Cash alerts. It was optimised to be loaded on 5-minute timeframe although multiple timeframe analysis is done in the background. Features ·             Desktop pop up and sound
Matrix Arrow Indicator MT5
Juvenille Emperor Limited
5 (14)
Matrix Arrow Indicator MT5   ist ein einzigartiger 10-in-1-Trend, der zu   100 % nicht neu gezeichnet   werden kann. Multi-Timeframe-Indikator, der für alle Symbole/Instrumente verwendet werden kann:   Forex ,   Rohstoffe ,   Kryptowährungen ,   Indizes ,   Aktien .  Der  Matrix Arrow Indicator MT5  wird den aktuellen Trend in seinen frühen Stadien bestimmen und Informationen und Daten von bis zu 10 Standardindikatoren sammeln, die sind: Durchschnittlicher Richtungsbewegungsindex (ADX) Rohstoff
Weitere Produkte dieses Autors
Line Profit
Iurii Tokman
5 (4)
Line Profit   Indikator der visuellen Gewinnlinie in der Einzahlungswährung. Funktioniert nur, wenn auf dem Markt offene Positionen für das Symbol vorhanden sind, auf dem der Indikator installiert ist. Sie können die Linie mit der Maus verschieben oder die automatische Verfolgung des Gebotspreises aktivieren. Beschreibung der Anzeigeeinstellungen: colotLine - Linienfarbe WidthLine - Linienbreite colotText - Textfarbe FontSize - die Höhe des Textes Anker - eine Ankermethode für Text FollowBid - F
FREE
StopLevel
Iurii Tokman
5 (2)
StopLevel   Die Anzeige steuert den STOPLEVEL-Pegel. Wenn sich der Pegel ändert, wird dies mit einem Alarm signalisiert. STOPLEVEL - der   minimale Offset in Punkten vom aktuellen Schlusskurs für die Platzierung von Stop-Orders oder der minimal zulässige Stop-Loss / Take-Profit-Level in Punkten. Ein Nullwert von STOPLEVEL bedeutet entweder das Fehlen einer Beschränkung des Mindestabstands für Stop Loss / Take Profit oder die Tatsache, dass der Handelsserver externe Mechanismen zur dynamischen Le
FREE
Smart YTG
Iurii Tokman
4.67 (6)
Smart YTG   Die Version des Advisors für das MT5-Terminal.   |   Alle Produkte Smart YTG wurde   geschrieben, um am GBPUSD-Währungspaar, Chartperiode H1, zu arbeiten. Im Wesentlichen ist das System ein Trend und funktioniert perfekt auf Trendabschnitte der Preisbewegung mit STOP-Orders, der Trend wird durch die Analyse des   im Inneren des Expert Advisors integrierten Price Channel   Indikators bestimmt; es ist keine zusätzliche Installation des Indikators erforderlich. In den flachen Bereichen,
Robo T
Iurii Tokman
Robo T   Robo T Expert Advisor ist ein Handelssystem ohne Indikatoren. Beschreibung der Advisor-Einstellungen: Level_ord   - Abstand vom aktuellen Preis für die Platzierung von beginnenden schwebenden Buy Stop- und Sell Stop-Orders, standardmäßig 22. Lot_1   - Anfangslos für eine Reihe von Käufen, standardmäßig 0.1. Lot_2   - Anfangslos für eine Verkaufsserie, standardmäßig 0.1. TakeProfit   - Gewinnniveau, standardmäßig 30. TSProfitOnly   - Schleppnetz nur Gewinn. Wenn deaktiviert, tritt Traili
Firm
Iurii Tokman
Firm   Der EA verwendet keine Indikatoren, er ist ständig auf dem Markt. Die Logik des Beraters basiert auf der Analyse bereits offener Orders im Markt. Beschreibung der Advisor-Einstellungen: StopLoss_Percent - Verlusthöhe in Prozent TakeProfit - Gewinnniveau in Punkten Risiko - Einstellung zur automatischen Ermittlung des Ordervolumens des EA, funktioniert bei LOT = 0 LOT - festes Auftragsvolumen Slippage - die maximal zulässige Preisrutsche MagicNumber - die magische Zahl der Bestellungen des
Bar Boss
Iurii Tokman
5 (1)
Bar Boss   Der Expert   Advisor verwendet den FletBoxPush-Indikator, um den Markt zu analysieren und Handelssignale zu bestimmen. Der Indikator ist in den Expert Advisor integriert und seine zusätzliche Installation auf dem Chart ist nicht erforderlich. Der Handel findet beim Ausbruch der Levels statt, die als die Grenzen der Flat definiert sind. Es wird eine Verlustbegrenzung verwendet. Beschreibung der Beratereinstellungen TimeFrames - Chartperiode, Einstellung für den Indikator color - die
Adaptive MA   Gleitender Durchschnitt. Die Berechnungsmethode ist der Durchschnitt aller in der Balkendefinition verwendeten Preise. Beschreibung der externen Einstellungen des Indikators: MA_period   - Mittelungsperiode für die Berechnung des Indikators. Empfohlene Werte: 5, 13, 21, 34. ma_method   - Mittelungsmethode. Kann ein beliebiger Wert der Methode des gleitenden Durchschnitts sein. 0 - (SMA) Einfacher gleitender Durchschnitt. 1 - (EMA) Exponentieller gleitender Durchschnitt. SMMA 2 -
MovingInWL
Iurii Tokman
MovingInWL   Der Expert Advisor wurde entwickelt, um den Stop von offenen Positionen verlustfrei zu verschieben, wenn sie ein bestimmtes, vorher festgelegtes Gewinnniveau erreichen. Beschreibung der Advisor-Einstellungen: MagicNumber - Bestellkennung LevelProfit - Das Gewinnniveau in Punkten, das die Position erreichen muss, damit ihr Stop ohne Verlust auf das Niveau bewegt wird. LevelWLoss - Das Level ohne Punktverlust, auf das die Stop-Position übertragen wird, nachdem sein Gewinn das   LevelP
FREE
Shadow Height mt5   Schattenanzeige. Zeigt die Größe der Kerzenschatten in Punkten als Histogramm an. Funktioniert in zwei Modi, vom Benutzer wählbar. Beschreibung der Anzeigeeinstellungen Modus - Betriebsmodi des Indikators, zwei Modi: erste Höhe - Anzeigemodus für obere und untere Kerzenschatten; der zweite Unterschied ist der Modus der Anzeige des Unterschieds in den Kerzenschatten, der Unterschied zwischen den oberen und unteren Kerzenschatten.
FREE
Comb
Iurii Tokman
3.5 (2)
Comb   Der Indikator zeigt ein Wabengitter oder ein regelmäßiges Sechseck an. Alternative zum Standard-Handelsterminalraster. Beschreibung der Anzeigeeinstellungen: color_comb - Gitterfarbe Breite - Breite, Beispiel: 22 für einen Bildschirm mit einer Auflösung von 1920 * 1080, 15 für einen Bildschirm mit einer Auflösung von 1366 * 768 usw. Höhe - Höhe, zum Beispiel: 6 für einen Bildschirm mit einer Auflösung von 1920 * 1080, 4 für einen Bildschirm mit einer Auflösung von 1366 * 768 usw.
FREE
Hammering
Iurii Tokman
Hammering   Hammering   ist ein automatisiertes Handelssystem, das für jedes Währungspaar entwickelt wurde. Beim Handel werden Mehrwährungs- und Monowährungsmodi verwendet. Um Handelsentscheidungen zu treffen, verwendet der EA Signale des   Slope Direction Line-   Indikators. Beschreibung der Einstellungen. Profit_Percent_AccountEquity = 0,4; - die Höhe des Gewinns in Prozent der verfügbaren Mittel Fix_AccountEquity = 0; - obligatorische Höhe der freien Mittel FIX_PROFIT = 1000; - erzwungenes Ge
Robo Grid FX   ROBO GRID FX   ist ein Grid Expert Advisor. Entwickelt für den Intraday-Handel auf einem aktiven Markt und schnelle Währungspaare. Es ist ein Netzberater mit einem geschlossenen Mittelungssystem. Das Closed-Loop-Averaging-System ist eine stabile Break-Even-Strategie im Falle eines Einlagenabbaus bei schnellen und aggressiven Währungspaaren. Der Expert Advisor platziert ein Raster von Pending Orders in beide Richtungen und sperrt, wenn eine negative Position auftritt, diese, wenn d
Crazy Scalper
Iurii Tokman
3.5 (4)
Crazy Scalper   Crazy Scalper   ist ein Nicht-Indikator-Handelsroboter, der ein Scalping-System verwendet, das gleichzeitig in zwei Richtungen handelt (Käufe und Verkäufe). Gleichzeitig können multidirektionale Positionen nicht profitabel sein und eine der offenen Positionen geht zwangsläufig verloren. Wenn es eine Verlierposition gibt, wird eine Sperre (Schloss) verwendet. Hat die Sperrposition wiederum ihre Funktion nicht erfüllt und der Quote reversiert, wird die Auszahlung nach dem Mittelung
Pyramid MA
Iurii Tokman
5 (1)
Pyramid MA   Pyramid MA   - Advisor-Eigenschaften: Es verwendet den Indikator Moving Averages (MA). Ändern des Auftragsrasters bei einer Trendumkehr. Der Exponent des Anstiegs des Auftragsvolumens des Haupthandelsnetzes gegenüber durchschnittlichen Positionen. Arbeiten Sie an ausstehenden Aufträgen BUYSTOP und SELLSTOP. Verwendet ein Verlustmittelungssystem mit Kontrolle über den Saldo der offenen Trades und bringt sie auf Break-Even. Tonbenachrichtigung über offene und abgeschlossene Geschäfte.
Boom
Iurii Tokman
Boom   Der Handelsroboter basiert auf einer Indikatoranalyse. Handelsentscheidungen werden basierend auf den Messwerten der gleitenden Durchschnitte getroffen, die Indikatoren können mit externen Variablen konfiguriert werden: TF = 0 - Auswahl der Arbeitsperiode des Diagramms. Kann eine der Perioden im Diagramm sein. 0 bedeutet die Periode des aktuellen Charts. 1 Minute. 5 - 5 Minuten. 15-15 Minuten. 30 - 30 Minuten. 60 - 1 Stunde 240 - 4 Stunden. 1440 - 1 Tag. 10 080 - 1 Woche. 43.200 - 1 Monat
Forex Jumper
Iurii Tokman
1 (1)
Forex Jumper   Forex Jumper   - ein Expert Advisor, der für die Arbeit mit dem Währungspaar EURJPY entwickelt wurde. Die Analyse des Candlestick-Musters ist ein Signal, um Handelsentscheidungen zu treffen. Der EA verwendet beim Handel Pending Orders BUYSTOP und SELLSTOP. Einstellungen: Lot = 0 - manuelle Einstellung des Volumens der geöffneten Orders Risiko = 13 - der Prozentsatz des Risikos für MM, funktioniert mit Lot = 0 MagicNumber = 208 - Kennung von Aufträgen und Positionen des Beraters,
Bands Jazz
Iurii Tokman
Bands Jazz   Bands Jazz   - der Expert Advisor basiert auf der Analyse von Signalen des   Bollinger Bands   Indikators. Der Algorithmus des Expert Advisors ist einfach, er verwendet SL, TP und das Schleppen von offenen Positionen. Beschreibung der Einstellungen TimeBeginHour   - Zahl, legt die Stunde der Handelsstartzeit fest. Werte von 0 - 24. TimeBeginMinute   - Zahl, legt die Minuten der Handelsstartzeit fest. Werte von 0 - 60. TimeEndHour   - Zahl, legt die Stunde des Handelsendes fest. W
Eureka Lock
Iurii Tokman
Eureka Lock   Eureka Lock   - der Expert Advisor bestimmt die flachen Bereiche der Preisbewegung relativ zu den angegebenen Einstellungen. Der Handel erfolgt durch Pending Orders BUY STOP und SELL STOP ab den Grenzen der angegebenen Flat. Anstatt den Verlust zu begrenzen, wird die Verriegelung einer Verlustposition mit einem erhöhten Volumen verwendet. Die virtuelle Gewinnebene wird ebenfalls verwendet. Beschreibung der Einstellungen: TF_flet = 15 - Chartperiode, in der die Wohnung bestimmt wi
Orders Info   Der Indikator zeigt zusammenfassende, allgemeine Informationen in einem Chartfenster. Praktisch für den gleichzeitigen Handel mit mehreren Währungspaaren. Der Indikator zeigt die Gesamtzahl der Marktpositionen und ausstehenden Aufträge an. Separat für offene Positionen angeben: für ein Währungspaar, für die Anzahl der offenen Käufe in diesem Währungspaar und deren Gesamtgewinn in der Einzahlungswährung, über die Anzahl der offenen Verkäufe und deren Gesamtgewinn, auf den Gesamtgewi
Cardiogram Market   Beschreibung der Einstellungen: MA_period_fast   - Mittelungsperiode zur Berechnung des schnellen gleitenden Durchschnitts. MA_period_slow   - Mittelungsperiode zur Berechnung des langsamen gleitenden Durchschnitts. price   - Der zu verwendende Preis. Kann eine beliebige Preiskonstante sein. 0 - (SCHLIESSEN) Schlusskurs. 1 - (OPEN) Eröffnungspreis. 2 - (HOCH) Hoher Preis. 3 - (NIEDRIG) Niedrigster Preis. 4 - (MEDIAN) Durchschnittspreis, (hoch + niedrig) / 2. 5 - (TYPISCH) Typ
Piramida Grid   Piramida Grid - Um in den Markt einzutreten, analysiert der Berater die Messwerte des Indikators   Slope Direction Line.   Ändern des Orderrasters, wenn sich der Markt umkehrt. Arbeiten Sie an ausstehenden Aufträgen BUYSTOP und SELLSTOP. Verwendet ein Verlustmittelungssystem mit Kontrolle des Saldos offener Trades und ihrer Ausgabe ohne Verlust. Automatische Erkennung von 6 und 5 Ziffern. Beratereinstellungen: Periode = 32; - Periode des Neigungsrichtungslinienindikators Filter
Martin Pristine
Iurii Tokman
5 (1)
Martin Pristine   Martin Pristine ist ein Handelsroboter, ein Berater, der die Analyse der   Indikatorwerte von Price Channel Central   als Signale für Handelsentscheidungen verwendet. Eine zusätzliche Installation des Indikators auf dem Chart ist nicht erforderlich, der Indikator ist im Inneren des Expert Advisors integriert. Nach jedem verlorenen Trade wird das Volumen mit 2 multipliziert. Der Expert Advisor erkennt automatisch 5 und 6 Stellen in den Notierungen von Währungspaaren. Es kann imm
Future Price   Future Price - Der Indikator zeigt die erwarteten Optionen für die zukünftige Preisbewegung basierend auf der Suche nach Übereinstimmungen in der Kurshistorie. Der Indikator arbeitet in zwei Modi, der erste - Aufzählen und Anzeigen einer bestimmten Anzahl von Optionen, der zweite - der Indikator zeigt eine eingestellte Option an. Beschreibung der Einstellungen Statische_VARIANTEN = 0; - Stellen Sie die gewünschte Option auf die Anzeige ein, wenn = 0, funktioniert die Iteration d
Reanimator
Iurii Tokman
Reanimator   Halbautomatischer Handelsroboter. Zum Öffnen/Schließen von Positionen verwenden Sie die Tasten. Die weitere Verfolgung der Position erfolgt automatisch entsprechend der virtuellen Gewinnhöhe. Es wird auch ein System zur Mittelung unrentabler Positionen mit einem reduzierten / erhöhten Lot verwendet. Die Druckknopfsteuerung des Beraters im Strategietester funktioniert nicht, der Berater kann nur auf einem Demo- oder Echtkonto vollständig getestet werden. Im Strategietester kann der A
FletBoxPush   Der Indikator bestimmt die flachen Bereiche der Preisbewegung gemäß den angegebenen Parametern. Einstellungen: TimeFrames - Auswahl des Chartzeitraums. FlatPips - Punktelimit für die Bestimmung eines Flats FlatBars - Begrenzung der Anzahl der Balken zur Bestimmung eines Flats CountBars - die Anzahl der Balken im Verlauf zur Analyse der Preisbewegung, bei 0 werden alle Balken im Verlauf analysiert Farbe - die Farbe des als Flat definierten Preissegments PriceTag - zusätzliche Zeich
BarKhan
Iurii Tokman
BarKhan   BarKhan - der Indikator wird als Summe der Differenzen von drei digitalen gleitenden Durchschnitten berechnet. Die Berechnungsformel lautet wie folgt: Die Differenz zwischen den digitalen gleitenden Durchschnitten # 1 und # 2 wird mit der Differenz zwischen den digitalen gleitenden Durchschnitten # 2 und # 3 aufsummiert Beschreibung der Anzeigeeinstellungen: MA_Period1 - Periode des ersten digitalen gleitenden Durchschnitts MA_Period2 - Periode des zweiten digitalen gleitenden Durchsch
Octet
Iurii Tokman
Octet   Der Indikator ist Multiwährung, er analysiert 56 Währungspaare gleichzeitig. Wichtig ist, dass sich alle Währungspaare in der Marktübersicht befinden und Kurse für diese geladen werden. Der Indikator zeigt den Anstieg oder Rückgang einer bestimmten Währung im Verhältnis zu insgesamt 7 anderen Währungen in Form einer Linie an. Die Indikatorwerte werden in Prozent ausgedrückt. Beschreibung der Anzeigeeinstellungen Type_Calculation - drei Optionen zur Berechnung des Prozentsatzes des Wach
Strong Weak   Der Multicurrency-Indikator analysiert 56 Währungspaare gleichzeitig: AUD EUR GBP NZD CAD CHF JPY USD AUD SUMM EURAUD GBPAUD AUDNZD AUDCAD AUDCHF AUDJPY AUDUSD EUR EURAUD SUMM EURGBP EURNZD EURCAD EURCHF EURJPY EURUSD GBP GBPAUD EURGBP SUMM GBPNZD GBPCAD GBPCHF GBPJPY GBPUSD NZD AUDNZD EURNZD GBPNZD SUMM NZDCAD NZDCHF NZDJPY NZDUSD CAD AUDCAD EURCAD GBPCAD NZDCAD SUMM CADCHF CADJPY USDCAD CHF AUDCHF EURCHF GBPCHF NZDCHF CADCHF SUMM CHFJPY USDCHF JPY AUDJPY EURJPY GBPJPY NZDJPY CA
Grid Flat
Iurii Tokman
Grid Flat   Der Expert Advisor platziert ein Raster von Aufträgen mit einem bestimmten Schritt. Aufträge haben ein Gewinnniveau im Rasterschrittabstand und ein allgemeines Verlustniveau für alle Aufträge desselben Typs. Der Handel erfolgt nur innerhalb des in den Einstellungen angegebenen Zeitraums, am Ende der Zeit werden alle Pending Orders gelöscht und alle offenen Positionen zwangsweise geschlossen. Es wird nicht empfohlen, den EA als vollautomatisches Handelssystem für den langfristigen Han
Break Even LeveL   Der Indikator funktioniert, wenn es offene Orders auf dem Markt gibt und berechnet das Preisniveau, bei dessen Erreichen der Gesamtgewinn aller offenen Orders gleich Null ist, dem Niveau ohne Verlust. Die Berechnung berücksichtigt die Orders des Währungspaars, auf dem der Indikator läuft. Bestellungen können nach magischer Zahl gefiltert werden. Beschreibung der Anzeigeeinstellungen: Line_Create - eine Linie ohne Verlust anzeigen color_Line - Linienfarbe style_Line - Liniensti
Auswahl:
Chun Hong Yang
141
Chun Hong Yang 2024.02.21 02:58 
 

Cool indicator, how do I call via EA, please reply to me, thanks

Iurii Tokman
61226
Antwort vom Entwickler Iurii Tokman 2024.02.21 04:58
hi, use iCustom(...)
BTV InvestingTrading
48
BTV InvestingTrading 2023.11.28 12:13 
 

Great, thank’s !!!

Iurii Tokman
61226
Antwort vom Entwickler Iurii Tokman 2023.11.28 19:35
thank you, I wish you huge profits
elkonsis
227
elkonsis 2021.11.28 20:06 
 

Good indicator.

Iurii Tokman
61226
Antwort vom Entwickler Iurii Tokman 2021.11.29 05:11
thank you, I wish you huge profits
Rogerio1985
387
Rogerio1985 2021.05.21 22:22 
 

Top

Iurii Tokman
61226
Antwort vom Entwickler Iurii Tokman 2021.05.22 09:27
Спасибо!
Артем
16
Артем 2020.12.03 12:53 
 

Полезный инструмент, мне понравилось. Спасибо автору!

Iurii Tokman
61226
Antwort vom Entwickler Iurii Tokman 2021.05.22 09:27
Спасибо!
Antwort auf eine Rezension