• Übersicht
  • Bewertungen (14)
  • Diskussion (30)
  • Neue Funktionen

Dual Bermaui Deviation Percent

5

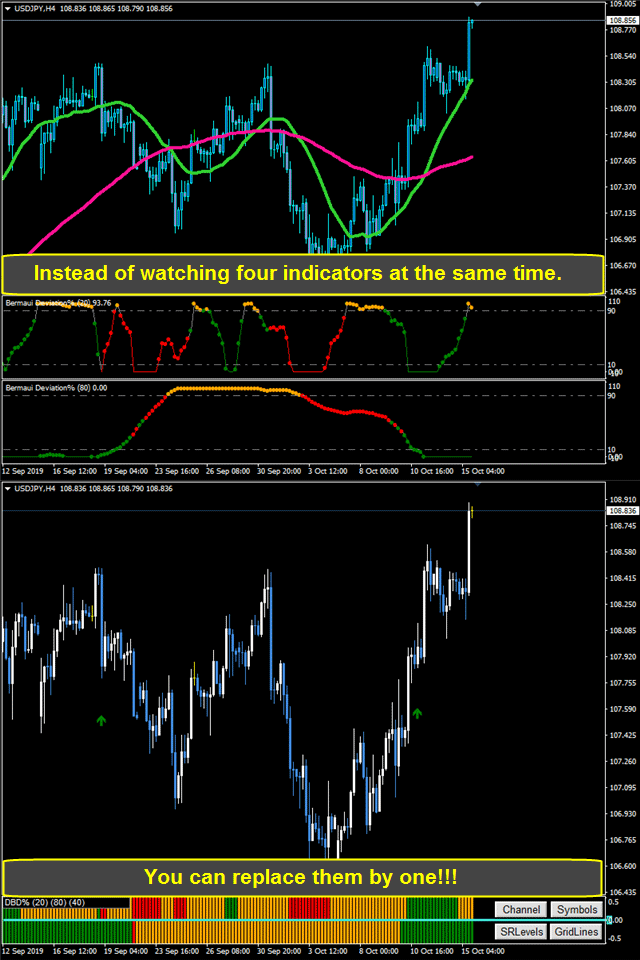
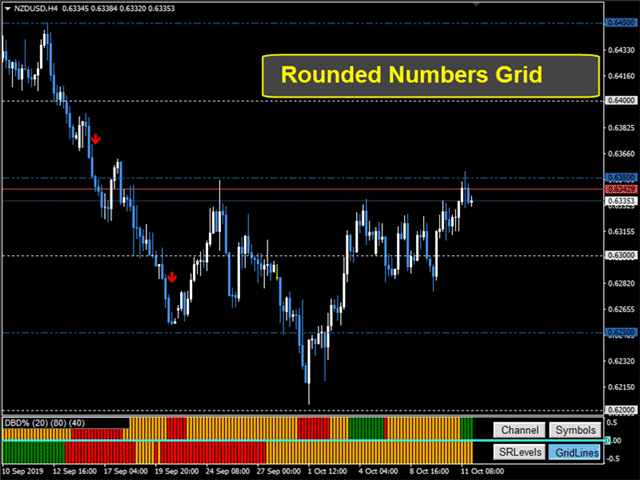
Or DBD%. The indicator consists of colored tape that shows trading signals depending on two Bermaui Deviation Oscillator (BD%) and two moving averages.

Bermaui Deviation Percent is a volatility index that measures volatility in percent rather than points. The idea of BD% is to make an index depending on Classic Standard Deviation (CSD) that moves between 0 and 100 percent.

Important Information

DBD% expert advisor example:  https://www.mql5.com/en/blogs/post/731145

        If you want to know more about BD% then please read the next bog:  https://www.mql5.com/en/blogs/post/718182


        DBD% consists of two signal tapes, one is fast and the other is slow. A buy signal comes when fast and slow are bullish. A sell signal comes when both fast and slow are bearish.

        DBD% Features

               The combination of two BD% with two different periods could help at catching the different market cycles.

               Using BD% as a trend filter is a great advantage because of BD% work as a filter for low volatility movements in the market.

               Signals appear at the first opening after buy/sell conditions are met.

               Well-designed parameters to help the user easily navigate between them.

               DBD% code is revised to make sure that it will not consume the user's PC memory.

               DBD% arrows do not repaint or recalculate its results.

               DBD% sends emails and push notifications to mobile devices.

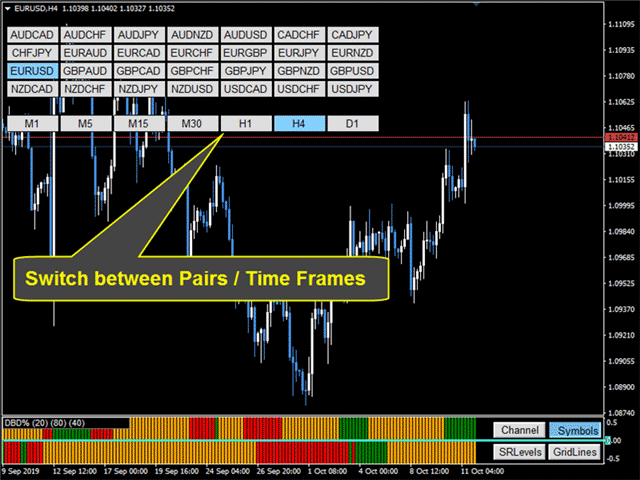
               Easily switch between different symbols or time-frames.

               Plot Standard Deviation or Linear Regression Channels to show Overbought and Oversold areas.

               Plot a grid of rounded numbers, which show the most important psychological levels.

               Plot Support and resistance levels that mirror supply and demand on the chart.

              DBD% Parameters Map

              1) INDICATOR SETTINGS

                    Fast DBD% Candles [Min=2]: Default is 20. Minimum is 2.

                    Slow DBD% Candles [Min=3]: Default is 80. Minimum is 3and slow should be bigger than fast at least by one candle.

                    DBD% Sideway Level: Default 40%

                  2) ALERTS & EMAIL SETTINGS

                        Alert on New Arrow: Default is true.

                        Send Email on New Arrow: Default is false.

                        Send Notification on New Arrow: Default is false.


                      3) ARROWS SETTINGS

                           Show Arrows & Lines: Default is Show Arrows Only.

                           Arrows Size: Default is one.


                          4) UTILITIES SETTINGS

                               Symbols Source From: Get symbols from custom symbol list  or from Market Watch.

                               List of symbols (separated by ";"): If you choose symbols from a custom list then separate between symbols by ";".

                               Button Font Size: Default is 10.

                               Chart on Foreground: Default is false.

                               Channel Length [ > 1 ]: Default is 100.

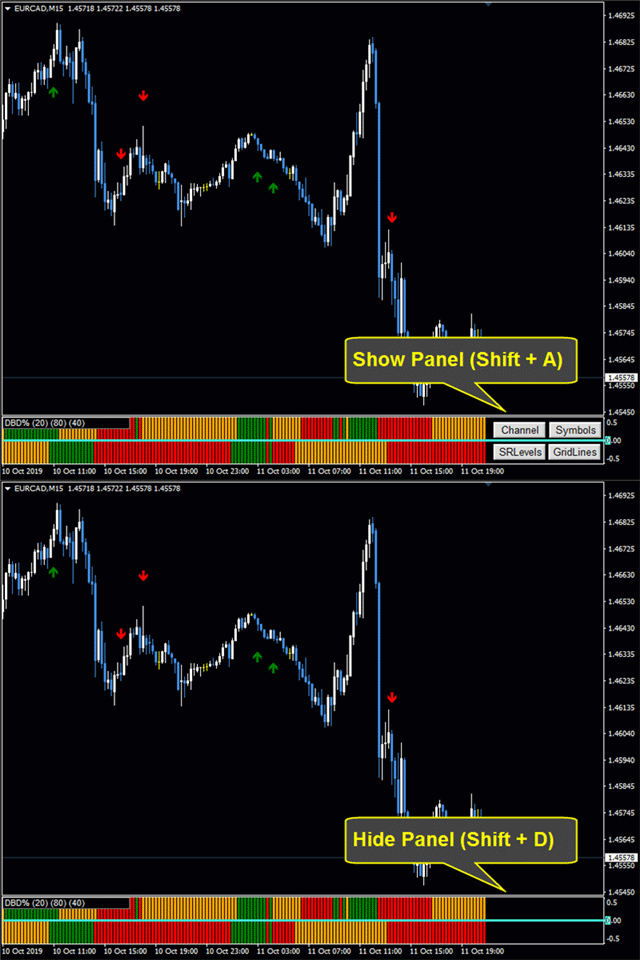
                               Panel Appear [Shift + Letter]: Key to press plus shift if the user wants to hide the panel. Default is " A".

                               Panel Disappear [Shift + Letter]: Key to press plus shift if the user wants to hide the panel. Default is " D".

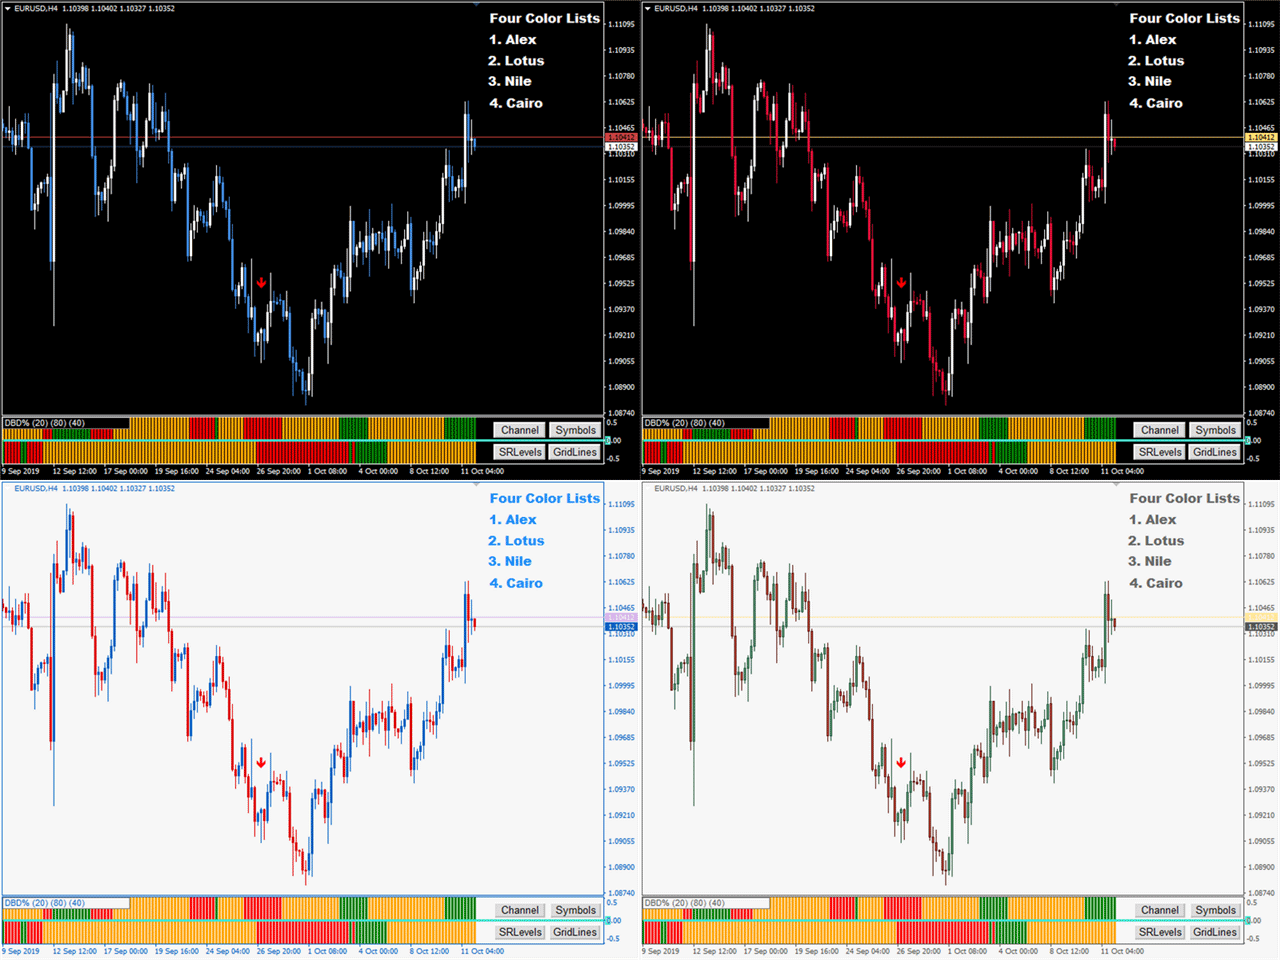
                               Chart Colors List: Four color lists to choose from. If the user wants to use his own colors then he can choose to (Do Nothing).


                              If you have any questions then please, contact me via a private message or, write them in the comment section.
                              Muhammad Al Bermaui, CMT


                              Bewertungen 14
                              Hisham Ghoneim
                              301
                              Hisham Ghoneim 2021.09.22 09:39 
                               

                              I already purchase the full set EA + BD% +DBD% as i' satisfied with Elbermawi trading tool and this is not my first time dealing with his great trading tools, it is really helpful for good trading results.

                              Paulina Andrea Madariaga Figueroa
                              4107
                               

                              Very good indicator, I have spent money in another indicators and with Bermaui tools I have everything.

                              digger55
                              237
                              digger55 2020.01.15 18:08 
                               

                              Good and professional tool.

                              Empfohlene Produkte
                              "The Squeeze indicator attempts to identify periods of consolidation in a market. In general the market is either in a period of quiet consolidation or vertical price discovery. By identifying these calm periods, we have a better opportunity of getting into trades with the potential for larger moves. Once a market enters into a "squeeze," we watch the overall market momentum to help forecast the market direction and await a release of market energy." The StdATR Squeeze Channel combines standard
                              This is an intraday indicator that uses conventional formulae for daily and weekly levels of pivot, resistance and support, but updates them dynamically bar by bar. It answers the question how pivot levels would behave if every bar were considered as the last bar of a day. At every point in time, it takes N latest bars into consideration, where N is either the number of bars in a day (round the clock, i.e. in 24h) or the number of bars in a week - for daily and weekly levels correspondingly. So,
                              The indicator is the advanced form of the MetaTrader 4 standard Fibonacci tool. It is unique and very reasonable for serious Fibonacci traders. Key Features Drawing of Fibonacci retracement and expansion levels in a few seconds by using hotkeys. Auto adjusting of retracement levels once the market makes new highs/lows. Ability to edit/remove any retracement & expansion levels on chart. Auto snap to exact high and low of bars while plotting on chart. Getting very clear charts even though many ret
                              COG LR Osc AM
                              Andriy Matviyevs'kyy
                              The presented indicator allows you to determine potential entry points into the market and set protective orders at reasonable levels. This product can be useful for both beginners and experienced traders. The indicator is based on calculation methods proven by time and practicing traders. The indicator is calculated in two stages: At the first stage, linear regression (LR) of the selected price type is determined for a given number of chart periods. At the second stage, the obtained data is p
                              Simple Long Short Bar A very concise and clear indicator, very easy to understand, but it is very useful for tracking trends. The usage of this indicator is very simple: Long signal: If the price shows signs of a long market, then a yellow box will appear. Short signal: If the price shows signs of a short market, then a blue box will appear. Bull strength: If the size of the box is large, it means the bull strength is strong, and vice versa. Short strength: If the size of the box is small, it m
                              The Icarus Auto Dynamic Support and Resistance  Indicator provides a highly advanced, simple to use tool for identifying high-probability areas of price-action automatically - without any manual input whatsoever. .  All traders and investors understand the importance of marking horizontal levels on their charts, identifying areas of supply and demand, or support and resistance. It is time-consuming and cumbersome to manually update all instruments, across all timeframes, and it requires regular
                              Trend formation channel is a set of lines. The two central lines of the indicator represent moving averages of the specified type and period, they also form a small channel. The large channel is formed - the central lines of the indicator plus / minus the standard deviation estimate, multiplied by the coefficient selected by the user. The basic rule for plotting is that about 5% of prices should be outside these lines, and 95% - inside. If the price crosses the upper or lower line too often, th
                              PZ Harmonacci Patterns
                              PZ TRADING SLU
                              3.43 (7)
                              Dies ist wahrscheinlich der vollständigste Indikator für die automatische Erkennung der harmonischen Preisbildung, den Sie für die MetaTrader-Plattform finden können. Es erkennt 19 verschiedene Muster, nimmt Fibonacci-Projektionen genauso ernst wie Sie, zeigt die potenzielle Umkehrzone (PRZ) an und findet geeignete Stop-Loss- und Take-Profit-Werte. [ Installationsanleitung | Update-Anleitung | Fehlerbehebung | FAQ | Alle Produkte ] Es erkennt 19 verschiedene harmonische Preisbildungen Dar
                              Fibonacci retracements can be used to draw support lines, identify resistance levels, place stop-loss orders and set target prices. The Advanced Automatic Fibonacci retracements draws automatically all the levels. You have a lot of options to choose. For exemple you can use the tracements of another time frame (MTF) in the current chart, you can also choose between the closest level or less close to draw the retracements. You can also add 2 levels of your choice. You can add levels extensions o
                              Automatic fibonacci with alerts is an indicator that automatically plots a fibonacci retracement based on the number of bars you select on the BarsToScan setting in the indicator. The fibonacci is automatically updated in real time as new highest and lowest values appear amongst the selected bars. You can select which level values to be displayed in the indicator settings. You can also select the color of the levels thus enabling the trader to be able to attach the indicator several times with d
                              FiboZag
                              Andriy Sydoruk
                              Indicator FiboZag - transfer the indicator to the chart and the Fibonacci levels will be built automatically on the last ZigZag turn. The main advantage lies in the correct construction of Fibonacci levels and markup of price levels. Simple, visual and effective use. The indicator is not redrawn and does not lag. Works on all currency pairs and on all timeframes.
                              TSO Bollinger Bandit Strategy is an indicator based on the Bollinger Bandit Trading Strategy as presented in the book Building Winning Trading Systems with TradeStation by G. Pruitt and J. R. Hill. SCANNER is included . Now with Scanner you can find trading opportunities and setups easily and faster. Features A complete entry and exit strategy for trending markets. Get email / push notifications when an entry signal occurs. The indicator is not repainting. Can easily be used in an EA. (see For
                              Fibonaccitools
                              Aymn Sʿyd Ahmd Hsn Alkwmy
                              Fibonacci-Retracements sind beliebte Tools, mit denen Trader Unterstützungslinien ziehen, Widerstandsniveaus identifizieren, Stop-Loss-Orders platzieren und Zielpreise festlegen können. Ein Fibonacci-Retracement wird erstellt, indem zwei Extrempunkte auf einem Aktienchart genommen und die vertikale Distanz durch die wichtigsten Fibonacci-Verhältnisse von 23,6%, 38,2%, 50%, 61,8% und 100% geteilt werden. Der Fibonacci-Tools-Indikator zeichnet Fibonacci-Tools z.B. Retracement, Arc, Fan, Expansion
                              Crazy Dancing moving RES/SUP Levels Automatic redrawing of moving Supports and resistances levels  to indicate price breaking supports (signal SELL)  or breaking resistance levels (signal BUY) Very simple appearing indicator but very clever and smart too !!!! Main Inputs: # of bars for the support and resistances levels + the initial shift from start + moving average for filter signaling Smaller values for bars /shift inputs when using Higher Time frames (D1-H4) and the reverse higher values for
                              VR Cub
                              Vladimir Pastushak
                              VR Cub ist ein Indikator für den Erhalt hochwertiger Einstiegspunkte. Der Indikator wurde entwickelt, um mathematische Berechnungen zu erleichtern und die Suche nach Einstiegspunkten in eine Position zu vereinfachen. Die Handelsstrategie, für die der Indikator geschrieben wurde, hat sich seit vielen Jahren bewährt. Ihr großer Vorteil liegt in der Einfachheit der Handelsstrategie, die es auch unerfahrenen Händlern ermöglicht, erfolgreich damit zu handeln. VR Cub berechnet Positionseröffnungspunkt
                              The indicator displays Renko bars on the chart, uses them to plot the ZigZag - trend lines connecting the local Lows and Highs of the price movement, and highlights them based on the Gartley patterns, showing the potential price reversal points. Renko - specialized display of the price action, in which the graph is displayed not every bar of the time frame, but only under the condition that the price had passed more than the specified number of points. Renko bars are not bound to a time frame, s
                              Bermaui Bands
                              Muhammad Elbermawi
                              4.94 (89)
                              Bermaui Bands (BB) ist ein technisches Analysetool, das dabei hilft, zwischen Bereichs- und Trendkursbewegungen zu filtern. Die Idee hinter diesem Indikator lässt sich in den nächsten Schritten erklären: Berechnen Sie die Standardabweichung als Oszillator, der sich zwischen 0 und 100 bewegt. Ich nenne sie Bermaui-Abweichung in Prozent (BD %). Wenn "BD %" nahe Null ist, ist die Volatilität am höchsten. Außerdem ist die Volatilität sehr gering, wenn "BD %" nahe 100 liegt. Hohe Volatilität bedeutet
                              The Sextet Scalper Pro  is an MT4 indicator that gives signals when new waves are starting in a trend. The trends are calculated using the original " The Sextet " indicator method. You get a free EA to trade with The Sextet Scalper Pro: Free EA . Default settings were optimized on GBPUSD H1 from 2017. EA could be tested on free demo version of The Sextet Scalper Pro, before purchase. Key Features: Uses The Sextet Trend Detection Method which is already a good strategy in itself for detecting l
                              PABT Pattern Indicator - it's classical system one of the signal patterns. Indicator logic - the Hi & Lo of the bar is fully within the range of the preceding bar, look to trade them as pullback in trend. In the way if indicator found PABT pattern it's drawing two lines and arrow what showing trend way.  - First line - it's entry point and drawing at: 1. On the high of signal bar or on middle of the signal bar (depending from indicator mode) for buy; 2. On the low of signal bar or on middle of t
                              Noize Absorption Index MT4
                              Ekaterina Saltykova
                              5 (1)
                              Noize Absorption Index - is the manual trading system that measures the difference of pressure between bears forces and bulls forces. Green line - is a noize free index that showing curent situation. Zero value of index shows totally choppy/flat market.Values above zero level shows how powerfull bullish wave is and values below zero measures bearish forces.Up arrow appears on bearish market when it's ready to reverse, dn arrow appears on weak bullish market, as a result of reverse expectation. S
                              This is a well-known ZigZag indicator. But it differs by the fact that its plot is based on values of the middle line which is set by a user. It can display Andrews’ Pitchfork and standard or Bobokus Fibo levels. NO REPAINTING. Parameters Period МА — middle line period. Default value is 34. Minimum value is 4. Maximum value is set at your discretion. Used to calculate price - base price to calculate the middle line. The averaging method - method of smoothing the middle line. Turning pitchfork
                              A top-quality implementation of the famous  Zig Zag  indicator, which needs no introduction. It is completely coming from original algorithm.  After you have this indicator, you will no need any more indicator for opposite direction of trend. Trading direction of TREND Very easy to understand and set  It implements a multi-timeframe dashboard Buy and Sell signals on same chart  Working M5-M15-M30-H1-H4 and D1  After the purchase, please contact me for to learn how to use it. 
                              Trendiness Index
                              Libertas LLC
                              5 (3)
                              "The trend is your friend" is one of the best known sayings in investing, because capturing large trendy price movements can be extremely profitable. However, trading with the trend is often easier said than done, because many indicators are based on price reversals not trends. These aren't very effective at identifying trendy periods, or predicting whether trends will continue. We developed the Trendiness Index to help address this problem by indicating the strength and direction of price trend
                              LordTrendSignal
                              Igor Pereira Calil
                              LordTrendSignal is a financial market indicator for Meta Trader that checks signals through trends and candles, works on all TimeFrames (M1, M5, M15, M30, H1, H4, D1). LordTrendSignal checks the signal through trends and candles and informs you via notification, alerts via email and push on the automatic screen. The trend flexibility of LordTrendSignal is high, however, together with other of our indicators LordAutoFibonacci and LordAutoTrendLine you will be able to work very well to obtain
                              The Arrows Forecasters indicator is simple, visual and effective trend detection. The intelligent algorithm of the indicator determines the trend with a good probability. Uses just one parameter for settings. The indicator shows the points of potential market reversal. Ready-made trading system. The indicator does not redraw and does not lag. Works on all currency pairs and on all timeframes. You should remember that using a combination of forecasting tools, it is advisable to choose 2-3 indi
                              Níveis de suporte ou resistência formados quando a ação do preço de um mercado reverte e muda de direção, deixando para trás um pico ou vale (ponto de oscilação) no mercado. Os níveis de suporte e resistência podem criar faixas de negociação. O indicador identifica High e Low com base no Período. Características principais Um conceito chave da análise técnica é que quando um nível de resistência ou suporte é quebrado, seu papel é invertido. Se o preço cair abaixo de um nível de suporte, esse
                              Trend Divergence Finder – индикатор, позволяющий выявлять дивергенции цены и графика выбранного индикатора. С помощью Trend Divergence Finder вы сможете подобрать тот индикатор, который наиболее эффективен для Вас, и использовать его с наглядным отображением на графике. В индикатор включены 9 базовых индикаторов : 1.        RSI 2.        MACD 3.        MOMENTUM 4.        RVI 5.        STOCHASTIC 6.        CCI 7.        Standard Deviation 8.        Derivative 9.        William Blau Присутст
                              This is a new strategy for SUPPLY DEMAND areas It is based on a calculation using the tick volume to detect the big price action in market for both bear /bull actions this smart volume action candles are used to determine the supply and demand areas prices in between main supply and demand lines indicate sideway market  up arrows will be shown when prices moves above the main supply and the secondary supply lines Down arrows will be shown when prices moves below the main demand and the secondary
                              DMS Fibo
                              Diogo Mitsunaga Dos Santos
                              Fibonacci retracements are trend lines drawn between two significant points, usually between absolute lows and absolute highs, plotted on a chart. Intersecting horizontal lines are placed at the Fibonacci levels. Fibonacci retracements are useful tools that help traders identify support and resistance levels. With the information gathered, they can place orders, identify stop-loss levels, and set price targets. Although useful, traders often use other indicators to make more accurate assessments
                              BeST Swing Strategy is a Metatrader indicator based on the corresponding Jim Berg's work about volatility as described in his article "The Truth About Volatility" (TASC 2/2005).The indicator consists of 2 channel lines deriving as (MA +/- times the ATR) and can be used as a standalone trading system.The outlier prices of the Market as of the indicator's values can be used for producing Entry and Exit Signals. Advantages of the indicator == Uses 2 Swing Strategies (Normal and Reverse) == Ne
                              Käufer dieses Produkts erwarben auch
                              Gann Made Easy
                              Oleg Rodin
                              4.95 (44)
                              Gann Made Easy ist ein professionelles und einfach zu bedienendes Forex-Handelssystem, das auf den besten Handelsprinzipien unter Verwendung der Theorie von Mr. basiert. W.D. Gann. Der Indikator liefert genaue KAUF- und VERKAUFSsignale, einschließlich Stop-Loss- und Take-Profit-Levels. Mit PUSH-Benachrichtigungen können Sie auch unterwegs handeln. Bitte kontaktieren Sie mich nach dem Kauf! Ich werde meine Handelstipps und tolle Bonusindikatoren kostenlos mit Ihnen teilen! Wahrscheinlich haben Si
                              Präsentation des Miraculous Forex Indikators: Entfesseln Sie die Kraft präzisen Tradings Sind Sie es leid, nach dem besten Forex-Indikator zu suchen, der wirklich herausragende Ergebnisse in allen Zeitebenen liefert? Suchen Sie nicht weiter! Der Miraculous Forex Indikator ist da, um Ihre Trading-Erfahrung zu revolutionieren und Ihre Gewinne auf neue Höhen zu bringen. Basierend auf modernster Technologie und jahrelanger sorgfältiger Entwicklung steht der Miraculous Forex Indikator als Höhepunkt v
                              Derzeit 20% Rabatt! Die beste Lösung für jeden Neueinsteiger oder Expert Händler! Dieses Dashboard arbeitet mit 28 Währungspaaren. Es basiert auf 2 unserer Hauptindikatoren (Advanced Currency Strength 28 und Advanced Currency Impulse). Es bietet einen hervorragenden Überblick über den gesamten Forex-Markt. Es zeigt die Werte der Advanced Currency Strength, die Veränderungsrate der Währungen und die Signale für 28 Devisenpaare in allen (9) Zeitrahmen. Stellen Sie sich vor, wie sich Ihr Hande
                              Atomic Analyst
                              Issam Kassas
                              5 (1)
                              Zunächst einmal ist es erwähnenswert, dass dieser Handelsindikator nicht neu malt, nicht neu zeichnet und keine Verzögerung aufweist, was ihn sowohl für manuellen als auch für Roboterhandel ideal macht. Der Atom-Analyst ist ein PA-Preisaktionsindikator, der die Stärke und das Momentum des Preises nutzt, um einen besseren Vorteil auf dem Markt zu finden. Ausgestattet mit fortschrittlichen Filtern, die helfen, Rauschen und falsche Signale zu entfernen, und das Handelspotenzial zu erhöhen. Durch
                              TPSproTREND PrO
                              Roman Podpora
                              5 (15)
                              TPSpro TRENDPRO  - is a trend indicator that automatically analyzes the market and provides information about the trend and each of its changes, as well as giving signals for entering trades without redrawing! The indicator uses each candle, analyzing them separately. referring to different impulses - up or down impulse. Exact entry points into transactions for currencies, crypto, metals, stocks, indices!  -  Version MT5               DETAILED DESCRIPTION        /       TRADING SETUPS           
                              TPSpro RFI Levels
                              Roman Podpora
                              5 (13)
                              A key element in trading is zones or levels from which decisions to buy or sell a trading instrument are made. Despite attempts by major players to conceal their presence in the market, they inevitably leave traces. Our task was to learn how to identify these traces and interpret them correctly. Reversal First Impulse levels (RFI)   -  Version MT5                INSTRUCTIONS                 RUS                 ENG                                       R ecommended to use with an indicator   -  
                              Wir stellen vor       Quantum Trend Sniper Indicator   , der bahnbrechende MQL5-Indikator, der die Art und Weise, wie Sie Trendumkehrungen erkennen und handeln, verändert! Entwickelt von einem Team erfahrener Händler mit über 13 Jahren Handelserfahrung,       Quantum Trend Sniper-Indikator       wurde entwickelt, um Ihre Trading-Reise mit seiner innovativen Methode zur Identifizierung von Trendumkehrungen mit extrem hoher Genauigkeit auf ein neues Niveau zu heben. ***Kaufe Quantum Trend Snipe
                              DERZEIT 26% RABATT Die beste Lösung für jeden Newbie oder Expert Trader! Dieser Indikator ist ein einzigartiges, qualitativ hochwertiges und erschwingliches Trading-Tool, da wir eine Reihe von proprietären Funktionen und eine neue Formel integriert haben. Mit nur EINEM Chart können Sie die Währungsstärke für 28 Forex-Paare ablesen! Stellen Sie sich vor, wie sich Ihr Handel verbessern wird, weil Sie in der Lage sind, den genauen Auslösungspunkt eines neuen Trends oder einer Scalping-Gelegenh
                              TrendMaestro
                              Stefano Frisetti
                              5 (2)
                              note: this indicator is for METATRADER4, if you want the version for METATRADER5 this is the link: TRENDMAESTRO recognizes a new TREND in the bud, he never makes mistakes. The certainty of identifying a new TREND is priceless. DESCRIPTION TRENDMAESTRO identifies a new TREND in the bud, this indicator examines the volatility, volumes and momentum to identify the moment in which there is an explosion of one or more of these data and therefore the moment in which prices have strong probability of f
                              Scalper Inside PRO
                              Alexey Minkov
                              4.75 (55)
                              An exclusive indicator that utilizes an innovative algorithm to swiftly and accurately determine the market trend. The indicator automatically calculates opening, closing, and profit levels, providing detailed trading statistics. With these features, you can choose the most appropriate trading instrument for the current market conditions. Additionally, you can easily integrate your own arrow indicators into Scalper Inside Pro to quickly evaluate their statistics and profitability. Scalper Inside
                              Zunächst einmal ist es wichtig zu betonen, dass dieses Handelstool ein Nicht-Repaint-, Nicht-Redraw- und Nicht-Verzögerungsindikator ist, was es ideal für professionelles Trading macht. Der Smart Price Action Concepts Indikator ist ein sehr leistungsstarkes Werkzeug sowohl für neue als auch erfahrene Händler. Er vereint mehr als 20 nützliche Indikatoren in einem und kombiniert fortgeschrittene Handelsideen wie die Analyse des Inner Circle Traders und Strategien des Smart Money Concepts. Diese
                              Trend Screener
                              STE S.S.COMPANY
                              4.83 (86)
                              Trendindikator, bahnbrechende, einzigartige Lösung für Trendhandel und -filterung mit allen wichtigen Trendfunktionen in einem Tool! Es handelt sich um einen 100 % nicht neu zu malenden Multi-Timeframe- und Multi-Währungs-Indikator, der für alle Symbole/Instrumente verwendet werden kann: Forex, Rohstoffe, Kryptowährungen, Indizes und Aktien. Trend Screener ist ein effizienter Trendfolgeindikator, der Pfeiltrendsignale mit Punkten im Diagramm liefert. Die Funktionen, die im Trendanalysator-Indika
                              XQ Indicator MetaTrader 4
                              Marzena Maria Szmit
                              3 (2)
                              Step into the realm of Forex trading with confidence and precision using XQ, a cutting-edge Forex indicator designed to elevate your trading game to unprecedented heights. Whether you're a seasoned trader or just stepping into the world of currency exchange,   XQ Forex Indicator   empowers you with the insights and signals needed to make informed trading decisions. The signal conditions are a combination of three indicators, and XQ Forex Indicator only display  medium and long-term trends . The
                              Quantum Breakout Indicator PRO
                              Bogdan Ion Puscasu
                              4.96 (26)
                              Wir stellen vor       Quantum Breakout PRO   , der bahnbrechende MQL5-Indikator, der die Art und Weise, wie Sie mit Breakout-Zonen handeln, verändert!   Quantum Breakout PRO   wurde von einem Team erfahrener Händler mit über 13 Jahren Handelserfahrung entwickelt und soll Ihre Handelsreise mit seiner innovativen und dynamischen Breakout-Zonen-Strategie auf ein neues Niveau bringen. Der Quantum Breakout Indicator zeigt Ihnen Signalpfeile auf Breakout-Zonen mit 5 Gewinnzielzonen und Stop-Loss
                              PRO Renko System ist ein hochpräzises Handelssystem, das speziell für den Handel mit RENKO-Charts entwickelt wurde. Dies ist ein universelles System, das auf verschiedene Handelsinstrumente angewendet werden kann. Das System neutralisiert effektiv so genannte Marktgeräusche, die Ihnen Zugang zu genauen Umkehrsignalen geben. Der Indikator ist sehr einfach zu bedienen und hat nur einen Parameter, der für die Signalerzeugung verantwortlich ist. Sie können das Tool einfach an jedes Handelsinstr
                              FX Power MT4 NG
                              Daniel Stein
                              5 (8)
                              Erhalten Sie Ihr tägliches Marktupdate mit Details und Screenshots über unser Morning Briefing hier auf mql5 und auf Telegram ! FX Power MT4 NG ist die nächste Generation unseres langjährig sehr beliebten Währungsstärkemessers FX Power. Und was bietet dieser Stärkezähler der nächsten Generation? Alles, was Sie am ursprünglichen FX Power geliebt haben PLUS GOLD/XAU-Stärkeanalyse Noch präzisere Berechnungsergebnisse Individuell konfigurierbare Analysezeiträume Anpassbares Berechnungslimit für noc
                              Wir stellen Ihnen ON Trade Waves Patterns Harmonic Elliot Wolfe vor, einen fortschrittlichen Indikator, der entwickelt wurde, um verschiedene Markt-Muster mithilfe sowohl manueller als auch automatischer Methoden zu erkennen. Hier ist, wie er funktioniert: Harmonische Muster: Dieser Indikator kann harmonische Muster erkennen, die auf Ihrem Chart erscheinen. Diese Muster sind für Trader, die die Theorie des harmonischen Handels praktizieren, wie sie in Scott Carney's Buch "Harmonic Trading vol 1
                              Advanced Supply Demand
                              Bernhard Schweigert
                              4.92 (310)
                              Derzeit 33% Rabatt! Die beste Lösung für jeden Anfänger oder erfahrenen Händler! Dieser Indikator ist ein einzigartiges, qualitativ hochwertiges und erschwingliches Trading-Tool, da wir eine Reihe von proprietären Funktionen und eine neue Formel integriert haben. Mit diesem Update werden Sie in der Lage sein, doppelte Zeitrahmenzonen anzuzeigen. Sie können nicht nur einen höheren TF (Zeitrahmen) anzeigen, sondern sowohl den Chart-TF als auch den höheren TF: SHOWING NESTED ZONES. Alle Supply Dema
                              Entdecken Sie das Geheimnis des erfolgreichen Forex -Handels mit unserem benutzerdefinierten MT4 -Indikator! Haben Sie sich jemals gefragt, wie Sie Erfolg auf dem Forex -Markt erzielen können und gleichzeitig Gewinne erzielen und gleichzeitig das Risiko minimieren können? Hier ist die Antwort, nach der Sie gesucht haben! Erlauben Sie uns, unseren proprietären MT4 -Indikator vorzustellen, der Ihren Handelsansatz revolutionieren wird. Einzigartige Vielseitigkeit Unser Indikator ist speziell
                              Currency Strength Wizard ist ein sehr leistungsstarker Indikator, der Ihnen eine Komplettlösung für erfolgreichen Handel bietet. Der Indikator berechnet die Stärke dieses oder jenes Forex-Paares anhand der Daten aller Währungen in mehreren Zeitrahmen. Diese Daten werden in Form von benutzerfreundlichen Währungsindizes und Währungsstärkelinien dargestellt, anhand derer Sie die Stärke dieser oder jener Währung erkennen können. Sie müssen lediglich den Indikator an das Diagramm anhängen, mit dem Si
                              Scalper Vault
                              Oleg Rodin
                              5 (27)
                              Scalper Vault ist ein professionelles Scalping-System, das Ihnen alles bietet, was Sie für erfolgreiches Scalping benötigen. Dieser Indikator ist ein komplettes Handelssystem, das von Forex- und Binäroptionshändlern verwendet werden kann. Der empfohlene Zeitrahmen ist M5. Das System liefert Ihnen genaue Pfeilsignale in Richtung des Trends. Es liefert Ihnen auch Top- und Bottom-Signale und Gann-Marktniveaus. Die Indikatoren bieten alle Arten von Warnungen, einschließlich PUSH-Benachrichtigungen.
                              Entry Points Pro
                              Yury Orlov
                              4.7 (224)
                              Dies ist ein Indikator für MT4, der genaue Signale für den Einstieg in einen Handel ohne Repainting (Neuzeichnen) liefert. Er kann auf alle Finanzwerte angewendet werden: Forex, Kryptowährungen, Metalle, Aktien, Indizes. Er liefert ziemlich genaue Schätzungen und sagt Ihnen, wann es am besten ist, eine Position zu eröffnen und zu schließen. Sehen Sie sich das Video (6:22) mit einem Beispiel für die Verarbeitung nur eines Signals an, das sich für den Indikator gelohnt hat! Die meisten Händler ver
                              Zunächst einmal ist es wichtig zu betonen, dass dieses Handelssystem ein Nicht-Repainting-, Nicht-Redrawing- und Nicht-Verzögerungsindikator ist, was es ideal für den professionellen Handel macht. Das "Smart Support and Resistance Trading System" ist ein fortschrittlicher Indikator, der für neue und erfahrene Trader entwickelt wurde. Es ermöglicht Tradern Präzision und Vertrauen auf dem Devisenmarkt. Dieses umfassende System kombiniert mehr als 7 Strategien, 10 Indikatoren und verschiedene Ha
                              TrendDecoder Premium
                              Christophe, Pa Trouillas
                              5 (2)
                              Identifizieren Sie Bereiche und die nächsten wahrscheinlichen Bewegungen   |  Erhalten Sie früheste Signale und die Stärke von Trends   |  Klare Ausstiegssignale vor Umkehrung   |  Erkennen Sie die Fibo-Levels, die der Kurs testen wird Indikator, der nicht zurückverfolgt, nicht verzögert - ideal für den manuellen und automatisierten Trading - geeignet für alle Vermögenswerte und Zeiteinheiten Zeitlich begrenztes Angebot   >> 50% OFF Nach dem Kauf,   bitte kontaktieren Sie mich auf diesem Kanal  
                              TakePropips Donchian Trend Pro
                              Eric John Pajarillaga Aldana
                              4.82 (17)
                              TakePropips Donchian Trend Pro   (MT4) ist ein leistungsstarkes und effektives Tool, das mithilfe des Donchian-Kanals automatisch die Richtung des Trends erkennt und Ihnen Handelssignale für den Ein- und Ausstieg liefert! Dieser Multifunktionsindikator umfasst einen Trendscanner, Handelssignale, ein statistisches Panel, einen Screener, Handelssitzungen und ein Dashboard für den Verlauf von Warnungen. Es wurde entwickelt, um Ihnen Handelssignale zu liefern und Ihnen Stunden beim Analysieren der C
                              Vorstellung des Zeus-Indikators: Ihr ultimatives Werkzeug für den Durchbruch zu profitablen Trades. Dieser Indikator vereinfacht das Trading, indem er die Notwendigkeit für eine tiefgreifende Analyse mit Ausbruchsstrategien beseitigt. Er zeichnet automatisch Zonen basierend auf Ihren voreingestellten Zeitrahmen und schlägt Stop-Loss (SL), Take-Profit (TP) und Trailing-Stop-Levels vor. Der Zeus-Indikator wird Sie umgehend benachrichtigen und Signalpfeile anzeigen, wenn der Preis die Kauf- oder Ve
                              Trend Forecasting
                              Mohamed Hassan
                              5 (11)
                              This indicator is unstoppable when combined with our other indicator called Katana . After purchase, send us a message and you could get Katana  for FREE as a BONUS!  You can also ask to join our private group where we discuss together with other members!  MT5 version: click here There are limited copies available at $45 (3 copies left). Next price is $99. Don't miss this great deal!  The Trend Forecasting indicator is a very unique & easy tool that is able to make prediction a
                              FX Volume
                              Daniel Stein
                              4.6 (35)
                              Erhalten Sie Ihr tägliches Marktupdate mit Details und Screenshots über unser Morning Briefing hier auf mql5 und auf Telegram ! FX Volume ist der ERSTE und EINZIGE Volumenindikator, der einen ECHTEN Einblick in die Marktstimmung aus Sicht eines Brokers bietet. Es bietet fantastische Einblicke in die Positionierung von institutionellen Marktteilnehmern, wie z.B. Brokern, auf dem Forex-Markt, viel schneller als COT-Berichte. Diese Informationen direkt auf Ihrem Chart zu sehen, ist der wahre Game
                              Shepherd Harmonic Pattern
                              Abdullah Alrai
                              4.68 (59)
                              Dieser Indikator erkennt harmonische Muster, die manuell oder automatisch auf dem Chart gezeichnet wurden. Sie können das Benutzerhandbuch unter diesem Link einsehen: Fügen Sie Ihre Bewertung hinzu und kontaktieren Sie uns, um es zu erhalten. Es gibt eine kostenlose Version, um dieses Produkt auf MT4 auszuprobieren. Sie können es verwenden, um Gartley- und Nenstar-Muster zu erkennen: https://www.mql5.com/en/market/product/30181 Sie können die vollständige MT4-Version von kaufen: https://www.mql5
                              Cycle Sniper
                              Elmira Memish
                              4.41 (34)
                              NEW YEAR SALE PRICE FOR LIMITED TIME!!! Please contact us after your purchase and we will send you the complimentary indicators to complete the system Cycle Sniper is not a holy grail but when you use it in a system which is explained in the videos, you will feel the difference. If you are not willing to focus on the charts designed with Cycle Sniper and other free tools we provide, we recommend not buying this indicator. We recommend watching the videos about the indiactor and system before pu
                              Weitere Produkte dieses Autors
                              True Direction Oscillator
                              Muhammad Elbermawi
                              4.89 (493)
                              Oder (TDO), ein Index, der die Preisänderungsrate nach dem Prinzip des „ Pure Momentum “ misst. Wenn ein Wertpapierkurs von 10 auf 15 steigt, beträgt die Preisänderungsrate 150%, aber wenn er von 15 auf 10 zurückgeht, beträgt die Preisänderungsrate nur 33,3%. Aus diesem Grund liefern Indikatoren der technischen Analyse wie "Price Rate of Change" (ROC) oder "Momentum" höhere Werte für aufsteigende Kursbewegungen als solche für absteigende. TDO behebt dieses Problem, um Händlern zu helfen, das Mo
                              Moving Average Cloud
                              Muhammad Elbermawi
                              4.93 (14)
                              Oder "MAC". Dies ist ein Indikator, der Ihnen helfen soll, den Trend zu erfassen und zu handeln. Die Idee hinter diesem Indikator lässt sich in den nächsten Schritten erklären: Zeichnen Sie eine sich schnell bewegende durchschnittliche Hüllkurve. Zeichnen Sie eine sich langsam bewegende durchschnittliche Hüllkurve. Das MAC Upper Band ist der höchste Wert zwischen den Höhen beider Hüllkurven. Das MAC Lower Band ist der niedrigste Wert zwischen den Tiefstwerten beider Hüllkurven. Die MAC Histog
                              Bermaui Bands
                              Muhammad Elbermawi
                              4.94 (89)
                              Bermaui Bands (BB) ist ein technisches Analysetool, das dabei hilft, zwischen Bereichs- und Trendkursbewegungen zu filtern. Die Idee hinter diesem Indikator lässt sich in den nächsten Schritten erklären: Berechnen Sie die Standardabweichung als Oszillator, der sich zwischen 0 und 100 bewegt. Ich nenne sie Bermaui-Abweichung in Prozent (BD %). Wenn "BD %" nahe Null ist, ist die Volatilität am höchsten. Außerdem ist die Volatilität sehr gering, wenn "BD %" nahe 100 liegt. Hohe Volatilität bedeutet
                              Bermaui Manual EA
                              Muhammad Elbermawi
                              5 (10)
                              Dies ist ein halbautomatischer Fachberater, der das Netzsystem handelt. Die Idee ist, nach und nach verschiedene Positionen im Markt einzunehmen und dann den Break-Even-Level für sie zu berechnen. Wenn die Kurse diesen Break-Even um eine vorbestimmte Distanz überschreiten, werden alle geöffneten Orders geschlossen. Wichtige Informationen Hier ist die Bedienungsanleitung:   https://www.mql5.com/de/blogs/post/730567 Sie können diesen EA mit jedem meiner anderen Produkte hier ausprobieren: http
                              Bermaui Deviation Percent
                              Muhammad Elbermawi
                              4.94 (129)
                              Oder (BD%), ein Volatilitätsindex, der die Volatilität in Prozent statt in Punkten misst. Die Idee von BD% besteht darin, einen Index in Abhängigkeit von der Classic Standard Deviation (CSD) zu erstellen, die sich zwischen 0 und 100 Prozent bewegt. Sie können BD% verwenden, um die Volatilität für dasselbe Wertpapier in verschiedenen Zeiträumen oder Zeitrahmen zu vergleichen. Darüber hinaus können Sie BD% verwenden, um die Volatilität zwischen verschiedenen Wertpapieren in verschiedenen Märkte
                              MASR Bands
                              Muhammad Elbermawi
                              5 (10)
                              Oder M Oving A verage S upport R eständigkeit Bands. Der MASR-Bänder-Indikator ist ein gleitender Durchschnitt, der von zwei Bändern umgeben ist, die als Unterstützungs- und Widerstandsniveaus zusammenarbeiten. Statistisch enthalten MASR-Bänder in 93% der Fälle Preiskerzen. So wird es in Schritten berechnet: 1. Der erste Schritt besteht darin, das höchste Hoch (HHV) und das niedrigste Tief (LLV) für einen Zeitraum von X zu berechnen. 2. Der zweite Schritt besteht darin, HHV durch LLV zu
                              Classic Keltner Channel
                              Muhammad Elbermawi
                              4.9 (40)
                              Oder CKC. Dieser Indikator funktioniert in Abhängigkeit von der klassischen Zehn-Tage-Regel des gleitenden Durchschnitts, die von Chester W. Keltner (1909–1998) beschrieben wurde. Alle Parameter sind standardmäßig auf die klassische Version des Keltner-Systems eingestellt, während der Benutzer sie nach Belieben ändern kann. Wichtige Informationen CKC-Handbuch lesen: https://www.mql5.com/en/blogs/post/736577 CKC Expert Advisor Beispiel: https://www.mql5.com/en/blogs/post/734150 Über die Keltn
                              Bermaui Pin Bars
                              Muhammad Elbermawi
                              5 (22)
                              Bermaui Pin Bars Oder (BPB) ist ein Indikator, der das Preisaktionsmuster von Pin Bars auf dem Chart findet. Pin Bars ist eine Abkürzung für "Pinocchio Bars", eine klassische Balkenmuster-Alternative zu japanischen Kerzenhaltern mit hohen oberen oder unteren Schatten und sehr kleinen Körpern wie Hammer, Inverted-Hammer, Hanging Man, Shooting Star, Dragon Fly Doji oder Grave Stone Doji . Bermaui Pin Bars Indikator findet dieses Muster abhängig von einer Formel, die in den nächsten Schritten er
                              BACD Cloud
                              Muhammad Elbermawi
                              4.57 (7)
                              Oder B ermaui A verage C onvergence D ivergence Cloud , ein Oszillator, der die Trendrichtung anzeigt und seine Stärke in Prozent misst. Die Berechnung der BACD Cloud sieht wie folgt aus: 1- Berechnen Sie zwei exponentiell gleitende Durchschnitte. Einer von ihnen ist schneller als der andere. Ich werde die erste (schnell) und die zweite (langsam) anrufen 2- Finden Sie das Zentrum zwischen ihnen, wobei: Center MA = (Fast + Slow) / 2 3- Berechnen Sie die BACD-Linie wie folgt: BACD = 100 * (F
                              Bermaui Channel
                              Muhammad Elbermawi
                              5 (27)
                              This is a price channel that shows five important price levels on the chart. Those levels are: 1. The Highest High (HH) of the previous x bars. 2. The Highest Low (HL) of the previous x bars. 3. The Center Line. 4. The Lowest High (LH) of the previous x bars. 5. The Lowest Low (LL) of the previous x bars. How does Bermaui Channels Captures Overbought  area Think of the distance between HH and HL levels as an overbought area. When the price candles or bars crosses the HL to the upside this
                              Bermaui RSI Candles
                              Muhammad Elbermawi
                              5 (7)
                              Die Idee dieses Indikators besteht darin, den RSI in Form von Kerzen zu zeichnen, die mit Preischarts verglichen werden können, um Kauf- und Verkaufssignale zu generieren. Der Indikator ist nicht meine Erfindung. Ich habe es vor einigen Jahren im Internet gegründet. Ich habe den Code aktualisiert, Warnfunktionen hinzugefügt und die Bermaui Utilities-Toolgruppe hinzugefügt. Der Indikator berechnet den RSI aller Kurse, die zum Zeichnen von Kerzen verwendet werden (RSI des Eröffnungs-, Hoch-, Tie
                              Horus EA
                              Muhammad Elbermawi
                              3.67 (3)
                              Horus EA für MT4 Vor Tausenden von Jahren erfanden die alten Ägypter ein Zählsystem, mit dem sie ihr Land vermessen und ihre Waren gewogen haben. Dieses System wurde als „ Auge des Horus “ bezeichnet. Das Auge des Horus wurde mit dem Mythos des Gottes Osiris in Verbindung gebracht und wurde zu einem der heiligen Symbole der Pharaonen. Ich habe die mathematischen Gleichungen im Auge des Horus mit der Fibonacci-Folge verwendet, um ein Geldverwaltungssystem mit negativer Progression zu bauen, da
                              Auswahl:
                              Hisham Ghoneim
                              301
                              Hisham Ghoneim 2021.09.22 09:39 
                               

                              I already purchase the full set EA + BD% +DBD% as i' satisfied with Elbermawi trading tool and this is not my first time dealing with his great trading tools, it is really helpful for good trading results.

                              Muhammad Elbermawi
                              52239
                              Antwort vom Entwickler Muhammad Elbermawi 2021.09.22 10:32
                              Thanks a lot for the review and stars. I appreciate it . 🙏💚
                              Paulina Andrea Madariaga Figueroa
                              4107
                               

                              Very good indicator, I have spent money in another indicators and with Bermaui tools I have everything.

                              digger55
                              237
                              digger55 2020.01.15 18:08 
                               

                              Good and professional tool.

                              Eng Yoon Lee
                              1294
                              Eng Yoon Lee 2019.12.19 12:23 
                               

                              this is the best indicator. very robust and safe. i LOVE IT

                              aw1977
                              279
                              aw1977 2019.12.11 01:50 
                               

                              Another high quality product from Muhammad....I think there is none similar to this outside. If you never use Muhammad's product before, try this one. There is full function demo which limited to EU/H1.

                              neongreen
                              466
                              neongreen 2019.10.21 14:47 
                               

                              This is my third indicator that I have bought from Muhammad and like his other indicators they are very useful. His support has been fantastic and fast. Two thumbs up!!

                              muna111
                              544
                              muna111 2019.09.17 04:32 
                               

                              Very help ful indicator and a must tool for trading. Thanks a lot Mohammad for such a great indicator .

                              Roberto Cesar Ruarte Pedraza
                              702
                              Roberto Cesar Ruarte Pedraza 2019.08.20 04:45 
                               

                              really good for scalping

                              Evgeniy Vizhevitov
                              219
                              Evgeniy Vizhevitov 2019.08.10 14:44 
                               

                              As an additional filter to Your strategy it is very good!!!

                              Christof Schoneweg
                              124
                              Christof Schoneweg 2019.05.15 19:57 
                               

                              Sehr gute Idee, starker Indikator!

                              Frank Paetsch
                              6872
                              Frank Paetsch 2019.05.14 18:51 
                               

                              Sehr starker Indikator, vielen Dank!

                              keltonactis
                              1052
                              keltonactis 2019.05.13 01:55 
                               

                              Promissing. Good work!

                              IK°L
                              765
                              IK°L 2019.05.04 22:21 
                               

                              This indicator is a very useful tool, the signals are very precise although in periods of low volatility it is necessary to interpret them if you intend to operate exclusively with it. You will also find a lot of value when it is used to confirm a signal to support any operative or system of your own. The author always listens his clients and you can always count with his support.

                              Adil
                              456
                              Adil 2019.04.10 15:48 
                               

                              Der Benutzer hat keinen Kommentar hinterlassen

                              Antwort auf eine Rezension
                              Version 4.0 2019.12.08
                              1. Added a Background to the panel at the right corner of the indicator.
                              2. Added a unique prefix/suffix for all objects drawn by the indicator.
                              3. Made a revision for the code to make sure that there is no logical errors.

                              Note:
                              1. I didn't change DBD% calculations. It is the same.
                              2. Parameters are the same.
                              Version 3.0 2019.10.15
                              1- The indicator main tapes shape are now as histogram rather than the old version that was in dots. This makes it look better.
                              2- The high is restricted, to make it look like a tape.
                              3- I added "Bermaui Utilities Lite", which is four tools that you will help the user to analyze his chart much better, determine his take profits and stop losses.
                              4- Now you can switch easily between pairs or time-frames.
                              5- You can draw standard deviation channels that show overbought and oversold levels clearly.
                              6- You can draw rounded numbers grid to analyze support and resistance psychological levels.
                              7- You can draw supply and demand levels.
                              8- You can show or hide Bermaui Utilities Buttons by clicking on Shift + A / D.
                              9- You can switch between four beautiful and well-designed Color Lists. Or you can use your own color list by choosing the (Do Nothing) choice.
                              10- You can send Mobile Notification or emails and if anything gets wrong you will receive a note in the terminal's journal.
                              11- Indicator objects now change their size depending on screen resolution.
                              Version 2.1 2019.07.20
                              1. Added and Icon to the interface.
                              2. Added a description for the important buffers to the interface.
                              Version 2.0 2019.07.18
                              Welcome to Dual Bermaui Deviation Percent version 2.0 (DBD% v2.0)

                              In this version I worked to enhance the built-in function of the indicator by using a moving average as a filter.

                              1// Buy signals will be triggered if Fast BD% is greater than slow BD% and also fast SMA is greater that slow SMA.
                              2// Sell signals will be triggered if Fast BD% is smaller than slow BD% and also fast SMA is smaller that slow SMA.

                              This will reduce the number of false signals to increase the quality.