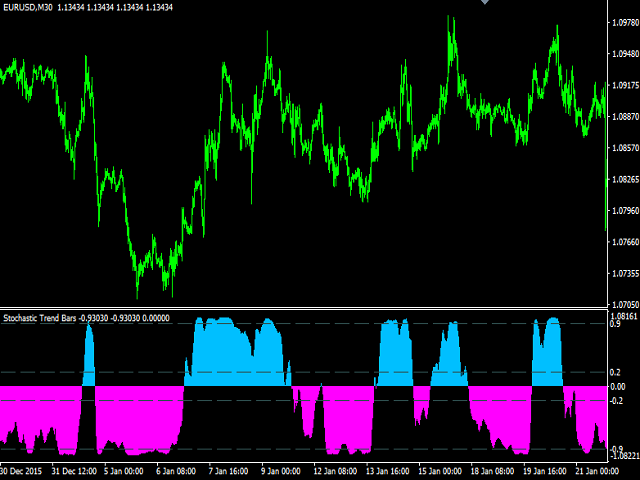
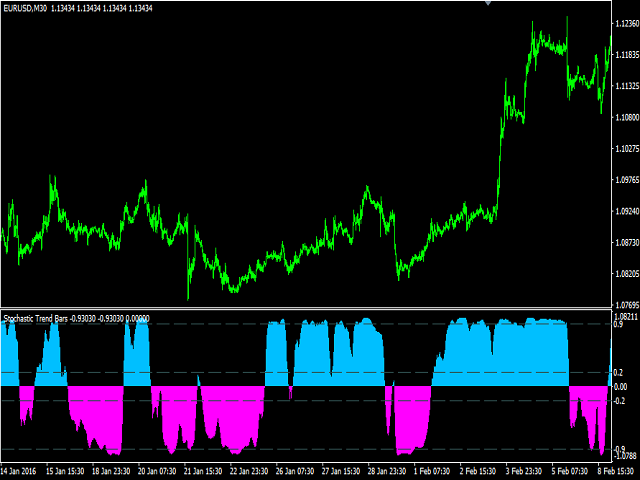
Stochastic Trend Bars
- Indikatoren
- Harun Celik
- Version: 1.0
- Aktivierungen: 20
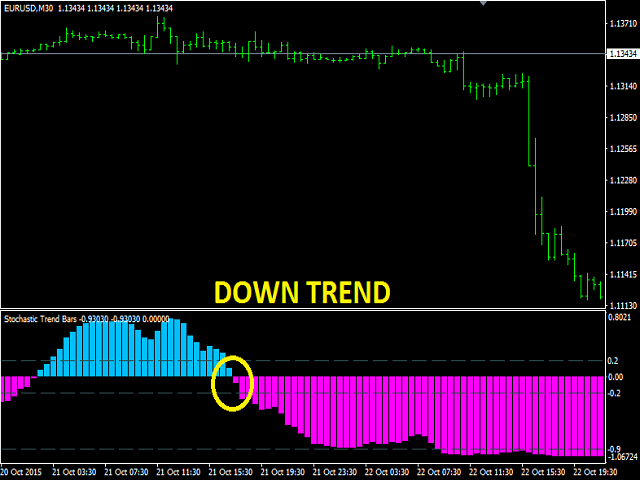
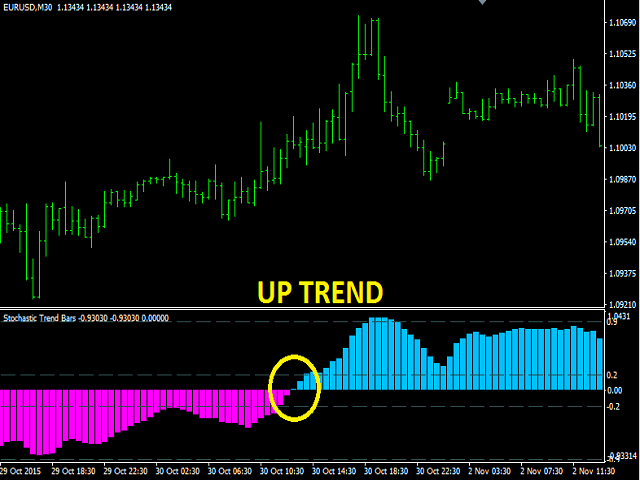
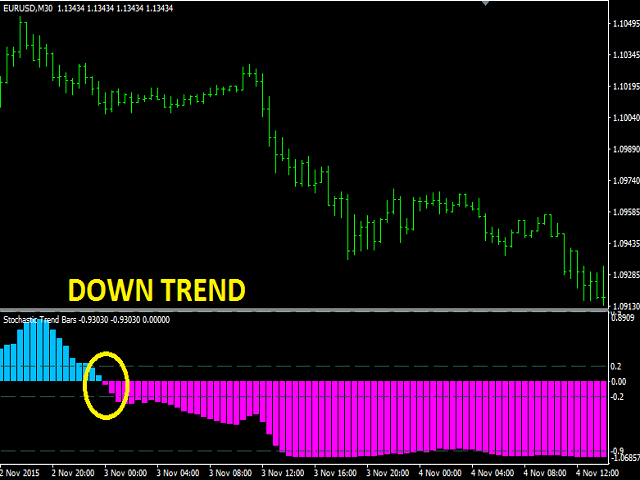
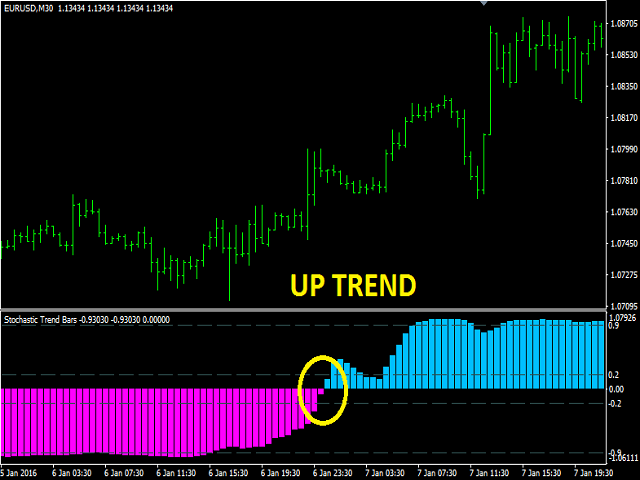
Stochastic Trend Bars indicator is the modified version of the standard stochastic indicator. This indicator is different from the standard stochastic indicator and turned into a trend bars indicator. Added visibility to understand trends. Easy to use and simple. The user will easily detect trends.
You can use this indicator as a trend indicator on its own. Or as a trend filter along with other strategically relevant indicators. Easy to use and simple to understand trends.
Suggestions and Features
- This indicator is a trend finding tool.
- There are level lines on the indicator.
- These lines are 0.2, 0.9, -0.2, -0.9 lines
- The 0.2 and -0.2 lines are trend-confirming lines.
- The trend start calculation should be considered according to the lines 0.0 and -0.2.
- The 0.9 and -0.9 lines help to make sense of the trend fatigue state.
- For example, if the trend starts to fall below 0.9 and below 0.9, the trend should be interpreted as reversible.
- You can use it in all time frames.
- You can use it in all pairs.
Parameter
- StochPeriod - standard stochastic period setting. You should make this setting high to find bigger trends.