PZ Swing Trading
- Indikatoren
- PZ TRADING SLU
- Version: 6.2
- Aktualisiert: 27 April 2021
- Aktivierungen: 20
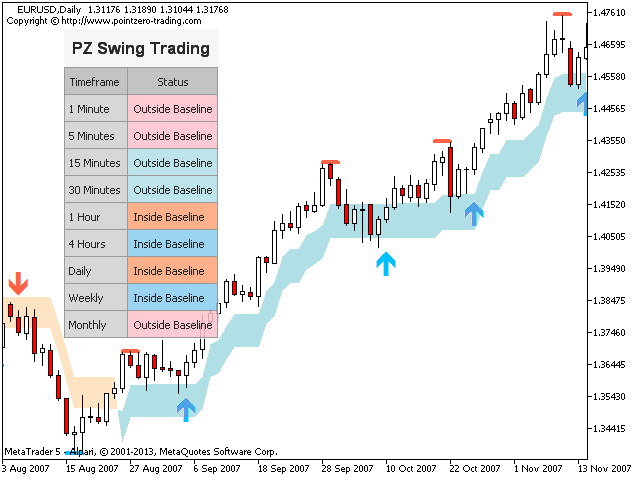
Swing Trading ist der erste Indikator, der Schwankungen in Trendrichtung und mögliche Umkehrschwankungen erkennt. Es wird der in der Handelsliteratur weit verbreitete Baseline-Swing-Trading-Ansatz verwendet. Der Indikator untersucht mehrere Preis- und Zeitvektoren, um die aggregierte Trendrichtung zu verfolgen und erkennt Situationen, in denen der Markt überverkauft oder überkauft ist und zur Korrektur bereit ist.
[ Installationsanleitung
| Update-Anleitung
| Fehlerbehebung
| FAQ
| Alle
Produkte ]
- Profitieren Sie von Marktschwankungen, ohne ins Wanken zu geraten
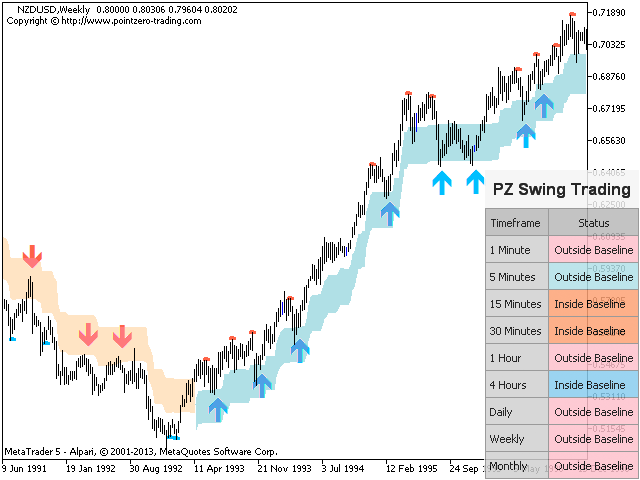
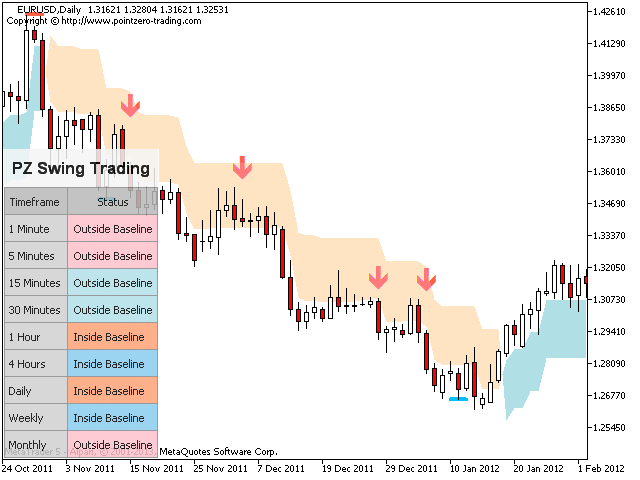
- Der Indikator zeigt jederzeit die Trendrichtung an
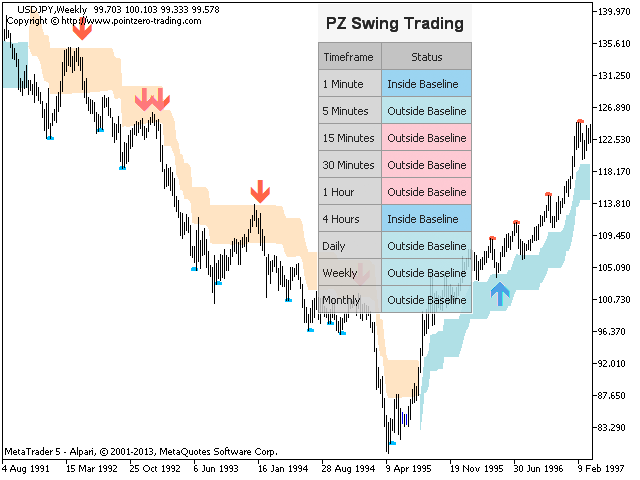
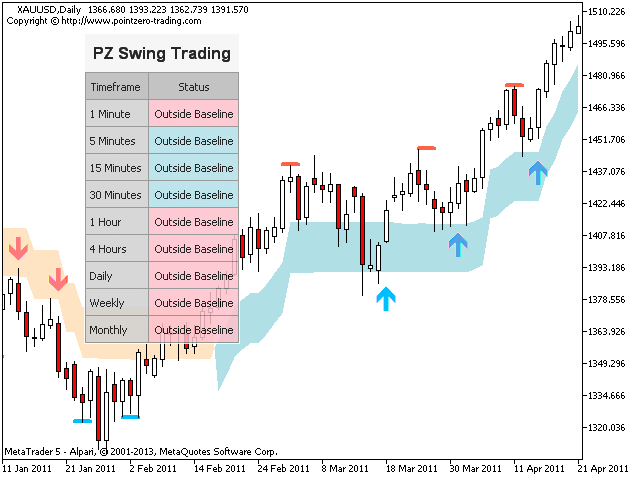
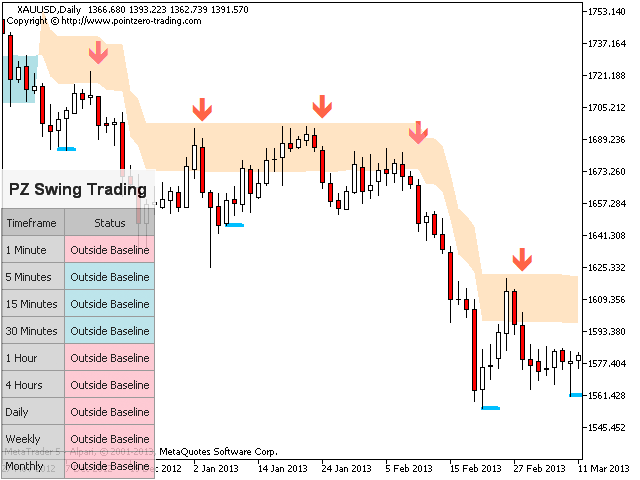
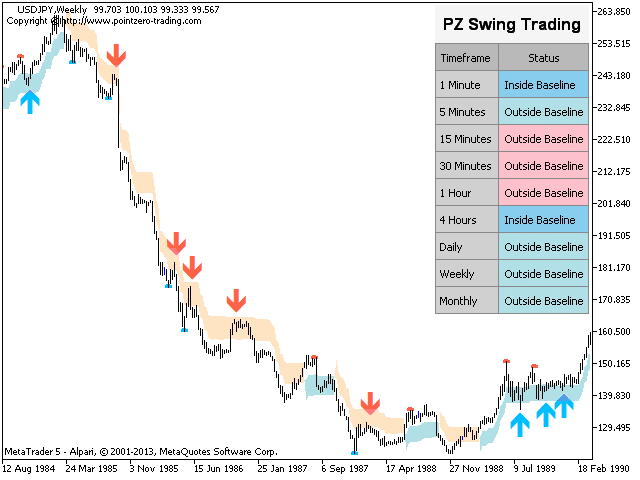
- Ein farbiges Preisband repräsentiert die Opportunity-Grundlinie
- Farbige Striche stehen für mögliche Umkehrschwingungen
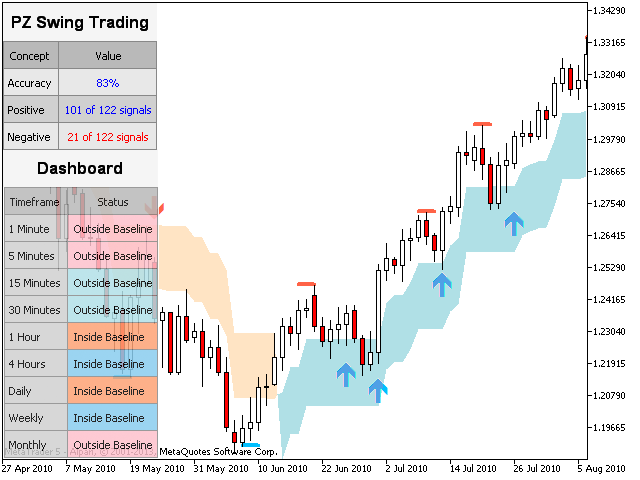
- Der Indikator analysiert seine eigene Qualität und Leistung
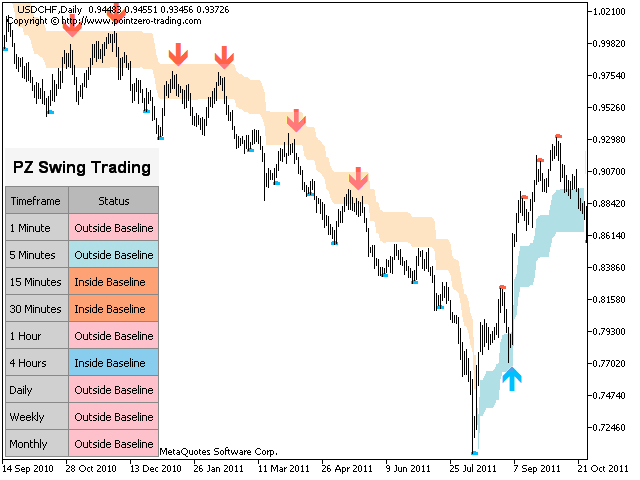
- Es implementiert ein Dashboard mit mehreren Zeitrahmen
- Anpassbare Trend- und Swingperioden
- Es implementiert E-Mail / Sound / Push-Warnungen
- Der Indikator ist nicht neu lackiert oder hinterlackiert
Was ist Swing Trading?
Swing Trading ist ein Handelsstil, der versucht, Gewinne in einem Wertpapier innerhalb eines Tages bis zu einer Woche zu erfassen, obwohl einige Trades möglicherweise länger am Leben bleiben können. Swingtrader kaufen mithilfe technischer Analysen Schwäche und verkaufen Stärke und haben die Geduld, auf diese Gelegenheiten zu warten, da es sinnvoller ist, nach einer Verkaufswelle ein Wertpapier zu kaufen, als in einen Ausverkauf zu geraten
Eingabeparameter
- Trendperiode - Dieser Parameter steuert die Empfindlichkeit für Trendänderungen. Eine große Trendperiode führt dazu, dass längere Trends erfasst werden. Eine kleine Trendperiode führt dazu, dass kürzere Trends erfasst werden, aber Trendänderungen schneller erkannt werden.
- Basiszeitraum - Dieser Parameter steuert die Empfindlichkeit der Basislinie. Der Zeitraum für die Basislinie sollte immer unter dem Trendzeitraum liegen. Erhöhen Sie es, um mit einem größeren Opportunity-Band zu handeln, und verringern Sie es, um es kleiner zu machen.
- Swing-Signale anzeigen - Aktivieren Sie diesen Parameter, um Pfeile anzuzeigen, wenn der Kurs zur Basislinie zurückkehrt und aus dieser ausbricht.
- Anzeigekorrekturen - Aktivieren Sie diesen Parameter, um farbige Striche anzuzeigen, wenn der Trend zu korrigieren beginnt.
- Dashboard anzeigen - Aktivieren Sie diesen Parameter, um das Dashboard für mehrere Zeiträume im Diagramm anzuzeigen.
- Statistiken anzeigen - Aktivieren Sie diesen Parameter, um das Statistik-Dashboard im Diagramm anzuzeigen.
- Zeichnungseinstellungen - Wählen Sie Ihre eigenen Farben und Größen für Pfeile und Umkehrstriche.
- Alarme - Aktiviert Anzeige- / E-Mail- / Push- / Tonalarme für Muster.
Autor
Arturo López Pérez, privater Investor und Spekulant, Softwareentwickler und Gründer von Point Zero Trading Solutions.


good work