• Übersicht
  • Bewertungen
  • Diskussion (18)
  • Neue Funktionen

Price Action Band

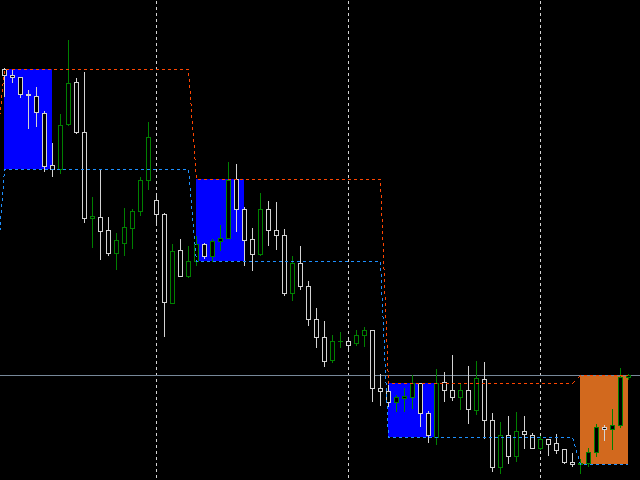
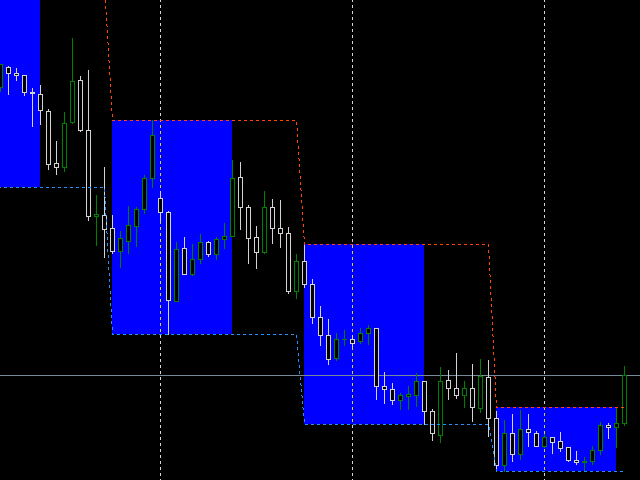
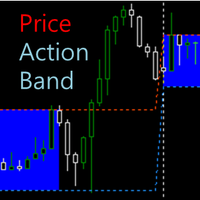
The indicator displays high and low Price Band computed from the period of time.

It also contains Price Box based on the both prices.

You can measure the box channel in a day by this Price Box and can observe the Price Action in the extended area of the Price Band.

Your trading decision will be concluded via watching the Price Action in the Band.


How To Use

There are two major external variables, BandSTime and BandETime.

This means the start time and the end time respectively to calculate the Price Band.

And the indicator measures the highest/lowest price within this period of time.

You can designate the time like this:

  • "0000", "1200"
  • "1045", "20" (= "1045", "2000")
  • "5", "17" (= "0500", "1700")
  • "0", "0" (= "0000"(yesterday), "0000"(today))
  • "20", "10" (= "2000"(yesterday), "1000"(today))

To use the time format as "1045", the timeframe of a chart should be M1 or M5 or M15.

If the BandSTime and BandETime are "5" and "12" (or "0500", "1200"), this means that the Price Band is determined from 05:00:00 to 11:59:59.

The BandETime itself is not included in the examine period.

The last two time formats are very interesting!

If you set the BoxSTime as greater or equal to BoxETime, BoxSTime is converted to the time of yesterday.

The "yesterday" is calculated based on trading day and the loss of bar or weekend gap is moderately considered.

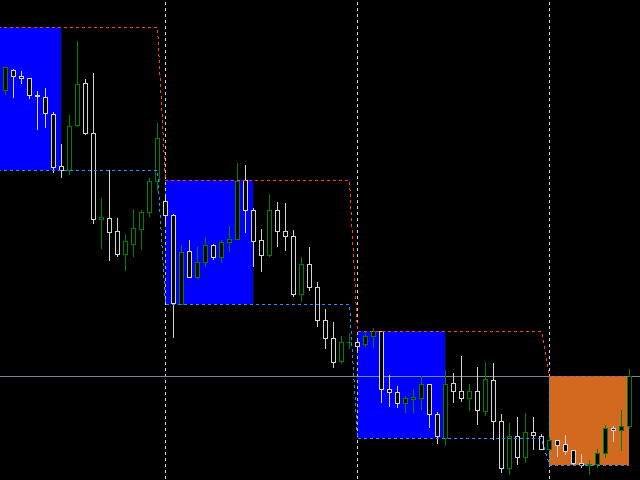
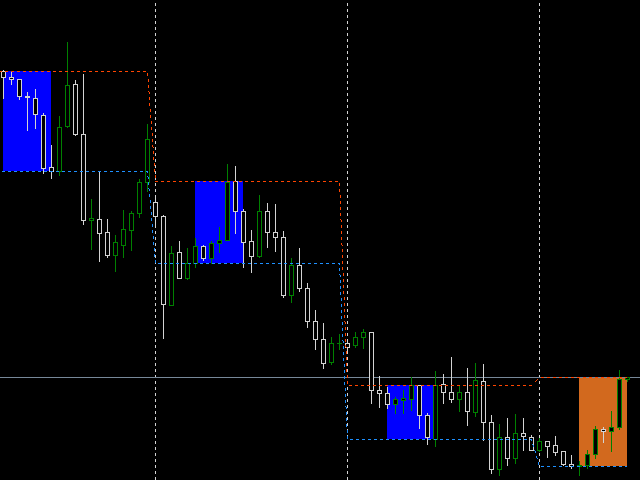
The Price Box has two colors, one for the past bars and the other for the current bars.

If the current time is greater or equal to BoxSTime and less than BoxETime, the values of the Price Band and Price Box are adjusted correctly.

This is an indicator for day trading using box range. Set the range of time according to your favorite. It can be set within the Asia or Europe or New York session time or any period of time from any hour to any one. The minutes part is dependent on the time frame of a chart.

For example, you can set the BandSTime and BandETime to Asia and Europe session time (approximately "0000" ~ "0700" or "0" ~ "7", server time) and watch the action(moving) of the price within that period of time, then can decide to enter position expecting the direction at the New York session time.

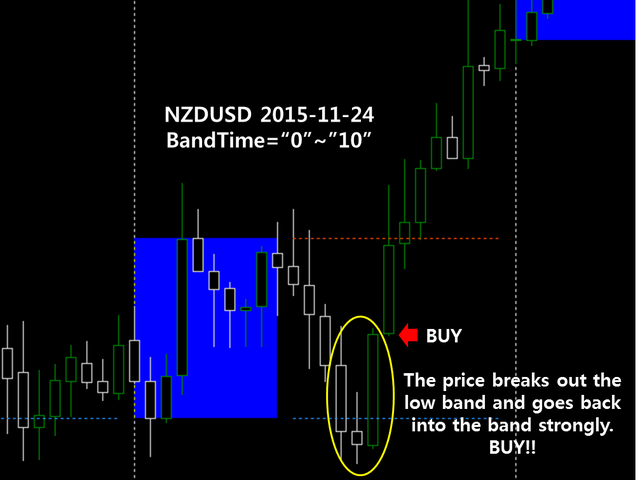
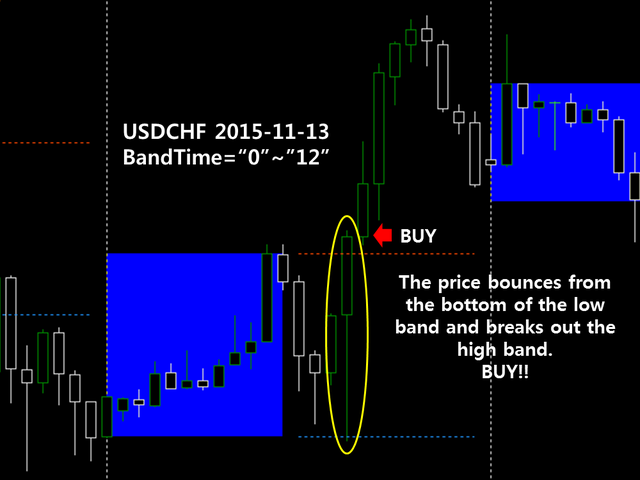
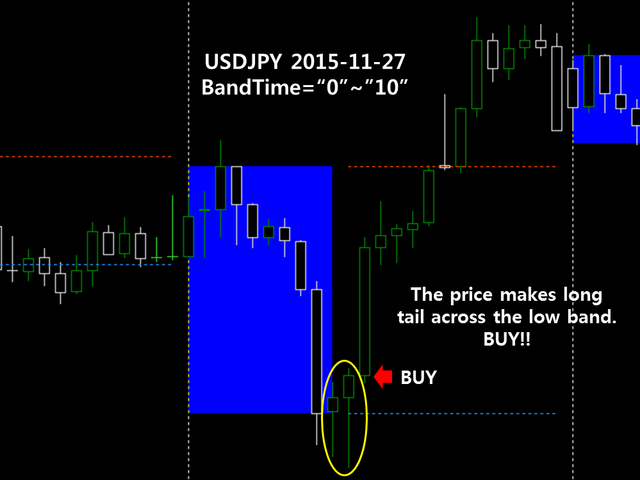
This indicator helps you to figure out the price moving within the box range or after the range showing whether the price will

  • bounces at the band line
  • breaks out the band line (include rolling back to the band line and bouncing again or breaking back the line)
  • be locked in the box range

The Price Box (blue rectangle) is the box range reflecting the time period you set. See the price action in the Box and Band Line following the Box. You can get a hint.

Test it first using the strategy tester and you can find that this indicator is tested in all possible circumstances that can cause an error:

  • with past bars or current bars
  • absence of some bars in a week or between weeks
  • every tick or open price only
  • forward or reverse time designation

and this indicator:

  • jumps over the unnecessary calculation
  • adjusts already-calculated values when the current value records new high or low one


Inputs

Mandatory:

  • BandSTime: Start time to calculate the Price Band ("0000")
  • BandETime: End time to calculate the Price Band ("1200")

Optional:

  • TakePrice: Price taken to calculate the Price Band (Open_Close, Hi_Low)
  • ShowLine: Shows the Price Band (true)
  • SeamlessLine: Shows all parts of the Price Band (true)
  • DailyLine: Keep constant value of the Price Band in a day (true. No effect when SeamlessLine=false or BandSTime>=BandETime)
  • LineStyle: Line style of the Price Band (STYLE_DOT)
  • ShowBox: Shows the Price Box (true)
  • FilledBox: Fill the Price Box (true)
  • BoxStyle: Line style of the Price Box (STYLE_DOT)
  • BoxColorBeforeETime: Color of the Price Box for the current bars (Chocolate)
  • BoxColorAfterETime: Color of the Price Box for the past bars (Blue)

I launched a signal using my own time pattern with this indicator.

Go to "Signals - MetaTrader 4" and click "Filter" (at the right end of the page) and type "Time Pattern" and then press Enter. You will find it.
Empfohlene Produkte
The indicator allows you to trade binary options. The recommended time frame is М1 and the expiration time is 1,2,3 minutes. The indicator suitable for auto and manual trading. A possible signal is specified as a arrows above/under a candle. You should wait until the candle closes! Arrows are not re-painted Trade sessions: TOKYO section (Half-end) Currency pairs: USD/JPY Working time frame: M1 Expiration time: 1,2,3 minutes. The indicator also shows good results when using the martingale strateg
FREE
It is an oscillator with a filter by levels of support and maintenance this tool is designed for binary options it is very easy to use Has very good indicators of correct transactions 80-90% (this is the basis for the cost) Signals Red arrow directed downward signal to decrease Arrow of blue color directed upwards signal for an increase Recommended operating time: 1-2 candles Any: timeframe Trade Symbol: Any Session: Any It is not recommended to trade during the news release, the percentage of c
1 338 USD
Limitless MT4
Dmitriy Kashevich
Limitless MT4 ist ein universeller Indikator, der für jeden Anfänger und erfahrenen Trader geeignet ist. funktioniert auf allen Währungspaaren, Kryptowährungen, Rohstoffen Limitless MT4 - bereits konfiguriert und erfordert keine zusätzliche Konfiguration Und jetzt die Hauptsache Warum grenzenloses MT4? 1 völliger Mangel an Neuzeichnung 2 zwei Jahre Test durch die besten Handelsspezialisten 3 Die Genauigkeit der korrekten Signale übersteigt 80% 4 schnitten während der Pressemitte
1 399 USD
Forex Gump
Andrey Kozak
2.83 (6)
Forex Gump is a fully finished semi-automatic trading system. In the form of arrows, signals are displayed on the screen for opening and closing deals. All you need is to follow the instructions of the indicator. When the indicator shows a blue arrow, you need to open a buy order. When the indicator shows a red arrow, you need to open a sell order. Close orders when the indicator draws a yellow cross. In order to get the most effective result, we recommend using the timeframes H1, H4, D1. There
147 USD
LordAutoFibonnaci
Igor Pereira Calil
Lord Auto Fibonnaci is a free indicator for Meta Trader, in order to show the most famous chart in the financial market known as "Fibonnaci". As we can see in the images below, the fibonnaci table will automatically analyze the graph for you, with trend factors through percentage, almost infallible use, you can always work when the percentage is low or high, start shopping and sales on time, great for analyzing entries! In the images below we can see an example in gold in H4, where we are a
FREE
5 signal in 1  Product     TimeFrame   Recommend   1m-5m recommend  signal   TF  5m    Banks Pro Binary Option is Indicator for binary option Can Use Manaul Trade or Robot on Platform  Mt2Trading  https://www.mt2trading.com/?ref=104    Time Trading   good work  EU session    Recommend  Curency   EUR  GBP USD        careful   AUD JPY      Recommend  Martingale 2-5 Step   Recommend  set profit  2%-5%/Day Setting Brake  News Event High volatility   recommend  15-30 min Have Problem Contract
120 USD
Indicator for binary options arrow is easy to use and does not require configuration works on all currency pairs, cryptocurrencies buy signal blue up arrow sell signal red down arrow tips do not trade during news and 15-30 minutes before their release, as the market is too volatile and there is a lot of noise it is worth entering trades one or two candles from the current period (recommended for 1 candle) timeframe up to m 15 recommended money management fixed lot or fixed percentage of the depo
100 USD
Email Drawdown Alert
Roman Starostin
5 (14)
Free informative Indicator-helper. It'll be usefull for traders who trade many symbols or using grid systems (Averaging or Martingale). Indicator counts drawdown as percent and currency separate. It has a number of settings: Count deposite drawdown according equity value and send e-mail or notifications to user if DD more than set; Sending e-mail when max open orders reached; Shows price and remaining pips amount before MarginCall on current chart and Account generally; Display summary trade lot
FREE
Smart Gread Ultimate Edition (SGUL) indicator - based on smart order grid strategy. Maximum customization and flexibility of strategies are the main features of this indicator. In the right corner there is a table with the number and volume of orders. List of adjustable parameters: K: 2.0 - Factor of the next order increase (if the price moves in the other direction). TP: 50 - The number of points at which the order is closed with a profit (minimum profit per 1 lot). Step: 80 -
500 USD
NeverScalping
Yeun Jung Hwan
NeveScalping is a Scalping Trading and Intraday Trading. NeverScalping uses predictions and predictions using artificial intelligence algorithms. In this way, the professional higher law has lost its luck. EURUSD does a practical, historically important job. Download the demo yourself. My tests were 90 days of accuracy, actual spread, extra slip and high visibility date of actual ticks. The recommendations are as follows optimized   for the   EUR / USD's D1 chart.   There are no other com
300 USD
GTAS FibTdi
Riviera Systems
3.2 (5)
GTAS FidTdi is a trend indicator using combination of volatility and potential retracement levels. This indicator was created by Bernard Prats Desclaux, proprietary trader and ex-hedge fund manager, founder of E-Winvest. Description The indicator is represented as a red or green envelope above or under prices. How to use Trend detecting When the envelope is green, the trend is bullish. When it is red, the trend is bearish. Trading Once a trade is opened, GTAS FibTdi shows retracement zones
FREE
Thunder Scalper Pr
Mr Fares Mohammad Alabdali
Buy and Sell Targets Indicator You can see the buying and selling goals in the box and they are inevitably achieved.      It consists of three lines: the first green color sets buying targets, the second red color sets selling targets, and the third blue color is the average price.      There are two ways to enter -      Method 1: The entry point when the average price with a long candle is broken from below and staying above the blue line with a green candle is considered a buy      When the av
30 000 USD
Infinity Trend Pro
Yaroslav Varankin
1 (1)
This is a trend indicator without redrawing Developed instead of the binary options strategy (by the color of the Martingale candlestick) Also works well in forex trading When to open trades (binary options) A signal will appear in the place with a candle signaling the current candle It is recommended to open a deal for one candle of the current timeframe M1 and M5 When a blue dot appears, open a deal up When a red dot appears, open a trade down. How to open trades on Forex. When a signal is rec
1 000 USD
Witch Hat for Binary Options is an indicator for binary options based on analysis of Bollinger Bands and RSI, using a modulated strategy with indicator settings using complex filters. This indicator never repaints, it has an almost accurate answer for you to make the entries. There are two ways for you to analyze your entry, when an arrow appears you have more than 90% chance of hits, and the other way is the lines that it automatically draws and its trend line. It has surprisingly strong s
900 USD
WORLD'S FIRST AUTO SCALED GANN PERCENTAGES CHANEL AND GANN GRID                                                                     W.D. Gann Grid With auto Scale & Percentage Change.. Gann Grid is unique concept to finding major turning points  and Support/resistance level Our tools has additional feature for Scale point input method and price percentage method to use any stock and commodities charts scale. Normally people are using fix grid for a
300 USD
SuperTrend Alerts
Libertas LLC
3 (4)
SuperTrend Alerts adds alerts to the widely popular SuperTrend indicator. As the name suggests, SuperTrend is a trending indicator which works best in trendy (not choppy) markets. SuperTrend is extremely popular for intraday and daily trading, and can be used on any timeframe. Place a call when the price closes above the SuperTrend line, and place a put when the price closes below the SuperTrend line. These crossovers are highlighted by non-repainting up/down arrows. Alerts Email, message and
30 USD
Accuracy of correct predictions 83%! This indicator was tested on the basis of real statistics for all market indicators according to indicators for 3 months of trading. 83% of correct trade forecasts for usd / jpy on the m30 time frame were received on our statistics! if you have any questions, please contact us in private messages or in discussions under this indicator and we will figure it out and help any questions will arise personal messages or in discussions under this indicator As soon
100 USD
The principle of this indicator is very simple: detecting the trend with Moving Average, then monitoring the return point of graph by using the crossing of Stochastic Oscillator and finally predicting BUY and SELL signal with arrows, alerts and notifications. The parameters are fixed and automatically calculated on each time frame. Example: If you install indicator on EURUSD, timeframe M5: the indicator will detect the main trend with the Moving Average on this timeframe (for example the Moving
135 USD
Trend PA
Mikhail Nazarenko
5 (2)
The Trend PA indicator uses   Price Action   and its own filtering algorithm to determine the trend. This approach helps to accurately determine entry points and the current trend on any timeframe. The indicator uses its own algorithm for analyzing price changes and Price Action. Which gives you the advantage of recognizing, without delay, a new nascent trend with fewer false positives. Trend filtering conditions can be selected in the settings individually for your trading style. The indicator
55 USD
Gvs Undefeated Trend   indicator is designed for trend and signal trading. This indicator generates trend signals.  It uses many algorithms and indicators to generate this signal. It tries to generate a signal from the points with the highest trend potential. This indicator is a complete trading product. This indicator does not need any additional indicators.  You can only trade with this indicator. The generated signals are displayed on the graphical screen.  Thanks to the alert features you ca
50 USD
Two Candles to Glory
Ellan Dirgantara Tholkhah
This is a Binary Options signal indicator. Extremely powerful for the 1 min chart. The signals are based on my personal tweak (based on real trial and error & backtested) of the RSI, ADX and Ichimoku and my observation on how price moves. It turns out, 2 candles expiry is the most consistent with this set up. How to use: 1. Wait for arrow signal to show. 2. Place a 2 candle expiry right after the close of the signal candle. So if you are trading a 1 min chart, place an expiry for 2 mins... if yo
300 USD
Interactive BB Matrix
Tsvetan Tsvetanov
2 (1)
This indicator displays Bollinger Bands signals for multiple symbols and multiple time frames. The signals are created as a simple ratios which represent the distance between the current price and the moving average measured in standard deviations. This way we create a very versatile and easy to use indicator which helps us to identify not only the strongest trends but also the most overbought and oversold conditions. Features Accurate signals in real time for multiple time frames and multiple
48 USD
The indicator is designed for trading binary options on small timeframes up to 15 m Easy to use does not need additional settings and can be used without additional filters Recommendations for trading When a signal appears (blue arrows pointing up), you need to consider the buy direction When a signal appears (the red line indicates the bottom), you need to consider the direction to sell To conclude a deal is on the candle where the signal for one candle came, if the signal turned out to be unpr
100 USD
MACD Color for GOLD
Chitipat Changsamrit
MACD Color for GOLD  Use for looking moving-way of graph and checking will be buy or sell  Easy for looking by see the color of trand. Red is down / Blue is up.  Can to use it with every time-frame by 1. Long Trade : Use it with time-frame H1 /  H4 /  Daily  2.Short Trade : Use it with  time-frame  M5 / M15  / M 30 /  H1 and you can see when you will open or close the orders by see this indicator by well by see signal line cut with color line again in opposite. and you can use this indicator for
48 USD
This indicator is designed for binary options trading. This indicator contains Moving Average calculation methods that have been transformed into an arrow to identify potential buy and sell signals on trading charts. The program also includes additional features such as indicator display and sound notifications. To obtain a perfect signal, you can combine this signal with the DOT signal for free :  https://www.mql5.com/en/market/product/90490 To use this indicator, simply follow these steps:
80 USD
This Dashboard is free to download but is dependent on you owning the Flag Trend Pro  MT4  indicator.  Down load the indicator:  Flag Trend Pro  The   Dashboard      will show you on a single chart all the timeframes (M1 to Monthly) with their own status for the indicator: Gold Pro MT4   all time frame and all symbol:  smart algorithm detects the trend, filters out market noise and gives entry signals!!! How to understand the status: symbol -  Fill All the Pair what you want. M1, M5, M1
FREE
Quantum Currency Array Indicator
QUANTUM TRADING SOFTWARE LIMITED
This indicator has been developed to identify and display these trends quickly and easily, allowing you to see instantly, those currency pairs which are trending, and those which are not – and in all timeframes, with just one click. The 28 currency pairs are displayed as a fan as they sweep from strong to weak and back again, and this is why we call it the ‘currency array’. All 28 pairs are arrayed before you, giving an instant visual description of those pairs that are trending strongly, those
197 USD
PART #2 : TOOLS 8 PAIRS  The tool makes it easy to get the fastest information about the movement of the pair and a measure of the strength of the momentum that is causing the trend [UPTREND | DOWNTREND]. Also when an asset is overbought or oversold that causes a reversal. Consists of functions of popular leading     indicators [WPR, MACD, RSI, CCI, STOC, MA] against 8 pairs [XAUUSD, EURUSD, GBPUSD, AUDUSD, NZDUSD, USDJPY, USDCHF, USDCAD]  in real-time. Allows to be used as information
30 USD
TT Arrows
Tomislav Turcin
TT Arrows is a trend based indicator that very succesfully predicts the start of the new trend.  The indicator is working with all trading instruments and in M5, M15, H1 and H4 timeframes. Up arrow signals a good time to enter a bullish trade while down arrow signals a good time to enter a bearish trade. The trade should be taken when the candle that has the arrow is closed. Following this strategy you will have have a high percentage of winning trades. Enjoy!
50 USD
KT Renko Patterns MT4
KEENBASE SOFTWARE SOLUTIONS
2.33 (3)
KT Renko Patterns scans the Renko chart brick by brick to find some famous chart patterns that are frequently used by traders across the various financial markets. Compared to the time-based charts, patterns based trading is easier and more evident on Renko charts due to their uncluttered appearance. KT Renko Patterns features multiple Renko patterns, and many of these patterns are extensively explained in the book titled Profitable Trading with Renko Charts by Prashant Shah. A 100% automate
180 USD
Käufer dieses Produkts erwarben auch
Ultimate Sniper Dashboard
Hispraise Chinedum Abraham
4.78 (18)
Ermäßigt auf $299! Die Preise können in Zukunft steigen! Lesen Sie die Beschreibung unten! Bestes Einstiegssystem für Ultimate Sniper Dashboard: ULTIMATIVE DYNAMISCHE EBENEN. (Bitte überprüfen Sie meine Produkte) Das Ultimate Sniper Dashboard funktioniert NUR auf Live-Märkten aufgrund der MT4 Multicurrency Testlimits. Wir stellen Ihnen das Ultimate-Sniper Dashboard vor! Unser bestes, das sowohl HA-Sniper, MA-Sniper und viele spezielle Modi enthält. Das Ultimate Sniper Dashboard ist ein
299 USD
Please send me Direct message on MQL5 CHAT after purchasing the Indicator for Training and Installation Support There are some additional files that is important to use with the Indicator . So be sure to contact me after purchasing the Indicator So that I can add you for training and support . If you find any difficulty with installation then send me Direct message here So that I can connect with you via Anydesk or Teamview for the product installation. " Smart Order Block Indicator " to find
249 USD
FFXMV Dashboard Plus
Opengates Success International
FFXMV Dashboard Plus This is a custom indicator created to give Traders a full view of what is going on in the market. It uses a real time data to access the market and display every bit of information needed to make successful trading. The PLUS there to produce the kind of RESULTS as you see in the SCREENSHOTS, I added a MultipleOrder Utility EA with it with instructions on how to use it with FFXMV Dashboard. INSTALLATION : Read the MANUALS that comes with the rest of the PACKAGE after yo
850 USD
Full Forex Market View Dashboard
Opengates Success International
5 (2)
VOLLSTÄNDIGE FOREX-MARKTANSICHT Dashboard-Anzeige Dies ist ein benutzerdefinierter Indikator, der erstellt wurde, um Händlern einen vollständigen Überblick darüber zu geben, was auf dem Markt vor sich geht. Es verwendet Echtzeitdaten, um auf den Markt zuzugreifen und alle Informationen anzuzeigen, die für einen erfolgreichen Handel erforderlich sind. INSTALLATION: Bevor Sie diesen Indikator an Ihren Fenster-Chart anhängen, gehen Sie zum Market Watch Panel Ihres MT4 und AUSBLENDEN Sie al
650 USD
Weis Wave with Alert
Panagiotis Diamantopoulos
4.78 (18)
20% Off from 499$ to 399$, offer end 31/3/2023    https://youtu.be/RjSSW0byp-I ** NEW PLUTUS SIGNALS and ALL IN ONE ** Wychoff's UpThrust + Spring, Fake Breaks and Plutus  trading signals added (for more info visit  http://www.tradethevolumewaves.com  ) Different Wave Types, choose what your cumulative Histogram diplays: Volume, Pips, Progressive Volume Rate, Time or Emphasized Volume Waves  **IF YOU PURCHASE DO NOT FORGET TO CONTACT ME BECAUSE THERE IS MORE: Two Hrs Webinar + Training Room
399 USD
INTRODUCING WORLD'S FIRST MT4 & MT5  Gann Dynamic Square, Circle and Equilateral Triangle  To Analyze Market Geometric Relationship. Gann Dynamic Square  has some of the most impressive features you will ever find in Gann & Geometric Analysis world. The Gann Dynamic Square is a tool to draw offset Square,Equilateral Triangle & Circle.Most charting software or MT4/MT5 market indicators don't have these features. You will be able draw your Geometric shapes like a professional geometric analys
399 USD
The breakout algorithm is a technique based on price, price features, to shape a breakout strategy. The strategy in this indicator will not be redrawn (none-repaint indicator), it is suitable for short or long term traders In the screenshot is the EURUSD pair, these currency pairs, commodities or stocks, it have similar strength *Non-Repainting (not redrawn) *For Metatrader4 Only *Great For Scalping *Great For Swing Trading *Arrow Entry, Green is Long, Red is Short *Works On Any Timeframe *Work
9 900 USD
Gartley Projection D
Oleksandr Medviediev
4.17 (6)
The indicator identifies the harmonic patterns (XABCD) according to developments of H.M.Gartley ( "Profits in the Stock Market" , 1935г). It projects D-point as a point in the perspective projection (specify ProjectionD_Mode = true in the settings). Does not redraw. When a bar of the working timeframe closes, if the identified pattern point has not moved during Patterns_Fractal_Bars bars, an arrow appears on the chart (in the direction of the expected price movement). From this moment on, the ar
300 USD
VTrende Pro MT4 - MTF indicator for trend trading with a display panel for MT5 *** Videos can be translated into any language using subtitles (video language - Russian) Although the signals of the VTrende Pro indicator can be used as signals of a full-fledged trading system, it is recommended to use them in conjunction with the Bill Williams TS. VTrende Pro  MT4 is an extended version of the VTrende indicator. Difference between Pro version and VTrende: - Time zones - Signal V - signal 1-
697 USD
Order Block Indicator MT4
Diego Arribas Lopez
5 (2)
[   MT5-Version   ]  Orderblock-Indikator MT4 Der Order Block Indicator MT4 ist derzeit der genaueste und anpassbarste Indikator auf dem Markt. Es wurde entwickelt, um die Analyse von Operationen basierend auf Auftragsblöcken und Angebots- und Nachfragezonen zu erleichtern. Diese Zonen sind mögliche Umkehrpunkte einer Bewegung. Orderblock Indicator MT4 hebt aktive Orderblöcke von bis zu 4 TFs gleichzeitig hervor. Gleichzeitig bietet der Order Block Indicator MT4 ein visuelles Warnsystem, mit dem
224 USD
Introduction to X3 Chart Pattern Scanner X3 Cherart Pattern Scanner is the non-repainting and non-lagging indicator detecting X3 chart patterns including Harmonic pattern, Elliott Wave pattern, X3 patterns, and Japanese Candlestick patterns. Historical patterns match with signal patterns. Hence, you can readily develop the solid trading strategy in your chart. More importantly, this superb pattern scanner can detect the optimal pattern of its kind. In addition, you can switch on and off individu
250 USD
MT5 Version   Kill Zones   SMT Divergences Order Blocks ICT Multi TF The Order Blocks ICT Multi TF indicator is a cutting-edge tool designed to help traders make better trading decisions based on order block analysis. Order blocks are key levels on a price chart where large institutional traders placed their orders. These levels tend to act as strong support or resistance zones and often signal a potential reversal or continuation of a trend. By identifying these order blocks, traders can gain
224 USD
The Hurricane Indicator
Paul Nicholas Clevett
5 (1)
Currently switched to the 4 hour chart - but use other time frames for confirmation. :-)  I change my main time frame based on the market movement at the time. The Hurricane Forex Indicator is a multi time frame indicator that includes such things as Trade Notifications, Trade Calculator, Momentum Indicator, risk reward and much more. We have a free Trade room for our users as well. Please check out the video for full details of how this indicator works as it has over 15 years worth of developme
599 USD
This indicator uses support and resistance, volume and some special formula to calculate the volume to filter the candles. If the volume reaches a specific value, And at the same time, Candle breaks the support/resistance line, There would be a signal and we can enter the market. Signals appear when the current candle closes. then you can enter the trade when a new candle appears. Please don't forget to follow your money management plan. MT5 Version Support/Resistance Breakout MT5 :   https:
299 USD
The Nihilist 5.0 Indicator includes Forexalien and Nihilist Easy Trend trading strategies and systems. It is composed of an MTF Dashboard where you can analyze the different input possibilities of each strategy at a glance. It has an alert system with different types of configurable filters. You can also configure which TF you want to be notified on your Metatrader 4 platform and Mobile application The indicator has the option to view how could be a TP and SL by using ATR or fixed points, even
299 USD
This is an indicator with real-time reminder function, which can realize real-time monitoring of four harmonic patterns of multiple cycles (30 minute chart, 1 hour chart, 4 hour chart, 1 day chart), and help traders to have insight into market reversal opportunities. Gartly Bat Butterfly Cypher Before loading into the chart, you need to manually input the switch parameters, which are the harmonic patterns   and time period you want to monitor: M30 / H1 / H4 / D1. It is on  when the corresponding
499 USD
FTU-Prädiktor Ein einzigartiger Indikator für „Low Buy, Sell High“-Strategien – hochpräziser zukünftiger Preisvorhersage für Hochs oder Tiefs jedes Produkts für Wochen-, Tages-, 4-Stunden- und sogar 1-Stunden-Charts. https://youtu.be/40oOn45Nv58 Dieser Indikator ist nur für die mt4-Plattform bestimmt und kann ausschließlich für den Handel oder mit einer Kombination aus anderen Indikatoren und Strategien verwendet werden Bereitstellung hoher und niedriger Preisniveaus für erwartete Ziel- un
800 USD
CFF Dark M Volume This is the most accurate Volume Reversal & Trend Following System for MT4 providing accurate signals to enter a trade without redrawing or delays.   It can be applied to:  All MT4 Charts . . The best results are on the timeframe 1H & 4H    | Our MQL5 Channel   IMPORTANT! Contact me after your purchase to get the detailed guide.   Most traders are %99 accurate with the help of CFF Dark Money Volume System.    Benefits of CFF Dark M Volume System  Entry signals  ba
1 313 USD
A percent graphic is a type of graph or chart used to represent data as a percentage of a whole. Percent graphics are often used to illustrate how a given set of data is distributed between different categories or how certain trends have changed over time. Percent graphics can be used to show the composition of a dow jones , or the performance of a company over a given period of time   d1 percet  w1 perncet  m1 percent  y1 percenty
500 USD
Algo Trading Indicaor  With this indicator , you’ll have zones and trends that hight probability the price will reverse from it. so will gives you all the help that you need  Why should you join us !?  1-This indicator is logical since it’s working in previous days movement , to predict the future movements. 2-Algo trading indicator will help you to draw trends which is special and are too strong than the basics trend , trends will change with the frame time that you work on . 3-We can
249 USD
Spirit mt4
Alena Snigireva
5 (1)
Spirit mt4 is an indicator that works without flashing, the signals are triggered after the arrow at the beginning of the next candle Includes several indicators for overbought and oversold levels. Works with any currency pair: EUR/USD, AUD/USD and others. After the purchase, send me a private message and I will send you the settings that I use for this indicator. Suitable for trading cryptocurrencies. I like to trade cryptocurrency more, so I use it more there. It can also be used
800 USD
EZT Trend
Tibor Rituper
4.5 (2)
The EZT Trend indicator will show you the trend, the pullback and the entry opportunities. Optional filtering and all type of alerts are available. E-mail and push notification alerts are added. We are also developing an EA based on this indicator, which will be available soon. It is a multi-functional indicator consisting of two color histograms and a line. It is a visual representation of a trend direction and strength, also you will find divergence many times, either on the line or on the his
320 USD
Precautions for subscribing to indicator This indicator only supports the computer version of MT4 Does not support MT5, mobile phones, tablets The indicator only shows the day's entry arrow The previous history arrow will not be displayed (Live broadcast is for demonstration) The indicator is a trading aid Is not a EA automatic trading No copy trading function The indicator only indicates the entry position No exit (target profit)  The entry stop loss point is set at 30-50 PIPS Or the front
1 800 USD
SMT Divergences MT4
Diego Arribas Lopez
5 (1)
MT5 Version SMT Divergences MT4 SMT Divergences is one of the most innovative indicators in the market. It offers the possibility of analyzing price divergences between 2 pairs. These divergences highlight and help to foresee what banks and institutions are planning to do. SMT divergences also provides you with a kill zones indicator and the possibility of filtering divergences occurring during these kill zones.  The strategy tester is limited in MT4. Contact the author to get your Demo Version
224 USD
„Vorläufig: Die Bedeutung eines integrierten Informationssystems für den Krypto-Forex-Handel“ Der Krypto- und Forex-Handel sind zwei der dynamischsten und komplexesten Finanzmärkte, die es den Händlern erfordern, Zugang zu genauen und zuverlässigen Echtzeitinformationen zu haben, um fundierte Handelsentscheidungen treffen zu können. Angesichts der Schnelllebigkeit und sich ständig ändernden Natur dieser Märkte kann es schwierig sein, über die neuesten Trends auf dem Laufenden zu bleiben und ve
222 USD
AURUS Arrow
Dmitriy Soldatenko
Индикатор AURUS Arrow предусматривает возможность выявления различных особенностей и закономерностей в динамике цен, которые не видны невооруженным глазом. AURUS Arrow — индикатор, показывающий стрелки покупки-продажи, которые определенно помогут каждому трейдеру, который не знает как торговать. На основании этой информации, трейдеры могут предположить дальнейшее движение цены и корректировать свои стратегии, соответственно. Буферная стрелка покупки-продажи с сигнальным алертом. Тайм-фре
279 USD
Offer 249 down from 350 for the next 3 copies. then back to 350 $ Are you tired of using outdated indicators that leave you guessing where to set your profit targets? Look no further than the AK CAP Opening Range Breakout Indicator. This powerful tool is backed by a US patent and has already helped countless traders pass funded challenges like FTMO. We use it daily on our prop traders and internal funds, and now it's available to you as well. The calculation behind the indicator is incredibly
249 USD
Prometheus Trade Engine is an indicator that combines price action, ratio based indicator with custom indicators& other lagging indicators to create this leading indicator that has a multi-timeframe approach to trading so that you are able to see what other timeframes are doing all in one chart and give you high probability trade setups to assist you to make a prediction on what is MOST likely to happen in the market going foward Chart Features 1. Reversal Zone It is the rectangular box on
250 USD
Order Squeeze
Sara Sabaghi
5 (1)
Order Squeeze Easy to use indicator to predict the market movement with calculated HIGH important levels. These levels are calculated in the lowest time frame with candle details. Ind calculates the quantity of market tick, volume per tick, and orders per candle. So with this statistical data, you catch the important price levels that supply and demand in the market are attractive for sellers and buyers. Institutes and banks trade with huge order lots and they need a lot of sellers for their BUY
220 USD
The Entry Point Dashboard Ultimate technical indicator provides Buy/ Sell notifications for any 6 Currency Pairs by analyzing 5 Moving Averages, CCI, RSI, Stochastic, Bill Williams and Volume indicators using 3 different time frames. It gives unlimited customization facility to professional traders for getting more accurate signals by following their experience. The Indicator sends signals to user mobile device, email and displays a pop-up alert with sound. Indicator main signal shows few leve
250 USD
Weitere Produkte dieses Autors
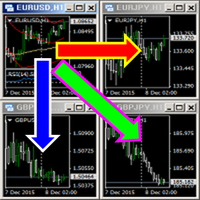
This indicator changes the timeframe and chart profile for multiple charts. If you dispatched many charts (10~20 or more) in single MetaTrader terminal, it is very boring and difficult work to manage the timeframe and chart profile individually. If the indicators you use in a chart are numerous and the setting values are different from the default one, you might give up adding all the indicators to all charts. The changing of timeframes on multiple charts has the same problem, too. Whenever you
100 USD
Auswahl:
Keine Bewertungen
Antwort auf eine Rezension
Version 2.1 2020.03.25
Compiled with MetaEditor 5.00 build 2302.