Elder Chandelier Long Exit
- Indikatoren
- Financial Trading Seminars Inc.
- Version: 2.0
- Aktualisiert: 17 November 2021
- Aktivierungen: 5
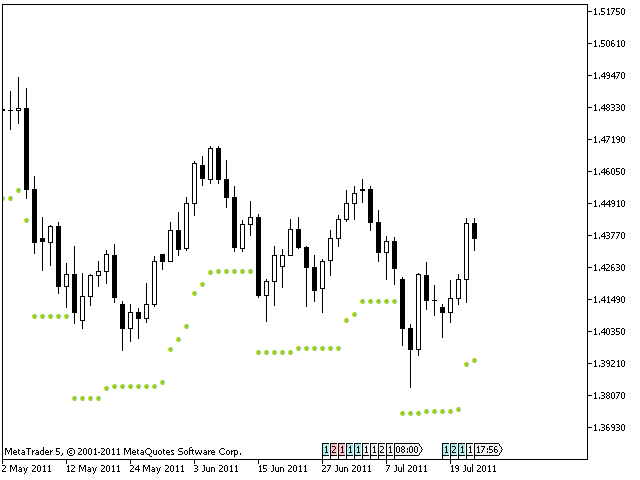
The Chandelier Exit, introduced by Charles LeBeau, is described in "Come into My Trading Room" book.
It calculates each stop on a long position in an uptrend from the highest point reached during that rally, and gets its name from the chandelier, which hangs from the highest point in the room. The Chandelier Exit uses a multiple of the Average True Range (ATR), subtracting it from the highest high since the trade was entered. It creates a new trade whenever the previous trade is stopped out.
Chandelier Stops differ from traditional stops by having the ability to move against you if the anchor point stays the same but the ATR increases due to volatility. A more conservative approach is to ignore any change in a stop that increases your risk.
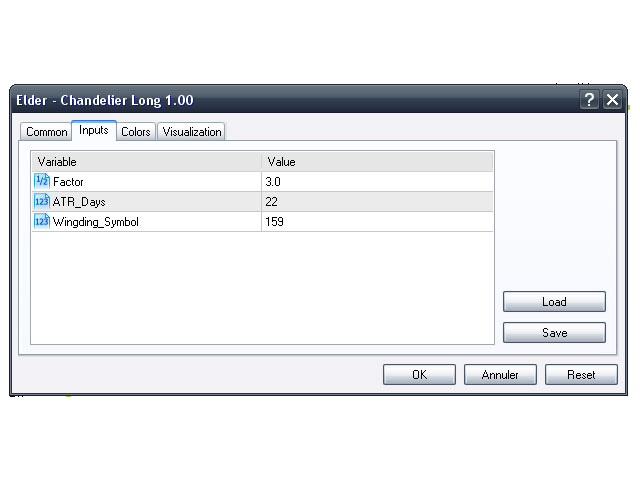
Parameters:
- Factor (3) – This is the factor for multiplying the ATR when computing the Chandelier, you may use fractions – this does not need to be an integer;
- ATR_Days (22) – Number of days for computing ATR;
- Wingding_Symbol (159) – Symbol to be displayed.