Zone Trade AM
- Indikatoren
- Andriy Matviyevs'kyy
- Version: 26.0
- Aktualisiert: 11 September 2023
- Aktivierungen: 5
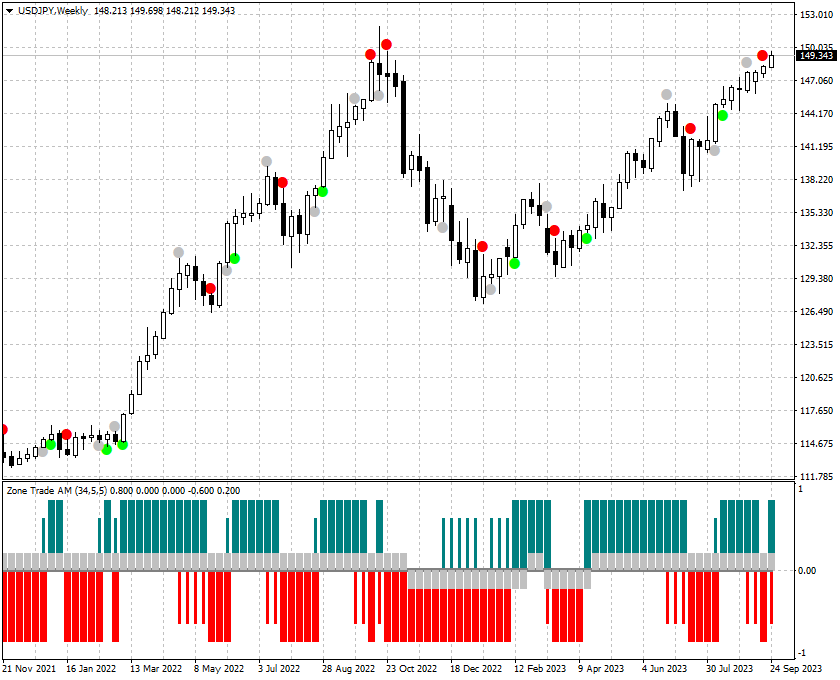
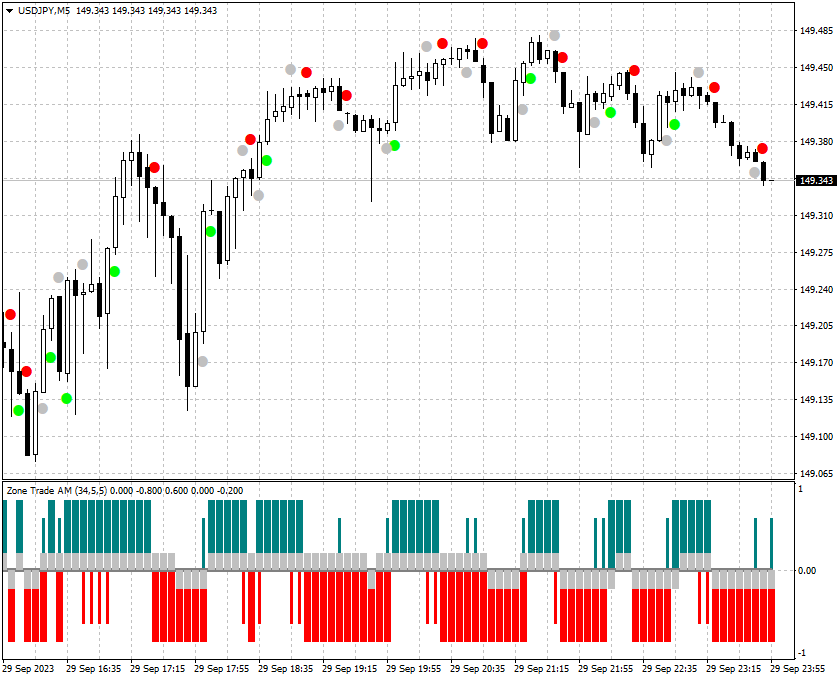
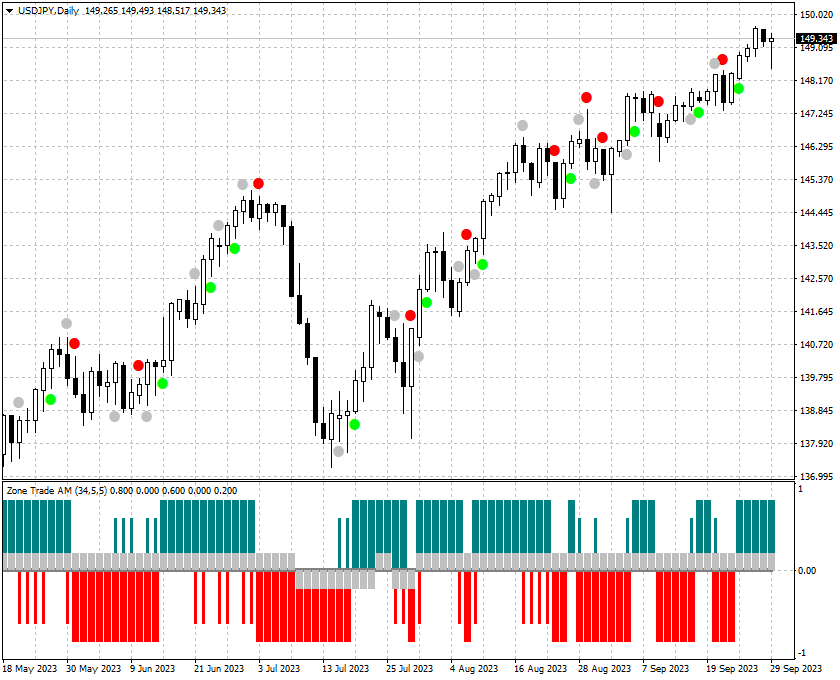
The indicator is based on the elements of Bill Williams' trading system.
Sell signals are formed when MACD and OsMA values are falling simultaneously (Bill Williams calls these indicators АО and АС in his book), while buy signals appear when both indicators are rising.
Thick and thin colored histograms match MACD and OsMA values.
If the histogram is greater than 0, the indicator value is rising. Otherwise, it is falling.
Positions should be opened when the price exceeds the bar's high or low, at which both the histograms point in the same direction.
Additionally, the indicator displays position of the current average price relative to the moving average (single-colored histogram relative to zero).
By default, the moving average settings involve the parameters of the center line of yet another Bill Williams' indicator - Alligator.
The indicator has no configurable parameters.
An indicator variant in which the MACD and OsMA parameters can be changed is Zone Trade 2 AM.