Das MQL5-Kochbuch: Überwachen von mehreren Timeframes in einem Fenster
Anatoli Kazharski | 27 Juni, 2016
Einleitung
Bei der Auswahl der Richtung für die Öffnung einer Position ist ein Preisdiagramm mit mehreren gleichzeitig angezeigten Timeframes sehr nützlich. Im MetaTrader 5 Client Terminal stehen 21 Timeframes für die Analyse zur Auswahl. Sie können spezielle Diagrammobjekte nutzen, die Sie im bestehenden Diagramm platzieren können, und Symbol, Timeframe und einige weitere Eigenschaften direkt dort festlegen. Sie können eine beliebige Menge solcher Diagrammobjekte hinzufügen, allerdings wäre es ziemlich umständlich und zeitraubend, das manuell zu tun. Außerdem können nicht alle Diagrammeigenschaften im manuellen Modus festgelegt werden.
In diesem Beitrag sehen wir uns solche grafischen Objekte näher an. Zu Illustrationszwecken erstellen wir einen Indikator mit Steuerelementen (Buttons), die es uns ermöglichen, mehrere Diagrammobjekte gleichzeitig in einem Unterfenster einzurichten. Ferner werden Diagrammobjekte genau in das Unterfenster passen und werden automatisch angepasst, wenn die Größe des Hauptdiagramms oder des Terminalfensters verändert wird.
Zusätzlich zu den Buttons zum Hinzufügen von Diagrammobjekten werden wir auch Buttons zum Aktivieren/Deaktivieren einiger Diagrammeigenschaften haben, darunter auch solche, die nur auf Programmebene verändert werden können.
Entwicklung
Über Insert->Objects->Graphical Objects->Chart (Einfügen->Objekte->Grafische Objekte->Diagramm) können Sie ein Diagrammobjekt manuell hinzufügen. So werden beispielsweise Objekte mit H4- und D1-Timeframes auf dem Stundendiagramm dargestellt:
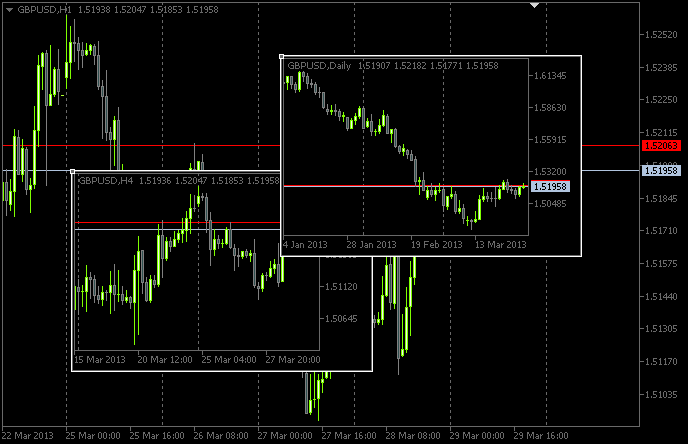
Abb. 1. Diagrammobjekte
Durch Modifizieren der Parameter dieser Objekte können Sie nur eine begrenzte Menge von Eigenschaften verwalten:
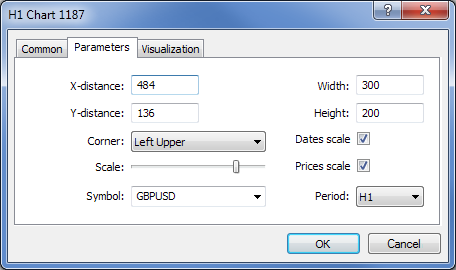
Abb. 2. Eigenschaften von Diagrammobjekten
Doch Parameter wie die Preisebenen ask und bid, die Einrückung vom rechten Rand des Diagramms, Handelsebenen usw. können nur angezeigt werden, wenn sie entsprechend programmiert sind.
Beginnen wir also mit der Entwicklung des Indikators. Nennen wir ihn beispielsweise ChartObjects (Arbeitstitel des Beitrags). Erstellen Sie mithilfe des MQL5 Wizard eine Vorlage für den Indikator in MetaEditor. Wählen Sie bei der Auswahl von Event handlers of the Custom indicator program (Ereignis-Handler des benutzerdefinierten Indikators) die folgenden Optionen:
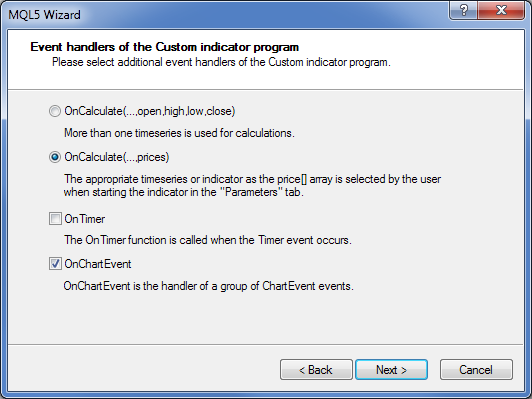
Abb. 3. Ereignis-Handler des Indikators
In MetaEditor sieht der Quellcode der Vorlage so aus:
//+------------------------------------------------------------------+
//|                                                 ChartObjects.mq5 |
//|                        Copyright 2013, MetaQuotes Software Corp. |
//|                                              http://www.mql5.com |
//+------------------------------------------------------------------+
#property copyright "Copyright 2013, MetaQuotes Software Corp."
#property link      "http://www.mql5.com"
#property version   "1.00"
#property indicator_chart_window
//+------------------------------------------------------------------+
//| Custom indicator initialization function                         |
//+------------------------------------------------------------------+
int OnInit()
  {
//--- indicator buffers mapping

//---
   return(INIT_SUCCEEDED);
  }
//+------------------------------------------------------------------+
//| Custom indicator iteration function                              |
//+------------------------------------------------------------------+
int OnCalculate(const int rates_total,
                const int prev_calculated,
                const int begin,
                const double &price[])
  {
//---

//--- return value of prev_calculated for next call
   return(rates_total);
  }
//+------------------------------------------------------------------+
//| TradeTransaction function                                        |
//+------------------------------------------------------------------+
void OnTradeTransaction(const MqlTradeTransaction& trans,
                        const MqlTradeRequest& request,
                        const MqlTradeResult& result)
  {
//---

  }
//+------------------------------------------------------------------+
//| ChartEvent function                                              |
//+------------------------------------------------------------------+
void OnChartEvent(const int id,
                  const long &lparam,
                  const double &dparam,
                  const string &sparam)
  {
//---

  }
//+------------------------------------------------------------------+
Die Funktion OnCalculate() wird bei dieser Umsetzung grundsätzlich nicht benötigt, doch der Indikator kann ohne sie nicht kompiliert werden. Ferner brauchen wir eine der Hauptfunktionen – OnDeinit(). Sie überwacht die Löschung des Programms aus dem Diagramm. Nach der ersten Verarbeitung der Vorlage erhalten wir den folgenden Quellcode:
//+------------------------------------------------------------------+
//|                                                 ChartObjects.mq5 |
//|                        Copyright 2013, MetaQuotes Software Corp. |
//|                                              http://www.mql5.com |
//+------------------------------------------------------------------+
#property copyright "Copyright 2013, MetaQuotes Software Corp."
#property link      "http://www.mql5.com"
#property version   "1.00"
//---
#property indicator_chart_window // Indicator is in the main window
#property indicator_plots 0      // Zero plotting series
//+------------------------------------------------------------------+
//| Custom indicator initialization function                         |
//+------------------------------------------------------------------+
int OnInit()
  {
//--- Set the short name for the indicator
   IndicatorSetString(INDICATOR_SHORTNAME,"TimeFramesPanel");
//--- Initialization completed successfully
   return(INIT_SUCCEEDED);
  }
//+------------------------------------------------------------------+
//| Indicator deinitialization                                       |
//+------------------------------------------------------------------+
void OnDeinit(const int reason)
  {
//--- If the indicator has been deleted from the chart
   if(reason==REASON_REMOVE)
     {
     }
  }
//+------------------------------------------------------------------+
//| Custom indicator iteration function                              |
//+------------------------------------------------------------------+
int OnCalculate(const int rates_total,
                const int prev_calculated,
                const int begin,
                const double &price[])
  {
//---

//--- return value of prev_calculated for next call
   return(rates_total);
  }
//+------------------------------------------------------------------+
//| ChartEvent function                                              |
//+------------------------------------------------------------------+
void OnChartEvent(const int id,
                  const long &lparam,
                  const double &dparam,
                  const string &sparam)
  {
//---

  }
//+------------------------------------------------------------------+
Nun müssen wir einen Indikator erstellen, der als Speicher (Unterfenster) für Diagrammobjekte dient. Grundsätzlich handelt es sich um einen Dummy-Indikator. Nennen wir ihn SubWindow. Sein Code sieht so aus:
//+------------------------------------------------------------------+
//|                                                    SubWindow.mq5 |
//|                        Copyright 2013, MetaQuotes Software Corp. |
//|                                              http://www.mql5.com |
//+------------------------------------------------------------------+
#property copyright "Copyright 2013, MetaQuotes Software Corp."
#property link      "http://www.mql5.com"
#property version   "1.00"
//---
#property indicator_chart_window // Indicator is in the subwindow
#property indicator_plots 0      // Zero plotting series
//+------------------------------------------------------------------+
//| Custom indicator initialization function                         |
//+------------------------------------------------------------------+
int OnInit()
  {
//--- Set the short name for the indicator
   IndicatorSetString(INDICATOR_SHORTNAME,"SubWindow");
//--- Initialization completed successfully
   return(INIT_SUCCEEDED);
  }
//+------------------------------------------------------------------+
//| Custom indicator iteration function                              |
//+------------------------------------------------------------------+
int OnCalculate(const int rates_total,
                const int prev_calculated,
                const int begin,
                const double &price[])
  {
//---

//--- return value of prev_calculated for next call
   return(rates_total);
  }
//+------------------------------------------------------------------+
Der Indikator SubWindow.ex5 wird nach der Kompilierung als Ressource innerhalb von ChartObjects.ex5 gespeichert. Somit wird es dem Entwickler am Ende ermöglicht, Endbenutzern nur eine Datei anstatt zwei zur Verfügung zu stellen.
Wie bereits im vorherigen Beitrag "Das MQL5-Kochbuch: Signaltöne für Handelsereignisse in MetaTrader 5" beschrieben, können Ressourcendateien mithilfe der Direktive #resource in ein Programm eingefügt werden. Am Anfang unseres Programms ChartObjects müssen wir die folgende Codezeile einfügen:
//--- Include indicator resource
#resource "\\Indicators\\SubWindow.ex5"
Mit der Direktive #define legen wir dann die Größen der Arrays fest, die den Bedienelementen zugewiesen werden:
//--- Number of time frame buttons
#define TIMEFRAME_BUTTONS 21
//--- Number of buttons for chart object properties
#define PROPERTY_BUTTONS 5
Und wie gewohnt deklarieren wir globale Variablen ganz am Anfang des Programms:
//--- Location of the SubWindow indicator in the resource
string subwindow_path         ="::Indicators\\SubWindow.ex5";
int    subwindow_number       =-1;               // Subwindow number
int    subwindow_handle       =INVALID_HANDLE;   // SubWindow indicator handle
string subwindow_shortname    ="SubWindow";      // Short name of the indicator
//---
int    chart_width            =0;                // Chart width
int    chart_height           =0;                // Chart height
int    chart_scale            =0;                // Chart scale
//---
color  cOffButtonFont         =clrWhite;         // Unclicked button text color
color  cOffButtonBackground   =clrDarkSlateGray; // Unclicked button background color
color  cOffButtonBorder       =clrLightGray;     // Unclicked button border color
//---
color  cOnButtonFont          =clrGold;          // Clicked button text color
color  cOnButtonBackground    =C'28,47,47';      // Clicked button background color
color  cOnButtonBorder        =clrLightGray;     // Clicked button border color
Darauf folgt die Deklarierung von Arrays für Timeframe-Buttons:
//--- Array of object names for time frame buttons
string timeframe_button_names[TIMEFRAME_BUTTONS]=
  {
   "button_M1","button_M2","button_M3","button_M4","button_M5","button_M6","button_M10",
   "button_M12","button_M15","button_M20","button_M30","button_H1","button_H2","button_H3",
   "button_H4","button_H6","button_H8","button_H12","button_D1","button_W1","button_MN"
  };
//--- Array of text displayed on time frame buttons
string timeframe_button_texts[TIMEFRAME_BUTTONS]=
  {
   "M1","M2","M3","M4","M5","M6","M10",
   "M12","M15","M20","M30","H1","H2","H3",
   "H4","H6","H8","H12","D1","W1","MN"
  };
//--- Array of time frame button states
bool timeframe_button_states[TIMEFRAME_BUTTONS]={false};
Arrays von Buttons zur Steuerung der Eigenschaften von Diagrammobjekten:
//--- Array of object names for buttons of chart properties
string property_button_names[PROPERTY_BUTTONS]=
  {
   "property_button_date","property_button_price",
   "property_button_ohlc","property_button_askbid",
   "property_button_trade_levels"
  };
//--- Array of text displayed on buttons of chart properties
string property_button_texts[PROPERTY_BUTTONS]=
  {
   "Date","Price","OHLC","Ask / Bid","Trade Levels"
  };
//--- Array of states for buttons of chart properties
bool property_button_states[PROPERTY_BUTTONS]={false};

//--- Array of sizes for buttons of chart properties
int property_button_widths[PROPERTY_BUTTONS]=
  {
   66,68,66,100,101
  };
Und zu guter Letzt haben wir ein Array von Namen von Diagrammobjekten:
//--- Array of chart object names
string chart_object_names[TIMEFRAME_BUTTONS]=
  {
   "chart_object_m1","chart_object_m2","chart_object_m3","chart_object_m4","chart_object_m5","chart_object_m6","chart_object_m10",
   "chart_object_m12","chart_object_m15","chart_object_m20","chart_object_m30","chart_object_h1","chart_object_h2","chart_object_h3",
   "chart_object_h4","chart_object_h6","chart_object_h8","chart_object_h12","chart_object_d1","chart_object_w1","chart_object_mn"
  };
Bevor wir mit Funktionen fortfahren, die mit der Interaktion mit grafischen Objekten zusammenhängen, schreiben wir zunächst die Funktionen, die diese Objekte im Diagramm erstellen. In unserem Programm werden wir zwei Typen von grafischen Objekten benötigen: OBJ_BUTTON und OBJ_CHART.
Buttons werden mithilfe der Funktion CreateButton() erstellt:
//+------------------------------------------------------------------+
//| Creating the Button object                                       |
//+------------------------------------------------------------------+
void CreateButton(long              chart_id,         // chart id
                  int               window_number,    // window number
                  string            name,             // object name
                  string            text,             // displayed name
                  ENUM_ANCHOR_POINT anchor,           // anchor point
                  ENUM_BASE_CORNER  corner,           // chart corner
                  string            font_name,        // font
                  int               font_size,        // font size
                  color             font_color,       // font color
                  color             background_color, // background color
                  color             border_color,     // border color
                  int               x_size,           // width
                  int               y_size,           // height
                  int               x_distance,       // X-coordinate
                  int               y_distance,       // Y-coordinate
                  long              z_order)          // Z-order
  {
//--- If the object has been created successfully
   if(ObjectCreate(chart_id,name,OBJ_BUTTON,window_number,0,0))
     {
      // set its properties
      ObjectSetString(chart_id,name,OBJPROP_TEXT,text);                  // setting name
      ObjectSetString(chart_id,name,OBJPROP_FONT,font_name);             // setting font
      ObjectSetInteger(chart_id,name,OBJPROP_COLOR,font_color);          // setting font color
      ObjectSetInteger(chart_id,name,OBJPROP_BGCOLOR,background_color);  // setting background color
      ObjectSetInteger(chart_id,name,OBJPROP_BORDER_COLOR,border_color); // setting border color
      ObjectSetInteger(chart_id,name,OBJPROP_ANCHOR,anchor);             // setting anchor point
      ObjectSetInteger(chart_id,name,OBJPROP_CORNER,corner);             // setting chart corner
      ObjectSetInteger(chart_id,name,OBJPROP_FONTSIZE,font_size);        // setting font size
      ObjectSetInteger(chart_id,name,OBJPROP_XSIZE,x_size);              // setting width
      ObjectSetInteger(chart_id,name,OBJPROP_YSIZE,y_size);              // setting height
      ObjectSetInteger(chart_id,name,OBJPROP_XDISTANCE,x_distance);      // setting X-coordinate
      ObjectSetInteger(chart_id,name,OBJPROP_YDISTANCE,y_distance);      // setting Y-coordinate
      ObjectSetInteger(chart_id,name,OBJPROP_SELECTABLE,false);          // object is not available for selection
      ObjectSetInteger(chart_id,name,OBJPROP_STATE,false);               // button state (clicked/unclicked)
      ObjectSetInteger(chart_id,name,OBJPROP_ZORDER,z_order);            // Z-order for getting the click event
      ObjectSetString(chart_id,name,OBJPROP_TOOLTIP,"\n");               // no tooltip
     }
  }
Die Erstellung eines Diagramms in einem Unterfenster findet dementsprechend in der Funktion CreateChartInSubwindow() statt:
//+------------------------------------------------------------------+
//| Creating a chart object in a subwindow                           |
//+------------------------------------------------------------------+
void CreateChartInSubwindow(int             window_number,  // subwindow number
                            int             x_distance,     // X-coordinate
                            int             y_distance,     // Y-coordinate
                            int             x_size,         // width
                            int             y_size,         // height
                            string          name,           // object name
                            string          symbol,         // symbol
                            ENUM_TIMEFRAMES timeframe,      // time frame
                            int             subchart_scale, // bar scale
                            bool            show_dates,     // show date scale
                            bool            show_prices,    // show price scale
                            bool            show_ohlc,      // show OHLC prices
                            bool            show_ask_bid,   // show ask/bid levels
                            bool            show_levels,    // show trade levels
                            string          tooltip)        // tooltip
  {
//--- If the object has been created successfully
   if(ObjectCreate(0,name,OBJ_CHART,window_number,0,0))
     {
      //--- Set the properties of the chart object
      ObjectSetInteger(0,name,OBJPROP_CORNER,CORNER_LEFT_UPPER);   // chart corner
      ObjectSetInteger(0,name,OBJPROP_XDISTANCE,x_distance);       // X-coordinate
      ObjectSetInteger(0,name,OBJPROP_YDISTANCE,y_distance);       // Y-coordinate
      ObjectSetInteger(0,name,OBJPROP_XSIZE,x_size);               // width
      ObjectSetInteger(0,name,OBJPROP_YSIZE,y_size);               // height
      ObjectSetInteger(0,name,OBJPROP_CHART_SCALE,subchart_scale); // bar scale
      ObjectSetInteger(0,name,OBJPROP_DATE_SCALE,show_dates);      // date scale
      ObjectSetInteger(0,name,OBJPROP_PRICE_SCALE,show_prices);    // price scale
      ObjectSetString(0,name,OBJPROP_SYMBOL,symbol);               // symbol
      ObjectSetInteger(0,name,OBJPROP_PERIOD,timeframe);           // time frame
      ObjectSetString(0,name,OBJPROP_TOOLTIP,tooltip);             // tooltip
      ObjectSetInteger(0,name,OBJPROP_BACK,false);                 // object in the foreground
      ObjectSetInteger(0,name,OBJPROP_SELECTABLE,false);           // object is not available for selection
      ObjectSetInteger(0,name,OBJPROP_COLOR,clrWhite);             // white color
      //--- Get the chart object identifier
      long subchart_id=ObjectGetInteger(0,name,OBJPROP_CHART_ID);
      //--- Set the special properties of the chart object
      ChartSetInteger(subchart_id,CHART_SHOW_OHLC,show_ohlc);           // OHLC
      ChartSetInteger(subchart_id,CHART_SHOW_TRADE_LEVELS,show_levels); // trade levels
      ChartSetInteger(subchart_id,CHART_SHOW_BID_LINE,show_ask_bid);    // bid level
      ChartSetInteger(subchart_id,CHART_SHOW_ASK_LINE,show_ask_bid);    // ask level
      ChartSetInteger(subchart_id,CHART_COLOR_LAST,clrLimeGreen);       // color of the level of the last executed deal
      ChartSetInteger(subchart_id,CHART_COLOR_STOP_LEVEL,clrRed);       // color of Stop order levels
      //--- Refresh the chart object
      ChartRedraw(subchart_id);
     }
  }
Im oben aufgeführten Code legen wir zuerst die Standardeigenschaften des Diagramms für ein Diagrammobjekt fest. Nach dem Empfang des Identifikators des Diagrammobjekts werden die speziellen Eigenschaften festgelegt. Es ist auch wichtig, das Diagramm mithilfe der Funktion ChartRedraw() zu aktualisieren, wenn der Identifikator des Diagrammobjekts an es übergeben wird.
Teilen wir die Einrichtung der Steuerelemente in zwei Funktionen auf: AddTimeframeButtons() und AddPropertyButtons():
//+------------------------------------------------------------------+
//| Adding time frame buttons                                        |
//+------------------------------------------------------------------+
void AddTimeframeButtons()
  {
   int x_dist =1;   // Indent from the left side of the chart
   int y_dist =125; // Indent from the bottom of the chart
   int x_size =28;  // Button width
   int y_size =20;  // Button height
//---
   for(int i=0; i<TIMEFRAME_BUTTONS; i++)
     {
      //--- If 7 buttons have already been added to the same row, set the coordinates for the next row
      if(i%7==0)
        {
         x_dist=1;
         y_dist-=21;
        }
      //--- Add a time frame button
      CreateButton(0,0,timeframe_button_names[i],timeframe_button_texts[i],
                   ANCHOR_LEFT_LOWER,CORNER_LEFT_LOWER,"Arial",8,
                   cOffButtonFont,cOffButtonBackground,cOffButtonBorder,
                   x_size,y_size,x_dist,y_dist,3);
      //--- Set the X-coordinate for the next button
      x_dist+=x_size+1;
     }
  }
//+------------------------------------------------------------------+
//| Adding buttons of chart properties                               |
//+------------------------------------------------------------------+
void AddPropertyButtons()
  {
   int x_dist =1;  // Indent from the left side of the chart
   int y_dist =41; // Indent from the bottom of the chart
   int x_size =66; // Button width
   int y_size =20; // Button height
//---
   for(int i=0; i<PROPERTY_BUTTONS; i++)
     {
      //--- If the first three buttons have already been added, set the coordinates for the next row
      if(i==3)
        {
         x_dist=1;
         y_dist-=21;
        }
      //--- Add a button
      CreateButton(0,0,property_button_names[i],property_button_texts[i],
                   ANCHOR_LEFT_LOWER,CORNER_LEFT_LOWER,"Arial",8,
                   cOffButtonFont,cOffButtonBackground,cOffButtonBorder,
                   property_button_widths[i],y_size,x_dist,y_dist,3);
      //--- Set the X-coordinate for the next button
      x_dist+=property_button_widths[i]+1;
     }
  }
Beim Entfernen des Indikators aus dem Diagramm müssen wir auch die durch das Programm erstellten Objekte löschen. Zu diesem Zweck benötigen wir die folgenden Hilfsfunktionen:
//+------------------------------------------------------------------+
//| Deleting the panel with time frame buttons                       |
//+------------------------------------------------------------------+
void DeleteTimeframeButtons()
  {
   for(int i=0; i<TIMEFRAME_BUTTONS; i++)
      DeleteObjectByName(timeframe_button_names[i]);
  }
//+------------------------------------------------------------------+
//| Deleting the panel with buttons of chart properties              |
//+------------------------------------------------------------------+
void DeletePropertyButtons()
  {
   for(int i=0; i<PROPERTY_BUTTONS; i++)
      DeleteObjectByName(property_button_names[i]);
  }
//+------------------------------------------------------------------+
//| Deleting objects by name                                         |
//+------------------------------------------------------------------+
void DeleteObjectByName(string object_name)
  {
//--- If such object exists
   if(ObjectFind(ChartID(),object_name)>=0)
     {
      //--- Delete it or print the relevant error message
      if(!ObjectDelete(ChartID(),object_name))
         Print("Error ("+IntegerToString(GetLastError())+") when deleting the object!");
     }
  }
Um sicherzustellen, dass das Panel beim Laden des Indikators im Diagramm eingerichtet wird und alle Panel-Objekte beim Entfernen des Indikators aus dem Diagramm gelöscht werden, müssen wir die folgenden Codezeilen zu den Handler-Funktionen OnInit() und OnDeinit() hinzufügen:
//+------------------------------------------------------------------+
//| Custom indicator initialization function                         |
//+------------------------------------------------------------------+
int OnInit()
  {
//--- Add the panel with time frame buttons to the chart
   AddTimeframeButtons();
//--- Add the panel with buttons of chart properties to the chart
   AddPropertyButtons();
//--- Redraw the chart
   ChartRedraw();
//--- Initialization completed successfully
   return(INIT_SUCCEEDED);
  }
//+------------------------------------------------------------------+
//| Indicator deinitialization                                       |
//+------------------------------------------------------------------+
void OnDeinit(const int reason)
  {
//--- If the indicator has been deleted from the chart
   if(reason==REASON_REMOVE)
     {
      //--- Delete buttons
      DeleteTimeframeButtons();
      DeletePropertyButtons();
      //--- Redraw the chart
      ChartRedraw();
     }
  }
Wenn wir den Indikator jetzt kompilieren und an das Diagramm anhängen, würde das Panel aussehen, wie im nachfolgenden Screenshot dargestellt:
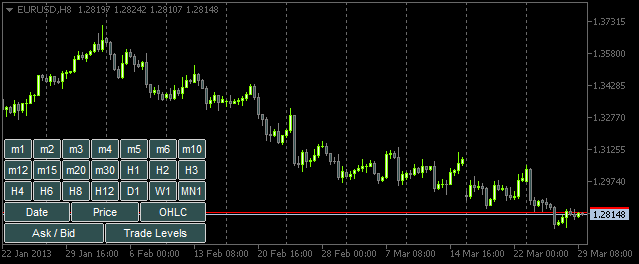
Abb. 4. Panel mit Buttons
Nun ist alles bereit, um mit der Erstellung von Funktionen für die Interaktion zwischen dem Benutzer und dem Panel fortzufahren. Grundsätzlich werden all diese Funktionen über die Hauptfunktion OnChartEvent() aufgerufen. In diesem Beitrag betrachten wir zwei Ereignisse, die in dieser Funktion verarbeitet werden:
- CHARTEVENT_OBJECT_CLICK – Ereignis des Klicks auf ein grafisches Objekt.
- CHARTEVENT_CHART_CHANGE – Ereignis der Veränderung der Größe des Diagramms oder der Veränderung der Eigenschaften des Diagramms mithilfe des Dialogfensters Eigenschaften.
Beginnen wir mit dem Ereignis CHARTEVENT_OBJECT_CLICK. Die Funktion ChartEventObjectClick(), die wir gleich schreiben werden, erhält alle Argumente von der Funktion OnChartEvent() (für andere Ereignisse erstellen wir ähnliche Funktionen):
//+------------------------------------------------------------------+
//| Event of the click on a graphical object                         |
//+------------------------------------------------------------------+
bool ChartEventObjectClick(int id,
                           long lparam,
                           double dparam,
                           string sparam)
  {
//--- Click on a graphical object
   if(id==CHARTEVENT_OBJECT_CLICK)
     {
      //--- If a time frame button has been clicked, set/delete 'SubWindow' and a chart object
      if(ToggleSubwindowAndChartObject(sparam))
         return(true);
      //--- If a button of chart properties has been clicked, set/delete the property in chart objects
      if(ToggleChartObjectProperty(sparam))
         return(true);
     }
//---
   return(false);
  }
Der Code der Funktion ChartEventObjectClick() ist einfach. Das Ereignis des Klicks auf einen Button des Panels wird mithilfe des Identifikators bestimmt. Dann wird die Implementierungslogik in zwei Richtungen unterteilt: Verarbeitung des Ereignisses des Klicks auf Timeframe-Buttons oder des Ereignisses des Klicks auf Buttons der Diagrammeigenschaften. Der String-Parameter sparam mit dem Namen des mit der linken Maustaste angeklickten Objekts wird an die entsprechenden Funktionen ToggleSubwindowAndChartObject() und ToggleChartObjectProperty() übergeben.
Sehen wir uns den Quellcode dieser Funktionen an. Wir beginnen mit ToggleSubwindowAndChartObject():
//+------------------------------------------------------------------+
//| Setting/deleting SubWindow and a chart object                    |
//+------------------------------------------------------------------+
bool ToggleSubwindowAndChartObject(string clicked_object_name)
  {
//--- Make sure that the click was on the time frame button object
   if(CheckClickOnTimeframeButton(clicked_object_name))
     {
      //--- Check if the SubWindow exists
      subwindow_number=ChartWindowFind(0,subwindow_shortname);
      //--- If the SubWindow does not exist, set it
      if(subwindow_number<0)
        {
         //--- If the SubWindow is set
         if(AddSubwindow())
           {
            //--- Add chart objects to it
            AddChartObjectsToSubwindow(clicked_object_name);
            return(true);
           }
        }
      //--- If the SubWindow exists
      if(subwindow_number>0)
        {
         //--- Add chart objects to it
         AddChartObjectsToSubwindow(clicked_object_name);
         return(true);
        }
     }
//---
   return(false);
  }
Anhand der Kommentare im obigen Code sollten Sie die Implementierungslogik leicht verstehen können. Die markierten Strings enthalten einige benutzerdefinierte Funktionen, deren Code Sie weiter unten sehen können.
Die Funktion CheckClickOnTimeframeButton() gibt true aus, wenn der angeklickte Button mit dem Panel von Timeframes zusammenhängt:
//+------------------------------------------------------------------+
//| Checking if a time frame button has been clicked                 |
//+------------------------------------------------------------------+
bool CheckClickOnTimeframeButton(string clicked_object_name)
  {
//--- Iterate over all time frame buttons and check the names
   for(int i=0; i<TIMEFRAME_BUTTONS; i++)
     {
      //--- Report the match
      if(clicked_object_name==timeframe_button_names[i])
         return(true);
     }
//---
   return(false);
  }
Wenn der Klick auf einen Timeframe-Button bestätigt wurde, prüfen wir daraufhin, ob das Unterfenster SubWindow aktuell zum Hauptdiagramm hinzugefügt wird. Falls nicht, wird dies mithilfe der Funktion AddSubwindow() eingerichtet:
//+------------------------------------------------------------------+
//| Adding a subwindow for chart objects                             |
//+------------------------------------------------------------------+
bool AddSubwindow()
  {
//--- Get the "SubWindow" indicator handle
   subwindow_handle=iCustom(_Symbol,_Period,subwindow_path);
//--- If the handle has been obtained
   if(subwindow_handle!=INVALID_HANDLE)
     {
      //--- Determine the number of windows in the chart for the subwindow number
      subwindow_number=(int)ChartGetInteger(0,CHART_WINDOWS_TOTAL);
      //--- Add the SubWindow to the chart
      if(!ChartIndicatorAdd(0,subwindow_number,subwindow_handle))
         Print("Failed to add the SUBWINDOW indicator ! ");
      //--- The subwindow exists
      else
         return(true);
     }
//--- There is no subwindow
   return(false);
  }
Dann fügen wir mithilfe der Funktion AddChartObjectsToSubwindow() Diagrammobjekte zum erstellten Unterfenster hinzu:
//+------------------------------------------------------------------+
//| Adding chart objects to the subwindow                            |
//+------------------------------------------------------------------+
void AddChartObjectsToSubwindow(string clicked_object_name)
  {
   ENUM_TIMEFRAMES tf                 =WRONG_VALUE; // Time frame
   string          object_name        ="";          // Object name
   string          object_text        ="";          // Object text
   int             x_distance         =0;           // X-coordinate
   int             total_charts       =0;           // Total chart objects
   int             chart_object_width =0;           // Chart object width
//--- Get the bar scale and SubWindow height/width
   chart_scale=(int)ChartGetInteger(0,CHART_SCALE);
   chart_width=(int)ChartGetInteger(0,CHART_WIDTH_IN_PIXELS,subwindow_number);
   chart_height=(int)ChartGetInteger(0,CHART_HEIGHT_IN_PIXELS,subwindow_number);
//--- Get the number of chart objects in the SUBWINDOW
   total_charts=ObjectsTotal(0,subwindow_number,OBJ_CHART);
//--- If there are no chart objects
   if(total_charts==0)
     {
      //--- Check if a time frame button has been clicked
      if(CheckClickOnTimeframeButton(clicked_object_name))
        {
         //--- Initialize the array of time frame buttons
         InitializeTimeframeButtonStates();
         //--- Get the time frame button text for the chart object tooltip
         object_text=ObjectGetString(0,clicked_object_name,OBJPROP_TEXT);
         //--- Get the time frame for the chart object
         tf=StringToTimeframe(object_text);
         //--- Set the chart object
         CreateChartInSubwindow(subwindow_number,0,0,chart_width,chart_height,
                                "chart_object_"+object_text,_Symbol,tf,chart_scale,
                                property_button_states[0],property_button_states[1],
                                property_button_states[2],property_button_states[3],
                                property_button_states[4],object_text);
         //--- Refresh the chart and exit
         ChartRedraw();
         return;
        }
     }
//--- If chart objects already exist in the SubWindow
   if(total_charts>0)
     {
      //--- Get the number of clicked time frame buttons and initialize the array of states
      int pressed_buttons_count=InitializeTimeframeButtonStates();
      //--- If there are no clicked buttons, delete the SubWindow
      if(pressed_buttons_count==0)
         DeleteSubwindow();
      //--- If the clicked buttons exist
      else
        {
         //--- Delete all chart objects from the subwindow
         ObjectsDeleteAll(0,subwindow_number,OBJ_CHART);
         //--- Get the width for chart objects
         chart_object_width=chart_width/pressed_buttons_count;
         //--- Iterate over all buttons in a loop
         for(int i=0; i<TIMEFRAME_BUTTONS; i++)
           {
            //--- If the button is clicked
            if(timeframe_button_states[i])
              {
               //--- Get the time frame button text for the chart object tooltip
               object_text=ObjectGetString(0,timeframe_button_names[i],OBJPROP_TEXT);
               //--- Get the time frame for the chart object
               tf=StringToTimeframe(object_text);
               //--- Set the chart object
               CreateChartInSubwindow(subwindow_number,x_distance,0,chart_object_width,chart_height,
                                      chart_object_names[i],_Symbol,tf,chart_scale,
                                      property_button_states[0],property_button_states[1],
                                      property_button_states[2],property_button_states[3],
                                      property_button_states[4],object_text);
               //--- Determine the X-coordinate for the next chart object
               x_distance+=chart_object_width;
              }
           }
        }
     }
//--- Refresh the chart
   ChartRedraw();
  }
Die detaillierten Kommentare im obigen Code helfen Ihnen, die Arbeitsweise der Funktion zu begreifen. Die markierten Zeilen zeigen die benutzerdefinierten Funktionen, auf die wir bislang nicht gestoßen sind.
Die Funktion InitializeTimeframeButtonStates() gibt die Anzahl der angeklickten Timeframe-Buttons aus und initialisiert das entsprechende Array von Zuständen. Sie legt auch die Farbe in Abhängigkeit vom Zustand des Buttons fest:
//+------------------------------------------------------------------+
//| Initializing array of time frame button states and               |
//| returning the number of clicked buttons                          |
//+------------------------------------------------------------------+
int InitializeTimeframeButtonStates()
  {
//--- Counter of the clicked time frame buttons
   int pressed_buttons_count=0;
//--- Iterate over all time frame buttons and count the clicked ones
   for(int i=0; i<TIMEFRAME_BUTTONS; i++)
     {
      //--- If the button is clicked
      if(ObjectGetInteger(0,timeframe_button_names[i],OBJPROP_STATE))
        {
         //--- Indicate it in the current index of the array
         timeframe_button_states[i]=true;
         //--- Set clicked button colors
         ObjectSetInteger(0,timeframe_button_names[i],OBJPROP_COLOR,cOnButtonFont);
         ObjectSetInteger(0,timeframe_button_names[i],OBJPROP_BGCOLOR,cOnButtonBackground);
         //--- Increase the counter by one
         pressed_buttons_count++;
        }
      else
        {
         //--- Set unclicked button colors
         ObjectSetInteger(0,timeframe_button_names[i],OBJPROP_COLOR,cOffButtonFont);
         ObjectSetInteger(0,timeframe_button_names[i],OBJPROP_BGCOLOR,cOffButtonBackground);
         //--- Indicate that the button is unclicked
         timeframe_button_states[i]=false;
        }
     }
//--- Return the number of clicked buttons
   return(pressed_buttons_count);
  }
Die Funktion DeleteSubwindow() ist äußerst simpel: Sie prüft das Vorhandensein des Unterfensters für Diagramme und löscht dieses:
//+------------------------------------------------------------------+
//| Deleting subwindow for chart objects                             |
//+------------------------------------------------------------------+
void DeleteSubwindow()
  {
//--- If the SubWindow exists
   if((subwindow_number=ChartWindowFind(0,subwindow_shortname))>0)
     {
      //--- Delete it
      if(!ChartIndicatorDelete(0,subwindow_number,subwindow_shortname))
         Print("Failed to delete the "+subwindow_shortname+" indicator!");
     }
  }
Nun sollten wir uns die Eigenschaften von Diagrammobjekten ansehen. In anderen Worten: Wir kehren zur Funktion ChartEventObjectClick() zurück und betrachten die Funktion ToggleChartObjectProperty(). Der Name des angeklickten Objekts wird ebenfalls an sie übergeben.
//+------------------------------------------------------------------+
//| Setting/deleting chart object property                           |
//| depending on the clicked button state                            |
//+------------------------------------------------------------------+
bool ToggleChartObjectProperty(string clicked_object_name)
  {

//--- If the "Date" button is clicked
   if(clicked_object_name=="property_button_date")
     {
      //--- If the button is clicked
      if(SetButtonColor(clicked_object_name))
         ShowDate(true);
      //--- If the button is unclicked
      else
         ShowDate(false);
      //--- Refresh the chart and exit
      ChartRedraw();
      return(true);
     }
//--- If the "Price" button is clicked
   if(clicked_object_name=="property_button_price")
     {
      //--- If the button is clicked
      if(SetButtonColor(clicked_object_name))
         ShowPrice(true);
      //--- If the button is unclicked
      else
         ShowPrice(false);
      //--- Refresh the chart and exit
      ChartRedraw();
      return(true);
     }
//--- If the "OHLC" button is clicked
   if(clicked_object_name=="property_button_ohlc")
     {
      //--- If the button is clicked
      if(SetButtonColor(clicked_object_name))
         ShowOHLC(true);
      //--- If the button is unclicked
      else
         ShowOHLC(false);
      //--- Refresh the chart and exit
      ChartRedraw();
      return(true);
     }
//--- If the "Ask/Bid" button is clicked
   if(clicked_object_name=="property_button_askbid")
     {
      //--- If the button is clicked
      if(SetButtonColor(clicked_object_name))
         ShowAskBid(true);
      //--- If the button is unclicked
      else
         ShowAskBid(false);
      //--- Refresh the chart and exit
      ChartRedraw();
      return(true);
     }
//--- If the "Trade Levels" button is clicked
   if(clicked_object_name=="property_button_trade_levels")
     {
      //--- If the button is clicked
      if(SetButtonColor(clicked_object_name))
         ShowTradeLevels(true);
      //--- If the button is unclicked
      else
         ShowTradeLevels(false);
      //--- Refresh the chart and exit
      ChartRedraw();
      return(true);
     }
//--- No matches
   return(false);
  }
Im obigen Code wird der Name des angeklickten Objekts nachfolgend mit dem Namen des mit den Diagrammeigenschaften in Verbindung stehenden Objekts verglichen. Bei Übereinstimmung prüfen wir in der Funktion SetButtonColor(), ob der Button angeklickt ist, und legen die entsprechenden Button-Farben fest.
//+------------------------------------------------------------------+
//| Setting color of button elements depending on the state          |
//+------------------------------------------------------------------+
bool SetButtonColor(string clicked_object_name)
  {
//--- If the button is clicked
   if(ObjectGetInteger(0,clicked_object_name,OBJPROP_STATE))
     {
      //--- Set clicked button colors
      ObjectSetInteger(0,clicked_object_name,OBJPROP_COLOR,cOnButtonFont);
      ObjectSetInteger(0,clicked_object_name,OBJPROP_BGCOLOR,cOnButtonBackground);
      return(true);
     }
//--- If the button is unclicked
   if(!ObjectGetInteger(0,clicked_object_name,OBJPROP_STATE))
     {
      //--- Set unclicked button colors
      ObjectSetInteger(0,clicked_object_name,OBJPROP_COLOR,cOffButtonFont);
      ObjectSetInteger(0,clicked_object_name,OBJPROP_BGCOLOR,cOffButtonBackground);
      return(false);
     }
//---
   return(false);
  }
Die Funktion SetButtonColor() gibt den Zustand des Buttons aus. Abhängig von diesem Attribut informiert das Programm die jeweilige Funktion, dass eine bestimmte Eigenschaft in allen Diagrammobjekten im Unterfenster SubWindow aktiviert oder deaktiviert werden muss. Für jede Eigenschaft wird eine separate Funktion geschrieben. Die entsprechenden Funktionscodes sind nachfolgend aufgeführt:
//+------------------------------------------------------------------+
//| Enabling/disabling dates for all chart objects                   |
//+------------------------------------------------------------------+
void ShowDate(bool state)
  {
   int    total_charts =0;  // Number of objects
   string chart_name  =""; // Chart object name
//--- Check if the SubWindow exists
//    If it exists, then
   if((subwindow_number=ChartWindowFind(0,subwindow_shortname))>0)
     {
      //--- Get the number of chart objects
      total_charts=ObjectsTotal(0,subwindow_number,OBJ_CHART);
      //--- Iterate over all chart objects in a loop
      for(int i=0; i<total_charts; i++)
        {
         //--- Get the chart object name
         chart_name=ObjectName(0,i,subwindow_number,OBJ_CHART);
         //--- Set the property
         ObjectSetInteger(0,chart_name,OBJPROP_DATE_SCALE,state);
        }
      //--- Set the button state to the relevant index
      if(state)
         property_button_states[0]=true;
      else
         property_button_states[0]=false;
      //--- Refresh the chart
      ChartRedraw();
     }
  }
//+------------------------------------------------------------------+
//| Enabling/disabling prices for all chart objects                  |
//+------------------------------------------------------------------+
void ShowPrice(bool state)
  {
   int    total_charts =0;  // Number of objects
   string chart_name  =""; // Chart object name
//--- Check if the SubWindow exists
//    If it exists, then
   if((subwindow_number=ChartWindowFind(0,subwindow_shortname))>0)
     {
      //--- Get the number of chart objects
      total_charts=ObjectsTotal(0,subwindow_number,OBJ_CHART);
      //--- Iterate over all chart objects in a loop
      for(int i=0; i<total_charts; i++)
        {
         //--- Get the chart object name
         chart_name=ObjectName(0,i,subwindow_number,OBJ_CHART);
         //--- Set the property
         ObjectSetInteger(0,chart_name,OBJPROP_PRICE_SCALE,state);
        }
      //--- Set the button state to the relevant index
      if(state)
         property_button_states[1]=true;
      else
         property_button_states[1]=false;
      //--- Refresh the chart
      ChartRedraw();
     }
  }
//+------------------------------------------------------------------+
//| Enabling/disabling OHLC for all chart objects                    |
//+------------------------------------------------------------------+
void ShowOHLC(bool state)
  {
   int    total_charts =0;  // Number of objects
   long   subchart_id =0;  // Chart object identifier
   string chart_name  =""; // Chart object name
//--- Check if the SubWindow exists
//    If it exists, then
   if((subwindow_number=ChartWindowFind(0,subwindow_shortname))>0)
     {
      //--- Get the number of chart objects
      total_charts=ObjectsTotal(0,subwindow_number,OBJ_CHART);
      //--- Iterate over all chart objects in a loop
      for(int i=0; i<total_charts; i++)
        {
         //--- Get the chart object name
         chart_name=ObjectName(0,i,subwindow_number,OBJ_CHART);
         //--- Get the chart object identifier
         subchart_id=ObjectGetInteger(0,chart_name,OBJPROP_CHART_ID);
         //--- Set the property
         ChartSetInteger(subchart_id,CHART_SHOW_OHLC,state);
         //--- Refresh the chart object
         ChartRedraw(subchart_id);
        }
      //--- Set the button state to the relevant index
      if(state)
         property_button_states[2]=true;
      else
         property_button_states[2]=false;
      //--- Refresh the chart
      ChartRedraw();
     }
  }
//+------------------------------------------------------------------+
//| Enabling/disabling Ask/Bid levels for all chart objects          |
//+------------------------------------------------------------------+
void ShowAskBid(bool state)
  {
   int    total_charts =0;  // Number of objects
   long   subchart_id =0;  // Chart object identifier
   string chart_name  =""; // Chart object name
//--- Check if the SubWindow exists
//    If it exists, then
   if((subwindow_number=ChartWindowFind(0,subwindow_shortname))>0)
     {
      //--- Get the number of chart objects
      total_charts=ObjectsTotal(0,subwindow_number,OBJ_CHART);
      //--- Iterate over all chart objects in a loop
      for(int i=0; i<total_charts; i++)
        {
         //--- Get the chart object name
         chart_name=ObjectName(0,i,subwindow_number,OBJ_CHART);
         //--- Get the chart object identifier
         subchart_id=ObjectGetInteger(0,chart_name,OBJPROP_CHART_ID);
         //--- Set the properties
         ChartSetInteger(subchart_id,CHART_SHOW_ASK_LINE,state);
         ChartSetInteger(subchart_id,CHART_SHOW_BID_LINE,state);
         //--- Refresh the chart object
         ChartRedraw(subchart_id);
        }
      //--- Set the button state to the relevant index
      if(state)
         property_button_states[3]=true;
      else
         property_button_states[3]=false;
      //--- Refresh the chart
      ChartRedraw();
     }
  }
//+------------------------------------------------------------------+
//| Enabling/disabling trade levels for all chart objects            |
//+------------------------------------------------------------------+
void ShowTradeLevels(bool state)
  {
   int    total_charts =0;  // Number of objects
   long   subchart_id =0;  // Chart object identifier
   string chart_name  =""; // Chart object name
//--- Check if the SubWindow exists
//    If it exists, then
   if((subwindow_number=ChartWindowFind(0,subwindow_shortname))>0)
     {
      //--- Get the number of chart objects
      total_charts=ObjectsTotal(0,subwindow_number,OBJ_CHART);
      //--- Iterate over all chart objects in a loop
      for(int i=0; i<total_charts; i++)
        {
         //--- Get the chart object name
         chart_name=ObjectName(0,i,subwindow_number,OBJ_CHART);
         //--- Get the chart object identifier
         subchart_id=ObjectGetInteger(0,chart_name,OBJPROP_CHART_ID);
         //--- Set the property
         ChartSetInteger(subchart_id,CHART_SHOW_TRADE_LEVELS,state);
         //--- Refresh the chart object
         ChartRedraw(subchart_id);
        }
      //--- Set the button state to the relevant index
      if(state)
         property_button_states[4]=true;
      else
         property_button_states[4]=false;
      //--- Refresh the chart
      ChartRedraw();
     }
  }
Nun sind alle Funktionen für die Interaktion mit dem Panel bereit. Wir müssen nur noch eine Codezeile zur Hauptfunktion OnChartEvent() hinzufügen:
//+------------------------------------------------------------------+
//| ChartEvent function                                              |
//+------------------------------------------------------------------+
void OnChartEvent(const int id,
                  const long &lparam,
                  const double &dparam,
                  const string &sparam)
  {
//--- The CHARTEVENT_OBJECT_CLICK event
   if(ChartEventObjectClick(id,lparam,dparam,sparam))
      return;

  }
Wenn der Indikator jetzt kompiliert und im Diagramm ausgeführt wird, werden die Diagrammobjekte zum jeweiligen Unterfenster hinzugefügt, wenn die entsprechenden Timeframe-Buttons angeklickt werden. Außerdem können wir die entsprechenden Veränderungen in den Diagrammobjekten sehen, wenn wir auf Buttons von Eigenschaften klicken:
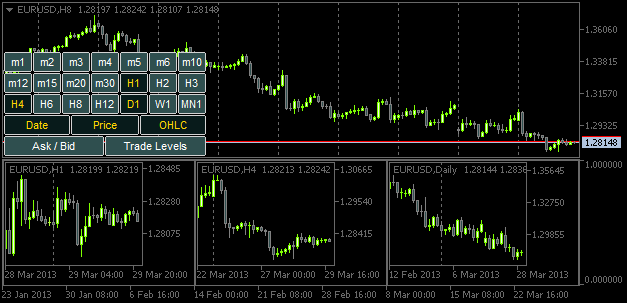
Abb. 5. Hinzufügen von Diagrammobjekten mit festgelegten Eigenschaften
Allerdings werden die Größen von Diagrammobjekten nicht angepasst, wenn die Größe des Diagrammfensters oder Unterfensters verändert wird. Es ist also an der Zeit, das Ereignis CHARTEVENT_CHART_CHANGE zu betrachten.
Genauso, wie wir die Funktion ChartEventObjectClick() für die Verfolgung des Ereignisses "Klick auf ein grafisches Objekt" erstellt haben, schreiben wir nun die Funktion ChartEventChartChange():
//+------------------------------------------------------------------+
//| Event of modifying the chart properties                          |
//+------------------------------------------------------------------+
bool ChartEventChartChange(int id,
                           long lparam,
                           double dparam,
                           string sparam)
  {
//--- Chart has been resized or the chart properties have been modified
   if(id==CHARTEVENT_CHART_CHANGE)
     {
      //--- If the SubWindow has been deleted (or does not exist), while the time frame buttons are clicked,
      //    release all the buttons (reset)
      if(OnSubwindowDelete())
         return(true);
      //--- Save the height and width values of the main chart and SubWindow, if it exists
      GetSubwindowWidthAndHeight();
      //--- Adjust the sizes of chart objects
      AdjustChartObjectsSizes();
      //--- Refresh the chart and exit
      ChartRedraw();
      return(true);
     }
//---
   return(false);
  }
Wenn das Programm festgestellt hat, dass die Größe oder die Eigenschaften des Hauptdiagramms verändert wurden, nutzen wir zuerst die Funktion OnSubwindowDelete(), um zu prüfen, ob das Unterfenster SubWindow gelöscht wurde. Falls das Unterfenster nicht gefunden werden kann, wird das Panel wiederhergestellt.
//+------------------------------------------------------------------+
//| Response to Subwindow deletion                                   |
//+------------------------------------------------------------------+
bool OnSubwindowDelete()
  {
//--- if there is no SubWindow
   if(ChartWindowFind(0,subwindow_shortname)<1)
     {
      //--- Reset the panel with time frame buttons
      AddTimeframeButtons();
      ChartRedraw();
      return(true);
     }
//--- SubWindow exists
   return(false);
  }
Falls das Unterfenster sich an seinem vorgesehenen Ort befindet, werden die Werte der Breite und Höhe des Unterfensters den globalen Variablen in der Funktion GetSubwindowWidthAndHeight() zugewiesen:
//+------------------------------------------------------------------+
//| Saving the SubWindow height and width values                     |
//+------------------------------------------------------------------+
void GetSubwindowWidthAndHeight()
  {
//--- Check if there is a subwindow named SubWindow
   if((subwindow_number=ChartWindowFind(0,subwindow_shortname))>0)
     {
      // Get the subwindow height and width
      chart_height=(int)ChartGetInteger(0,CHART_HEIGHT_IN_PIXELS,subwindow_number);
      chart_width=(int)ChartGetInteger(0,CHART_WIDTH_IN_PIXELS,subwindow_number);
     }
  }
Und zu guter Letzt werden die Größen von Diagrammobjekten in der Funktion AdjustChartObjectsSizes() angepasst:
//+------------------------------------------------------------------+
//| Adjusting width of chart objects when modifying the window width |
//+------------------------------------------------------------------+
void AdjustChartObjectsSizes()
  {
   int             x_distance         =0;           // X-coordinate
   int             total_objects      =0;           // Number of chart objects
   int             chart_object_width =0;           // Chart object width
   string          object_name        ="";          // Object name
   ENUM_TIMEFRAMES TF                 =WRONG_VALUE; // Time frame
//--- Get the SubWindow number
   if((subwindow_number=ChartWindowFind(0,subwindow_shortname))>0)
     {
      //--- Get the total number of chart objects
      total_objects=ObjectsTotal(0,subwindow_number,OBJ_CHART);
      //--- If there are no objects, delete the subwindow and exit
      if(total_objects==0)
        {
         DeleteSubwindow();
         return;
        }
      //--- Get the width for chart objects
      chart_object_width=chart_width/total_objects;
      //--- Iterate over all chart objects in a loop
      for(int i=total_objects-1; i>=0; i--)
        {
         //--- Get the name
         object_name=ObjectName(0,i,subwindow_number,OBJ_CHART);
         //--- Set the chart object width and height
         ObjectSetInteger(0,object_name,OBJPROP_YSIZE,chart_height);
         ObjectSetInteger(0,object_name,OBJPROP_XSIZE,chart_object_width);
         //--- Set the chart object position
         ObjectSetInteger(0,object_name,OBJPROP_YDISTANCE,0);
         ObjectSetInteger(0,object_name,OBJPROP_XDISTANCE,x_distance);
         //--- Set the new X-coordinate for the next chart object
         x_distance+=chart_object_width;
        }
     }
  }
Um das Ereignis der Veränderung der Größe und der Eigenschaften des Hauptdiagramms zu verfolgen, muss der folgende String zur Funktion OnChartEvent() hinzugefügt werden:
Nach dem Kompilieren des Indikators und dem Anhängen an das Diagramm werden Sie sehen können, dass die Diagrammobjekte jedes Mal, wenn die Größe des Hauptfensters verändert wird, an die Größe des Unterfensters angepasst werden.
Fazit
Lassen Sie uns diesen Beitrag an dieser Stelle abschließen. Versuchen Sie als Hausaufgabe, eine Funktion wie die Anpassung von Symbolen in Diagrammobjekten, wenn das Symbol im Hauptdiagramm verändert wird, umzusetzen. Sie sollten auch Timeframes in Diagrammobjekten von klein nach groß (von links nach rechts) anordnen. Diese Möglichkeit wurde in der oben beschriebenen Version des Indikators noch nicht umgesetzt.
In der Beschreibung der vorgefertigten Anwendung TF PANEL finden Sie ein Video, das die Umsetzung dieser Funktionen demonstriert. Die Quelldateien sind an diesen Beitrag angehängt und stehen zum Download zur Verfügung.