Pon "Me gusta" y sigue las noticias
Deje un enlace a él, ¡qué los demás también lo valoren!
Evalúe su trabajo en el terminal MetaTrader 5
- Visualizaciones:
- 212312
- Ranking:
- Publicado:
- 2009.01.26 07:25
- Actualizado:
- 2014.04.21 14:53
-
 Está perdiendo oportunidades comerciales:
- Aplicaciones de trading gratuitas
- 8 000+ señales para copiar
- Noticias económicas para analizar los mercados financieros
Registro EntradaUsted acepta la política del sitio web y las condiciones de uso
Si no tiene cuenta de usuario, regístrese
-
 ¿Necesita un robot o indicador basado en este código? Solicítelo en la bolsa freelance
Pasar a la bolsa
¿Necesita un robot o indicador basado en este código? Solicítelo en la bolsa freelance
Pasar a la bolsa
This indicator plots horizontal lines at daily pivot levels R3, R2, R1, Pivot, S1, S2 & S3, using a day that is advanced (or retarded) from the server time (called Pivot Day). You can see in the illustration, that the pivot lines start earlier than the server time days (except for the most recent day, because it was a weekend).
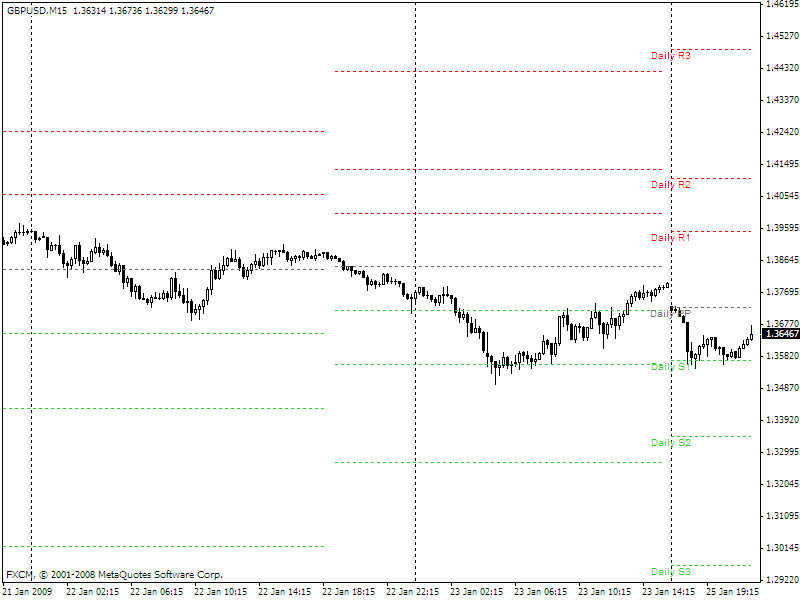
The only input is the integer "ShiftHrs", which gives the number of hours to advance the pivot day. A negative value delays the day for pivot calculation. For example, if your server is on New York time (GMT-5) and you want pivot points in London time (GMT), then ShiftHrs is set to +5 (the default in the code).
Saturday and Sunday trading is not ignored (after all it was real trading). If the pivot day shift results in data appearing on Saturday, it was really Friday where it occured, so the indicator treats it as part of Friday. If the pivot day shift results in data appearing on Sunday, it was really Monday where it occured, so the indicator treats it as Monday.
It uses an indicator buffer for each line, so pivot levels of previous days remain visible. (This has a negative consequence: it is not possible to use the same technique to draw additional intermediate levels (S0.5, S1.5, etc.) because of the limit of 8 buffers.)
Labels are shown for the most recent day's levels.
This indicator can be applied to any chart period, although daily pivots on charts with long periods are meaningless.
The formulae for the caluclations are:
Pivot = ( High + Low + Close ) / 3
Range = High - Low
Resistance1 = 2 * Pivot - Low
Resistance2 = Pivot + Range
Resistance3 = Resistance1 + Range
Support1 = 2 * Pivot - High
Support2 = Pivot - Range
Support3 = Support1 - Range
2009.07.02 Note that I have corrected the calculations for Resistance3 and Support3 in line with the post by substanz. Sorry for the mistake :-(
I would accept any suggestions for improvement.
Jellybean
 Parabolic_Standart2
This code of Parabolic SAR doesn't make the errors when working together with the same second indicator located on the same chart.
Indicator of Peak Price Values
The indicator of peak price values.
Risk/Reward Ratio
Display risk/reward ratio in the chart (UPDATED)
SR Lines by MTF Stochastic Cross
This indicator shows some Support/Resistance lines. The number of lines is variable (max 6). The more support lines are, the stronger "bull" will be expected. It also displays entry signals.These signals may be often disappointing, but sometimes good.