Expert Advisors: MQL5 Wizard - Trade Signals Based on Bullish Harami/Bearish Harami+ Stochastic
Trade the Harami Candlestick Pattern (based on dailyfx article)
Talking Points
- Candlestick analysis can be worked into any active Forex trading strategy.
- The Harami pattern can lead to trend changes and potential breakouts
- Traders can look for profit taking or retracement trading opportunities
Once traders understand the basics, they can then begin to compile a series of candles to form patterns to confirm potential changes and market direction. One of the most used candle patterns is known as the Harami. Today we will review the Harami pattern and how it can be implemented into your trading strategy.
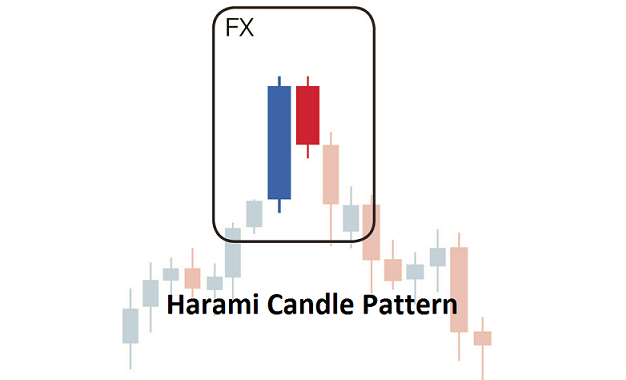
The Harami Candle Pattern
The Harami candle pattern may be new to some but for many it may already
be known as a derivation of an “Inside Bar”. Pictured above we can see a
traditional Harami which can be defined by a few distinct
characteristics. First the Harami is comprised of two candles. The first
candle shoulddepicta large bullish candle such as a bullish engulfing
candle. This blue candle is then followed up by a second smaller candle.
The key to identifying a Harami is to have this second candle not close
outside of the previous candles body. To add validity to the pattern,
the second candle should close above half the traded value of the first
candles body.
A bearish Harami will show a bull market stopping dead in its tracks as
in the example below. However, these patterns can be considered weak,
because even if the pair pulls back after a Harami it does not
necessarily dictate a full market reversal. Because of this, the pattern
often incorporates a third candle for confirmation, creating a Three
Inside Down pattern.
Let’s look at a current example.

Uses in Trading
Above we can see a Bearish Harami in action on the EURCAD currency pair.
The daily graph has been in a long standing established uptrend, but
prices have a tendency to retrace along the way. This last retracement
was started with the formation of a Harami. With its creation, the
market put in its current high then quickly descended 556 pips to for a
higher low on the chart.
Traders looking to take advantage of the Bearish Harami pattern can add
it into any existing trending market plan. Traders can look to take
profits on any existing long trades, or even consider trading a full out
reversal once this pattern appears. Regardless of your trading plan,
when adding new components to your strategy you should be tracking your
results with a trade journal. This way over time you can gauge the
effectiveness of price action and candle analysis in your trading.
- Free trading apps
- Over 8,000 signals for copying
- Economic news for exploring financial markets
You agree to website policy and terms of use
MQL5 Wizard - Trade Signals Based on Bullish Harami/Bearish Harami+ Stochastic:
The MQL5 Wizard allows creating ready-made Expert Advisors based on the Standard library classes delivered together with the client terminal (see Creating Ready-Made Expert Advisors in MQL5 Wizard for the details). It allows to check your trade ideas quickly, all you need is to create your own trading signals class. The structure of this class and example can be found in the article MQL5 Wizard: How to Create a Module of Trading Signals.
The generic idea is the following: the class of trading signals is derived from CExpertSignal, the next, it's necessary to override the LongCondition() and ShortCondition() virtual methods with your own methods.
There is a book "Strategies of best traders" (in Russian), there are many trading strategies are considered there, we will focus on reversal candlestick patterns, confirmed by Stochastic, CCI, MFI and RSI oscillators.
The best way is to create the separate class, derived from CExpertSignal for checking of formation of candlestick patterns. For confirmation of trade signals, generated by candlestick patterns, it's sufficient to write the class, derived from CCandlePattern and add the necessary features (for example, confirmation by oscillators) there.
Here we will consider the signals, based "Bullish Harami/Bearish Harami" reversal candlestick pattern, confirmed by Stochastic indicator. The module of trade signals is based on the CCandlePattern class, it's simple example of its use for creation of trade signals with candlestick patterns.
Author: MetaQuotes Software Corp.