Indicators: Double ZigZag (no repaint)
Good job, flaab..
Thanks for sharing...
Thx for sharing Flaab! :-)
It does show the dot maybe 3-4 bars later though. Is it supposed to do that?
Thx for sharing Flaab! :-)
It does show the dot maybe 3-4 bars later though. Is it supposed to do that?
Forum on trading, automated trading systems and testing trading strategies
newdigital, 2013.09.26 08:26
The Zig-Zag indicator is extremely useful for determining price trends, support and resistance areas, and classic chart patterns like head and shoulders, double bottoms and double tops. The Zig-Zag indicators uses both swing highs and swing lows in its calculation:
- Swing Highs: When a price (usually close) is both higher than the price previous to it and after it.
- Swing Lows: When a price is both lower than the price prior to it and lower than the price following it.
The Zig-Zag indicator can use both percentages or points in its construction. To construct the Zig-Zag indicator, there must be a certain percentage or number of points between a swing high and a swing low before a line will be drawn. The chart below of the E-mini Nasdaq 100 Futures contract visually illustrates the difference between a price retracement Zig-Zag of 3% and a price retracement Zig-Zag of 5%:
Notice how in the chart above that a Zig-Zag with a retracement percentage of 3%
makes more distinct lines than the Zig-Zag with a retracement percentage of 5%.
The purpose of using a Zig-Zag with a larger retracement percentage is to help
eliminate price noise that is not significant for the trader's analysis.
Zig-Zag indicator is extremely effective at uncovering stock cycles while screening out short-term price noise.
The Zig-Zag indicator is extremely effective in filtering short-term noise and identifying significant trends and significant changes in market prices.
Below is a chart of the E-mini S&P 500 Futures contract that illustrates how effective the Zig-Zag indicator was in finding areas of support and resistance and price breakouts:
The chart above of the e-mini uses a 5% Zig-Zag retracement value; therefore, only price changes of 5% or greater are shown, helping a long-term trader or investor determine important areas of support, resistance, and areas of price breakouts.
On the left of the chart, the S&P 500 was forming a triangle consolidation pattern. When prices broke resistance, a long-term buy was generated. During the middle of the chart, the Zig-Zag indicator was effective in illustrating that the S&P 500 was in an upward price channel. Buying in areas where price touched the lower support trendline and selling when prices touched the upper resistance line would have proved extremely profitable.
Using the Zig-Zag indicator for shorter-term trades can prove profitable as well. The chart below of Intel (INTC) shows a classic chart head and shoulder pattern easily seen by the Zig-Zag indicator ($1 retracement):
The easily identified head and shoulders pattern gave a sell signal when price on the right shoulder broke the upward slanting trendline.
The Zig-Zag indicator is an excellent technical analysis tool for identifying classic charting patterns. The Zig-Zag indicator is also effective in reducing noise and helping the technical trader see the true market direction.
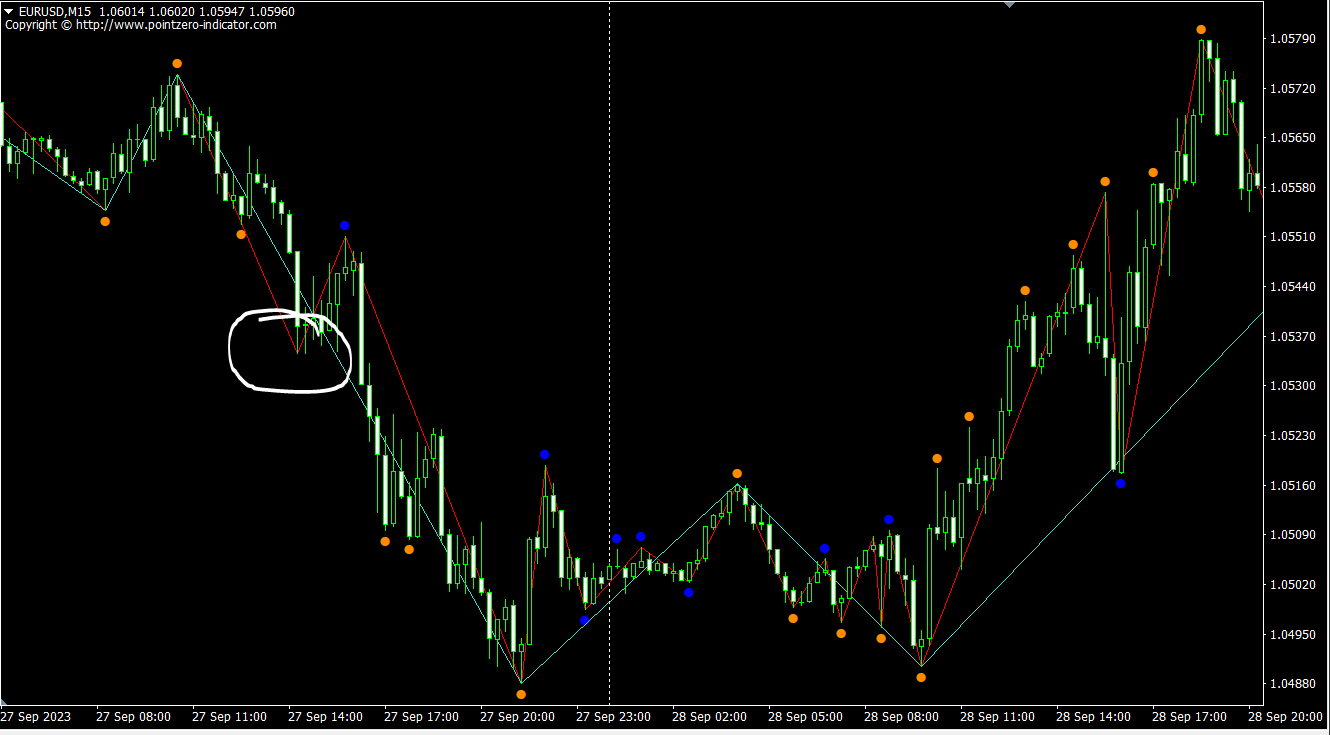
Thanks for sharing. But, when back testing i found this weird behavior where there is a ZigZag leg but no indication from the double zigzag indicator of yours.
I think the solution is related to the way you have defined your fractals in which changing the rules of how the fractal is formed will fix the problem.
double upper_fractal(int shift = 1)
{
   double middle = iHigh(Symbol(), 0, shift + 2);
   double v1 = iHigh(Symbol(), 0, shift);
   double v2 = iHigh(Symbol(), 0, shift+1);
   double v3 = iHigh(Symbol(), 0, shift + 3);
   double v4 = iHigh(Symbol(), 0, shift + 4);
   if(middle > v1 &&
      middle >= v2 &&
      middle >= v3 &&
      middle > v4
      //&& v2 > v1 && v3 > v4 // Uncomment me for perfect fractals
      )
   {
      fr_resistance = middle;
      fr_resistance_change = true;
   } else {
      fr_resistance_change = false;
   }
   return(fr_resistance);

//////

double lower_fractal(int shift = 1)
{
   double middle = iLow(Symbol(), 0, shift + 2);
   double v1 = iLow(Symbol(), 0, shift);
   double v2 = iLow(Symbol(), 0, shift+1);
   double v3 = iLow(Symbol(), 0, shift + 3);
   double v4 = iLow(Symbol(), 0, shift + 4);
   if(middle < v1 &&
      middle <= v2 &&
      middle <= v3 &&
      middle < v4
      //&& v2 < v1 && v3 < v4  //Uncomment me for perfect fractals
      )
   {
      fr_support = middle;
      fr_support_change = true;
   } else {
      fr_support_change = false;
   }
   return(fr_support);
}
- Free trading apps
- Over 8,000 signals for copying
- Economic news for exploring financial markets
You agree to website policy and terms of use
Double ZigZag (no repaint):
Author: Point Zero