Good job.
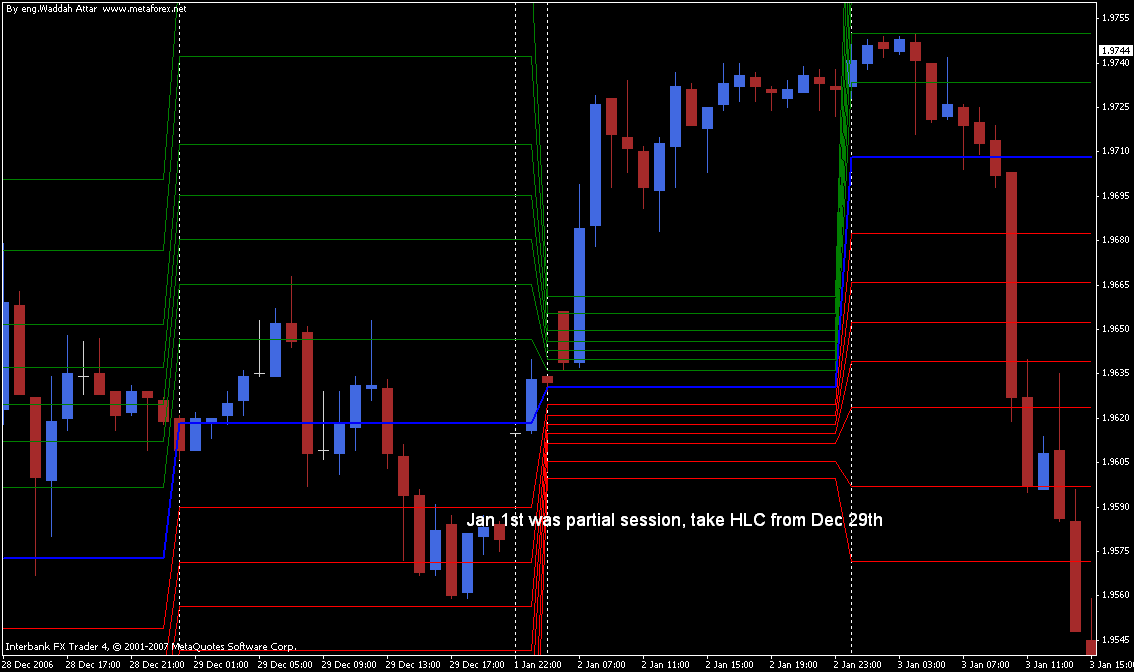
Some users with brokers having a sunday bar have a little problem on mondays.
If you could add some feture to fix that would be great. Fo mondays you can use TimeDayOfWeek instead of simple iHigh/Ilow/iClose.
First of all, I would like to thank brother Attar for this wonderful tool he offered us. Indeed its very helpful, especially when combined with the camarilla levels etc. Thumbs up!! You are doing a great job.
As for the bug posted by linuxser, I also agree with it and I hope to see a fix from you soon. Here is a screenshot if it may help.
God Bless You
Ma'salaam
Hi :)
Good job.
Some users with brokers having a sunday bar have a little problem on mondays.
If you could add some feture to fix that would be great. Fo mondays you can use TimeDayOfWeek instead of simple iHigh/Ilow/iClose.
thank you for reply
I fix this problem
and i wait publish it
Hi all,
First of all, I would like to thank brother Attar for this wonderful tool he offered us. Indeed its very helpful, especially when combined with the camarilla levels etc. Thumbs up!! You are doing a great job.
As for the bug posted by linuxser, I also agree with it and I hope to see a fix from you soon. Here is a screenshot if it may help.
God Bless You
Ma'salaam
thank you for your reply
I wish the new version is free bugs
Hi :)
Good job.
Some users with brokers having a sunday bar have a little problem on mondays.
If you could add some feture to fix that would be great. Fo mondays you can use TimeDayOfWeek instead of simple iHigh/Ilow/iClose.
The new version is here:
http://www.metaforex.net/download.php?file=Waddah_Attar_Pivot_Fibo.zip

You are a prolific writer of code. I have a request and hopefully an easy one for you. I would like a support and resistance indicator that when applied to any timeframe chart, would place 2 support and 2 resistance lines on the chart. These lines would be based on the two most significant each of support and resistance, specific to that timeframe chart, and calculated from a user selected period of intervals for the data. As each time interval for the timeframe closed, the farthest back interval of data would be dropped and the current just closed interval of data would be added, and the lines redrawn based on any change in the 2 support and 2 resistance values. For example, the user could select 25, 50, 100, etc. time intervals of data for the calculations, which would be repeated at the close of each interval. I can only suppose the S and R values would be at the two "most popular" prices below and the two "most popular" prices above the current price, based on the users selected number of intervals for the calculations. As the current price moved up or down, at some point the S1/R1 level would move once the current price hit them. Same for the S2/R2 level...it would move once the current price had made a big move to that level.
I hope I have explained clearly. The S&R lines would be calculated based on a user selected number of intervals. There would be different levels shown on different timeframe charts. On any timeframe chart, the displayed levels would be recalculated at the close of each interval, and with movement in the current price, these lines would tend to "float". But big moves in the current price would cause these lines to be "hit" and then pop farther away.
Is such an indicator for timeframe specific S&R lines across the chart, based on user selected number of intervals in that timeframe for the calculations to be based on? I suppose 3 support and 3 resistance lines are possible, but if they "float" as the price moves towards them and hits them, would 3 of each even be needed?
- Free trading apps
- Over 8,000 signals for copying
- Economic news for exploring financial markets
You agree to website policy and terms of use
Waddah Attar Pivot Fibo Dayly Indicator:
Author: waddah attar