Join our fan page
- Views:
- 59050
- Rating:
- Published:
- 2011.08.08 10:44
- Updated:
- 2016.11.22 07:32
-
Need a robot or indicator based on this code? Order it on Freelance Go to Freelance
Author:
maj1es2tic (Tim Welch)
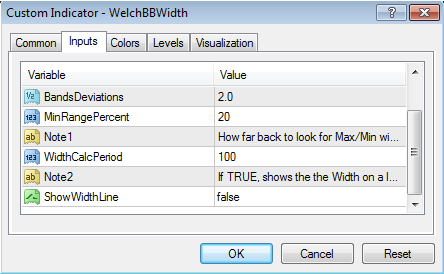
This indicator takes the current Width of the Bollinger Bands and compares it to the Maximum and Minimum Width of the Bollinger Bands over N periods (WidthCalcPeriod).
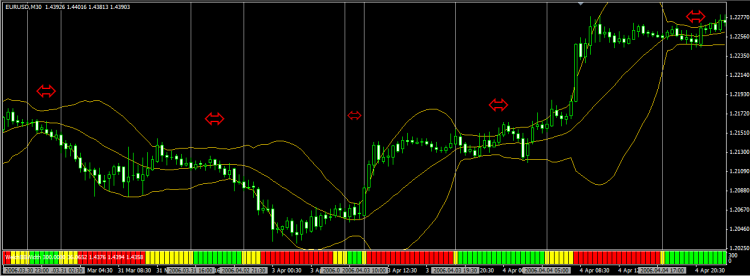
If the calculated percentage is less than or equal to MinRangePercent, then the histogram shows Green. If the calculated percentage is 2x the MinRangePercent, then the histogram shows Yellow. If neither of those match, the histogram shows Red.
This works out well to quickly see if the currency pair is ranging, or about to break out of range. If you set ShowWidthLine to true, then it will also show a line with the actual width of the Bollinger Bands in PIPS. This should work for 4 and 5 digit brokers and it works on all currency pairs.
Using iCustom to pull out values for an Expert Advisor or other Custom Indicators:
You should be able to pull out any of the values externally using the following code:
int period=0; // how far back do you want to look? 0 == current bar. 1 == previous bar, etc.
              // At any given time, only one of these 3 will have a value greater than 0. That value is 300.

double WelchBBWidth_Green = iCustom(NULL, 0, "WelchBBWidth", 20, 0, 2.0, 20, "x", 100, "x", false, 0, period);
double WelchBBWidth_Yellow = iCustom(NULL, 0, "WelchBBWidth", 20, 0, 2.0, 20, "x", 100, "x", false, 1, period);
double WelchBBWidth_Red = iCustom(NULL, 0, "WelchBBWidth", 20, 0, 2.0, 20, "x", 100, "x", false, 2, period);

// This will give you the actual width in PIPs of the Bollinger Bands
double WelchBBWidth = iCustom(NULL, 0, "WelchBBWidth", 20, 0, 2.0, 20, "x", 100, "x", false, 3, period);

// These will give you the actual Bollinger Band Line values.
// These are the values that would be plotted on the MAIN chart, so it's based on price on the chart.
double WelchBBWidth_MiddleLine = iCustom(NULL, 0, "WelchBBWidth", 20, 0, 2.0, 20, "x", 100, "x", false, 4, period);
double WelchBBWidth_UpperLine = iCustom(NULL, 0, "WelchBBWidth", 20, 0, 2.0, 20, "x", 100, "x", false, 5, period);
double WelchBBWidth_LoweLine = iCustom(NULL, 0, "WelchBBWidth", 20, 0, 2.0, 20, "x", 100, "x", false, 6, period);
You could put something like this in your Expert Advisor:
/*
* int areWeRanging(int period=0)
*
* Returns 1 for GREEN (ranging)
* Returns -1 for YELLOW ( start/end of range)
* Returns 0 otherwise (no range)
*/

int areWeRanging(int period=0)
{
 double WelchBBWidth_Green = iCustom(NULL, 0, "WelchBBWidth", 20, 0, 2.0, 20, "x", 100, "x", false, 0, period);
 double WelchBBWidth_Yellow = iCustom(NULL, 0, "WelchBBWidth", 20, 0, 2.0, 20, "x", 100, "x", false, 1, period);

 if ( WelchBBWidth_Green > 0 )
 {
   return (1);
 }
 else if ( WelchBBWidth_Yellow > 0)
 {
   return (-1);
 }

 return (0);
}

// Check to see if we are coming out of a range.
// This tells us that the LAST candle was still in a range,
// but the current candle is now breaking free of the range.
if ( areWeRanging(1)==1 && (areWeRanging(0)==-1 || areWeRanging(0)==0) )
 {
  Print("We were ranging, but have now broken out of the range! Make a trade if other indicators confirm the breakout!");
 }
** Use any/all code at your own discretion, and only place real trades when you have confirmation of other indicators. **
Image:

*NOTE: The dark grey vertical lines and red arrows were added to show the correlation of the indicator to the bollinger bands on the chart and they will NOT show up on your chart.
Enjoy!
-Tim
 EMAplusWPR_V2
Expert advisor that trade in the trend of EMA and buy/sell signals get from Williams %R
 Tester v_0.14
Example of using optimization reports in an Expert Advisor.
 GMail Reader using MQL and wininet
This script reads your unread GMail messages.
 Statement To Chart
Just a simple script , that reads the HTML file a report , or detailed report , and draws a transaction from it on the chart

