

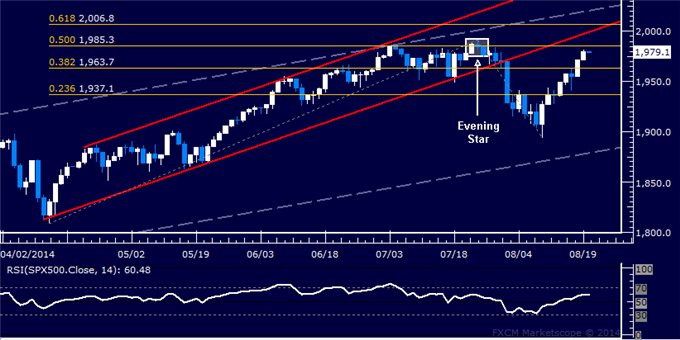
Prices broke above the 38.2% Fibonacci expansion at 1963.70, exposing the 1985.30-91.40 area marked by the 50% level and the July 24 high. A further push beyond that aims for channel floor support-turned-resistance at 1999.10. Alternatively, a turn back below at 1963.70 targets the 23.6% Fib at 1937.10.
By the way, The S&P 500 advanced 9.86 points, or 0.5%, to close at 1,981.60, while the Dow industrials rose 80.85 points, or 0.5%, to end at 16,919.59. The S&P 500 stands 0.3% off its July 24 record close at 1,987.98, recovering from its drop in late July and early August.


