"Oops. I did it again"
If you have returned back to the future 3 times, as it was in the series of my blog posts (Part I, Part II, Part III), it becomes a habit, and the next 4-th time of travelling into the future seems very natural.
As usual, the future is specific. It's all about quotes. And this time I'll show you how to predict the future by means of another - a brand new - indicator - MetaWaves.
The idea of this indicator comes to my mind when I read about MW waves of Arthur Merrill. (You may find one of his first articles on the subject - "Merrill MW Waves" - in the Stocks & Commodities magazine for November 1991.) He introduced a set of price figures formed by 4 successive price swings (which obviously resemble M or W letters), and calculated probabilities of future price action for every pattern. This gave some rules useful for future price prediction. This is reflected in many related and well-known concepts - such as Elliott Waves and named figures ("head and shoulders", "triangle", "broadening", etc).
It's obvious that ZigZag indicator is a great detector of price swings, so it can be used to extract M and W figures from quotes. But the next question is whether we need the predefined table of the waves or not.
My answer is no. Instead of the table, one could look up existing history of quotes and extract any similar M and W patterns automatically using pure statistics of their occurence and some gven threshold of similarity.
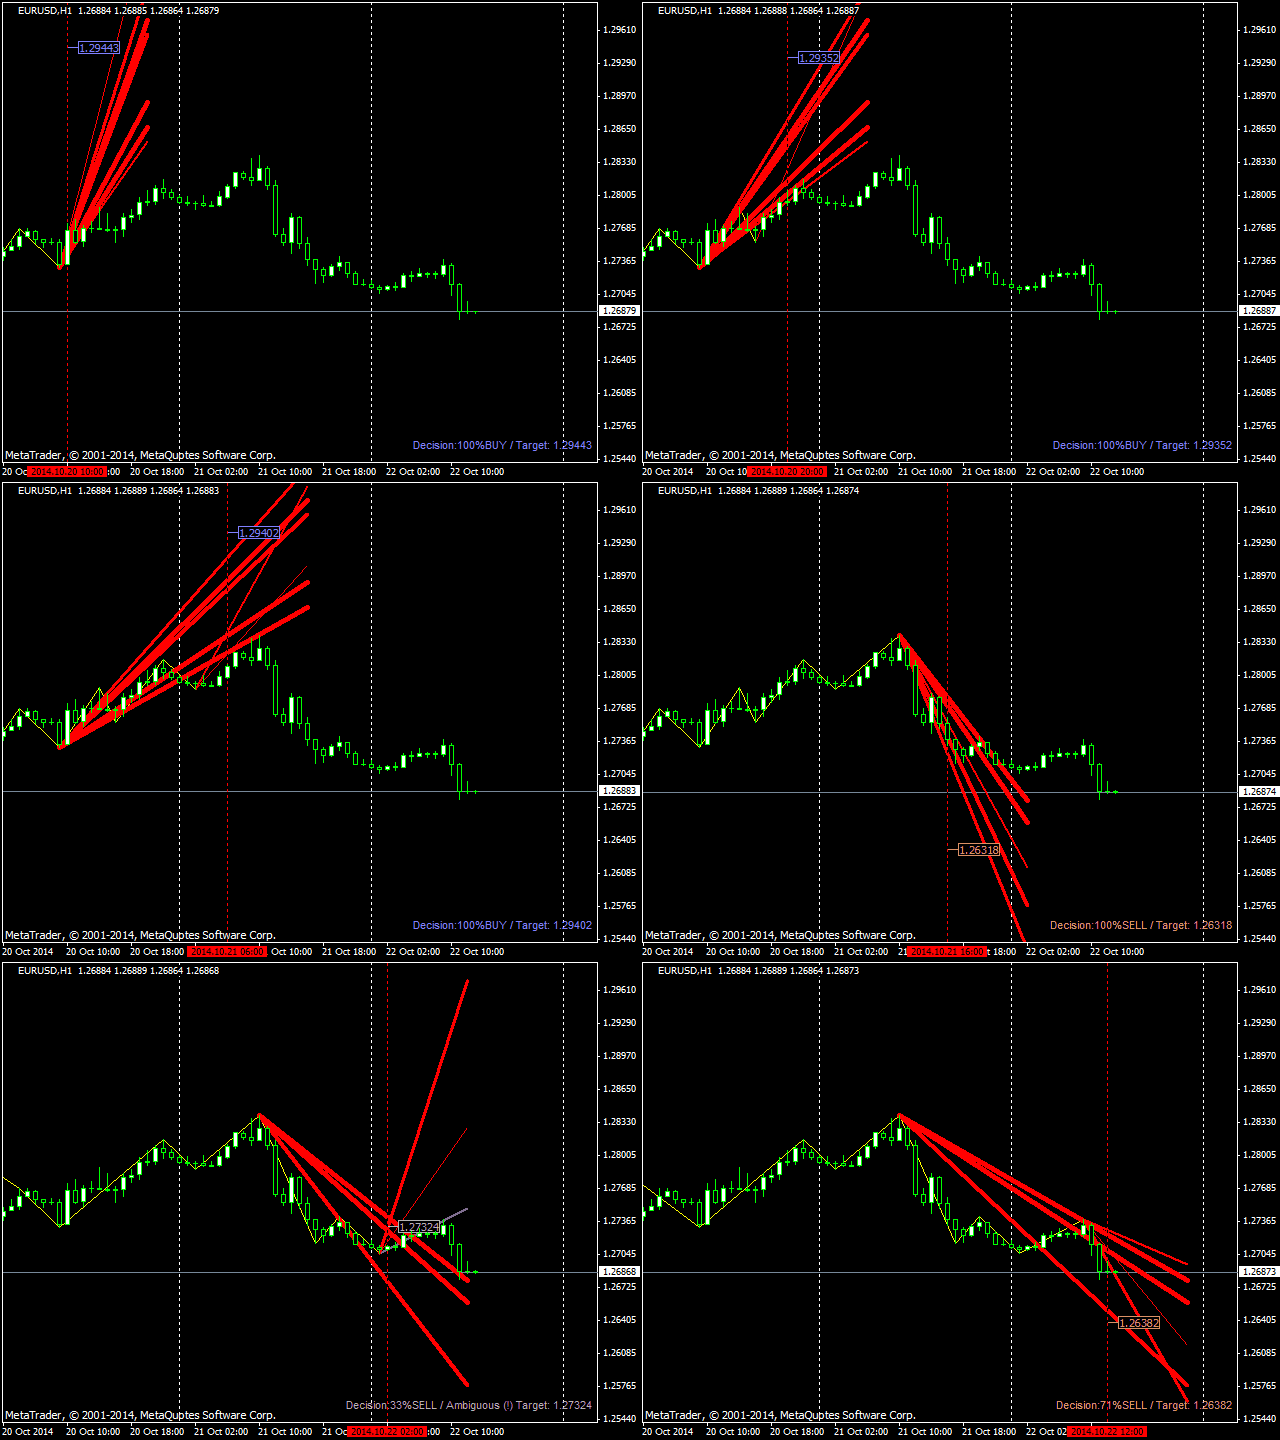
As a result the indicator MetaWaves has been created. One picture is worth a hundred words, so lets look how it works in the animation below.

The vertical dotted line is the divider between the past known to the indicator, and the future (there is Offset parameter in the indicator for analyzing its perfomance in the past).
You see how it draws future edges for 7 different ZigZags, calculates average target price, and displays a relative signal strength in the corner.
Red edges are built on sufficient statistics and taken into account, while gray edges are for those ZigZags which currently form very rare figures with insufficient statistics in the history (you may consider them as a complementary forecast). The width of lines indicates relative size of corresponding ZigZag range - the larger the range the wider its line. Actual ranges are mentioned in a tooltip when you hover mouse cursor over a line.
Yellow broken line in the past is a superposition of all ZigZags' extremums which were processed in 7 latest M and W figures of different ranges, it's shown for reference only. If you want to see ZigZags themselves, you may use a standalone HZZM indicator, which is internally used by MetaWaves for gathering the statistics.
The indicator's decision is shown in the corner - it tells you if it's ok to buy or sell, and also provides you with an estimated target price as an average of red edges' ending points. Sometimes the majority of future ZigZag extremums may show one direction, but the calculated target results an opposite direction. In such cases the indicator marks its decision as "ambiguous". In other cases number of bearish and bullish signals may be equal to each other. In such cases the indicator marks its decision as "blank". And sometimes there can be no statistics for currently forming price figure, so the indicator reports "No decision". But most of the time you'll get a forecast.
Of course, this is just a prediction, not the future itself, but I hope MetaWaves will be very helpful in trading. Let the future show.


