Русский 中文 Español Deutsch 日本語 Português 한국어 Français Italiano Türkçe
Creating Expert Advisors Using Expert Advisor Visual Wizard

Creating Expert Advisors Using Expert Advisor Visual Wizard

MetaTrader 5Examples | 16 January 2012, 10:02
14 989 1
molanis
molanis


Introduction

Expert Advisor Visual Wizard for MetaTrader 5 provides a highly intuitive graphical environment with a comprehensive set of predefined trading blocks that let you design Expert Advisors in minutes. No coding, programming or MQL5 knowledge is required.

The click, drag and drop approach of Expert Advisor Visual Wizard allows you to create visual representations of forex trading strategies and signals as you would with pencil and paper. These trading diagrams are analyzed automatically by Molanis’ MQL5 code generator that transforms them into ready to use Expert Advisors. The interactive graphical environment simplifies the design process and eliminates the need to write MQL5 code.

With Expert Advisor Visual Wizard you only need to follow a 3 step process:

Fig. 1. Using  Expert Advisor Visual Wizard

Fig. 1. Using Expert Advisor Visual Wizard


1. Developing a Trading Diagram

A trading diagram is a graphical representation of an Expert Advisor. It shows the ‘flow’ through a trading decision system. Trading diagrams are made of trading blocks that are connected to create complex Expert Advisors.

To create a trading diagram, you only need to add the trading blocks, set their configuration parameters and make the necessary connections.

Moving Average Strategy

Typically, two moving averages can be used to create an Expert Advisor with these trading conditions:

  • Buy when the short period moving average is above the long period moving average (red line is above the green line)
  • Sell when the short period moving average is below the long period moving average (red line is below the green line)
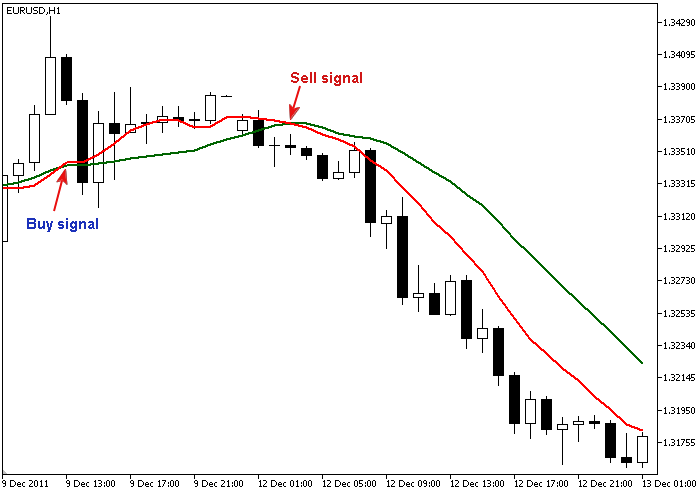
Fig. 2. Buy and Sell signals

Fig. 2. Buy and Sell signals

Instead of spending a long time coding this EA, with Expert Advisor Visual Wizard you can create a trading diagram that represents the moving average strategy in seconds.

Launch Expert Advisor Visual Wizard:
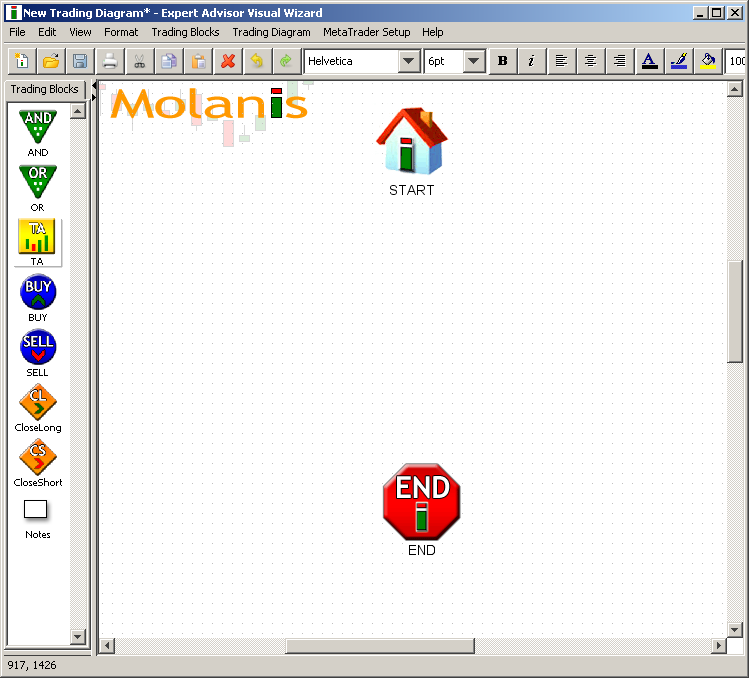
Expert Advisor Visual Wizard

Fig. 3. Expert Advisor Visual Wizard


A. Just drag and drop two Technical Analysis blocks into the trading diagram:
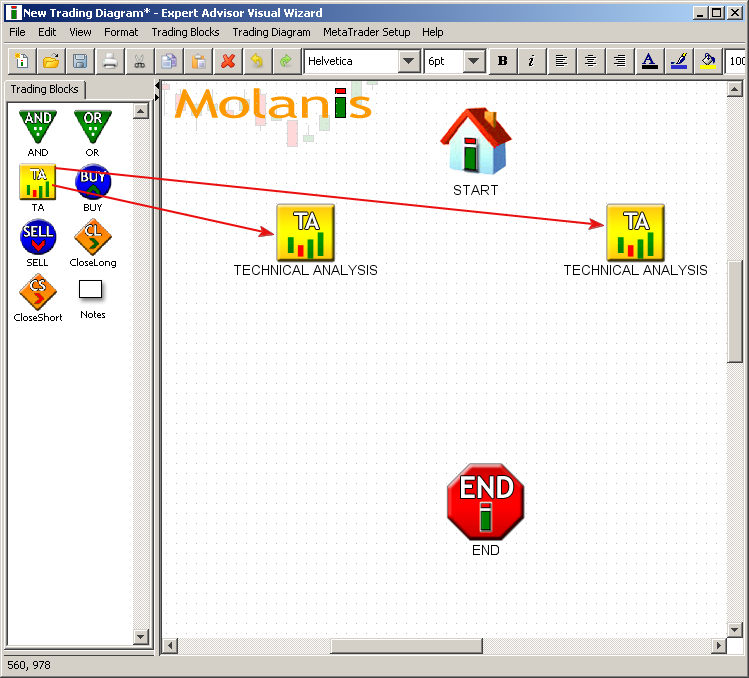
Fig. 4. Adding TA boxes

Fig. 4. Adding TA blocks

To define the moving average trading conditions, click on the TA icon and select the options as shown in the pictures:

Options to go long (or buy):
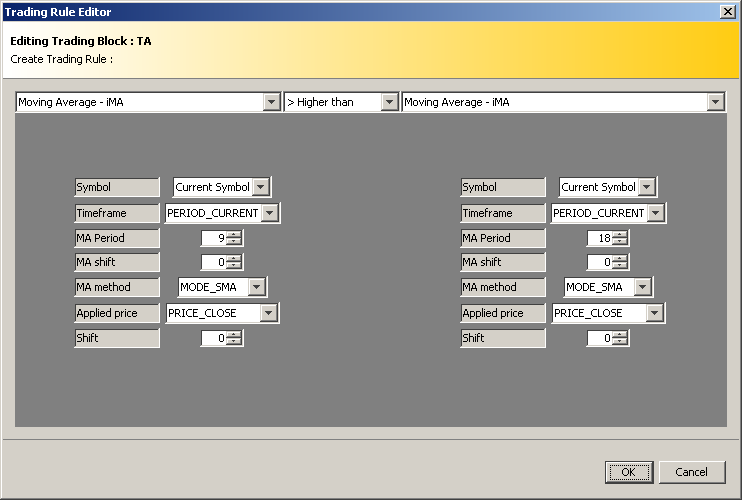
Fig. 5. Options to go long (buy)

Fig. 5. Options to go long (buy)

Options to go short (or sell):
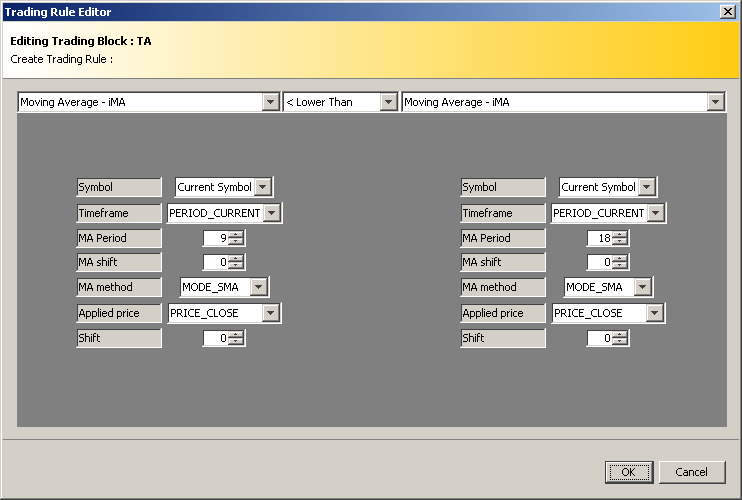
Fig. 6. Options to go short (or sell)

Fig. 6. Options to go short (or sell)

B. Drag and drop one BUY block and one SELL block:
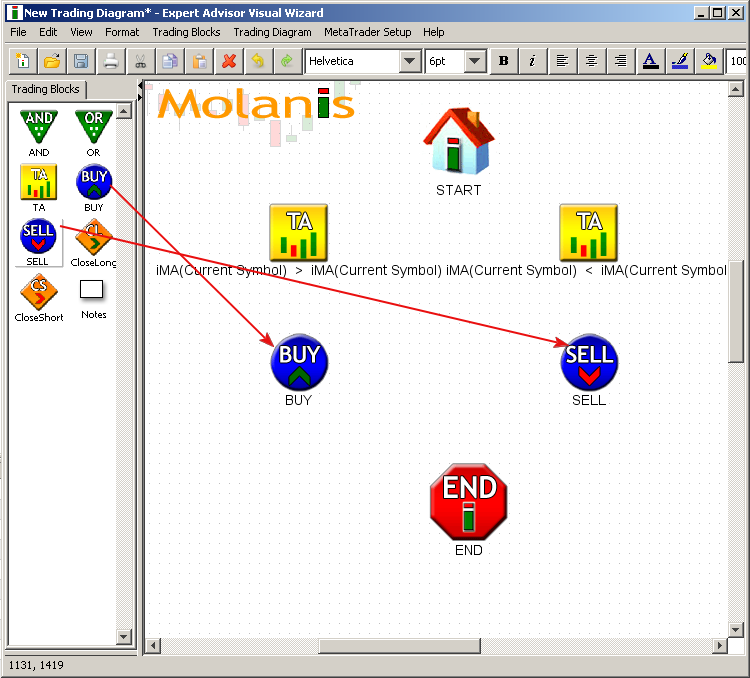
Fig. 7. Adding Buy and Sell blocks

Fig. 7. Adding Buy and Sell blocks


Click on the BUY icon to define the lot size, take profit, stop loss, and trailing stops for your EA as shown in the picture:
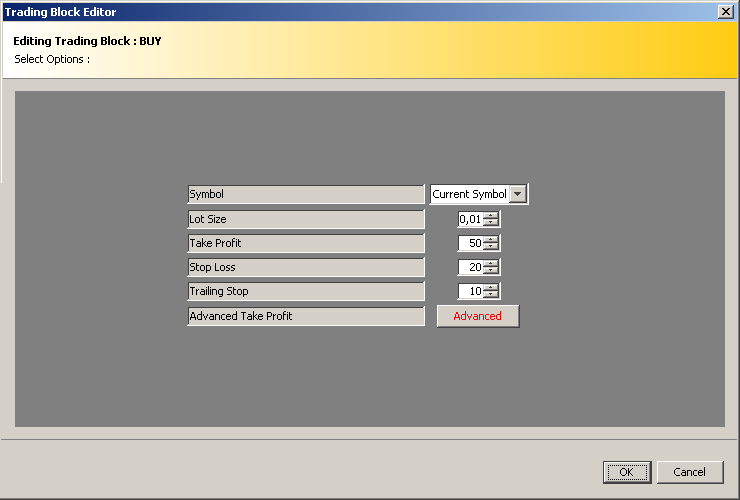
Fig8_Buy_options

Fig. 8. Options of Buy trading block


Repeat the same procedure for the SELL icon:
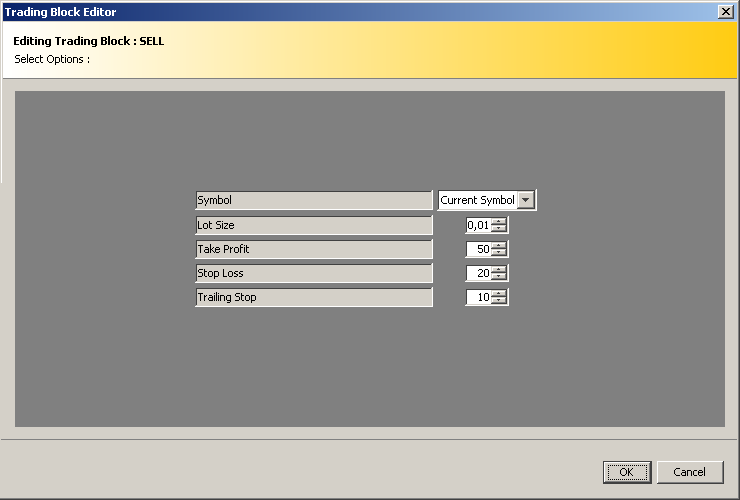
Fig. 9. Options of Sell trading block

Fig. 9. Options of Sell trading block


C. Connect all the blocks to get a trading diagram like the following:
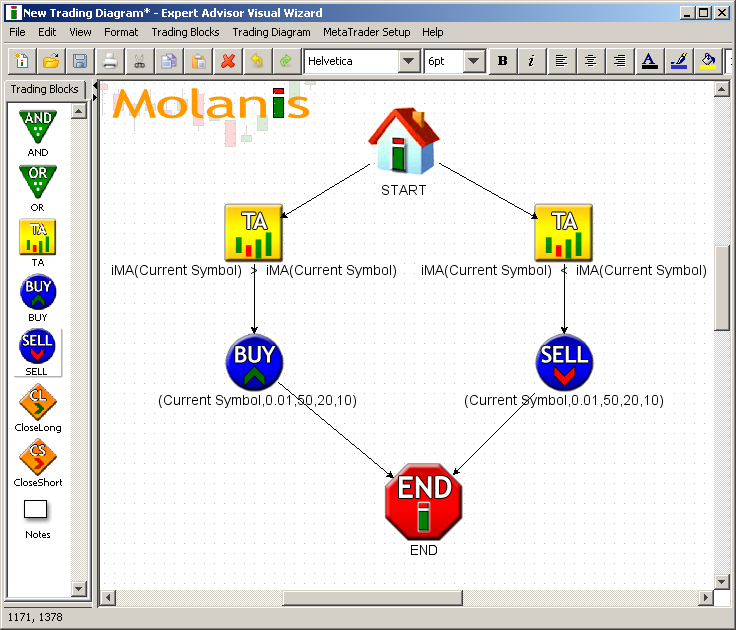
 

Fig. 10. Connected Blocks

Fig. 10. Connected blocks


2. Generating the Expert Advisor

After the trading diagram is complete you need to generate the EA clicking on Generate MQL5 Code in Trading Diagram of the main menu:
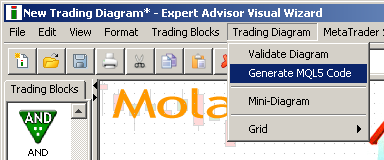
Fig. 11. Generate MQL5 code

Fig. 11. Generate MQL5 code


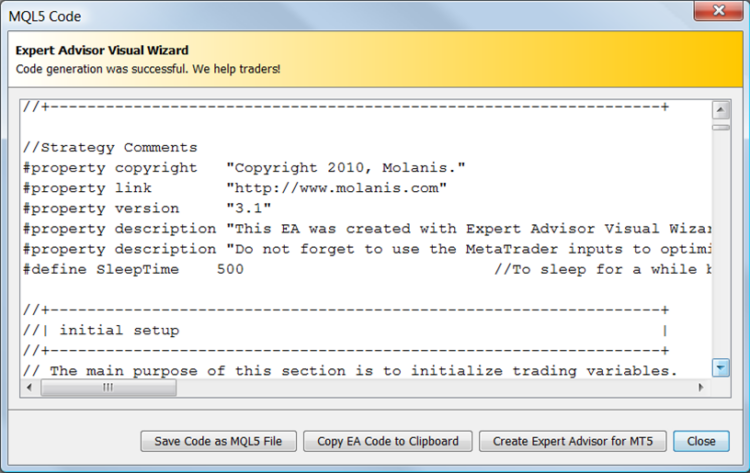
The EA Visual Wizard transforms your trading diagram into a fully working EA. It also gives you access to the EA’s MQL5 code:


Fig. 12. MQL5 code generated

Fig. 12. MQL5 code generated


3. Trading with MetaTrader 5

After you generate the EA it will be available in MetaTrader 5 for you to trade. Just attach it to a chart to start trading.
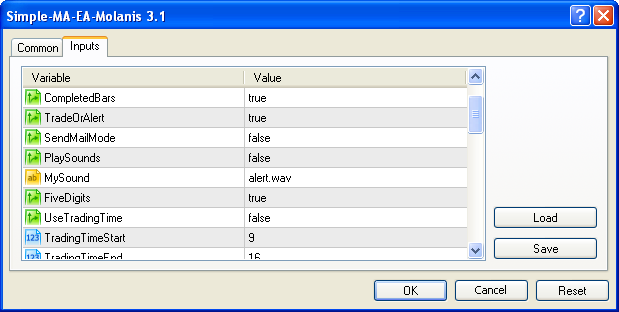
Fig. 13 Expert Advisor input parameters

Fig. 13 Expert Advisor input parameters

All expert advisors generated with Molanis’ software have MetaTrader variables to manage:

  • Trading bars or ticks;
  • Alert mode (Does not trade but gives signals);
  • 4 or 5 decimals;
  • Time filter;
  • ECN orders;
  • Maximum volume size;
  • Maximum percentage at risk;
  • Lot size management.

4. Creating Expert Advisors that use Custom Indicators

Breakthrough of the Price Channel Range Strategy

EA logic: Positions are opened when the price pierces the borders of the Price Channel. To create this Expert Advisor we need to use the custom indicator Price Channel by Sergey Gritsay.

You can add any well-written custom indicator into the EA Visual Wizard with the Import Custom Indicator button.

Under a TA block, select Custom Indicator – iCustom, and then click on Import Custom Indicator.
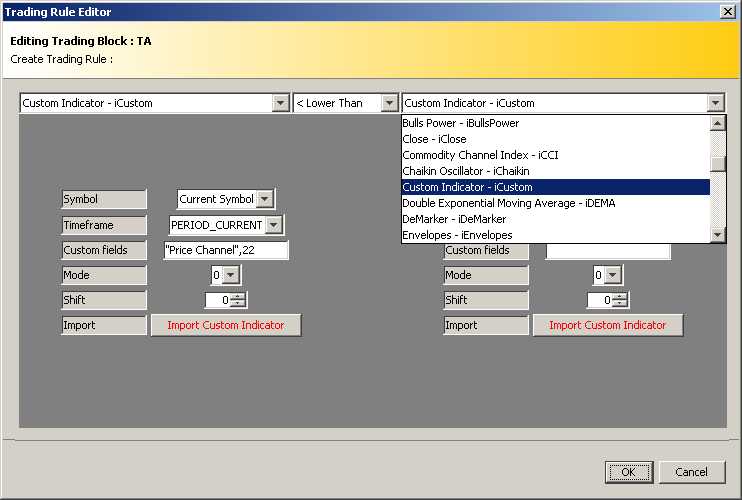
Fig. 14. Editing a trading condition

Fig. 14. Editing a trading condition

Select the custom indicator you want to import.

Custom indicators must be located in the indicators directory (terminal_data_folder_\MQL5\Indicators).
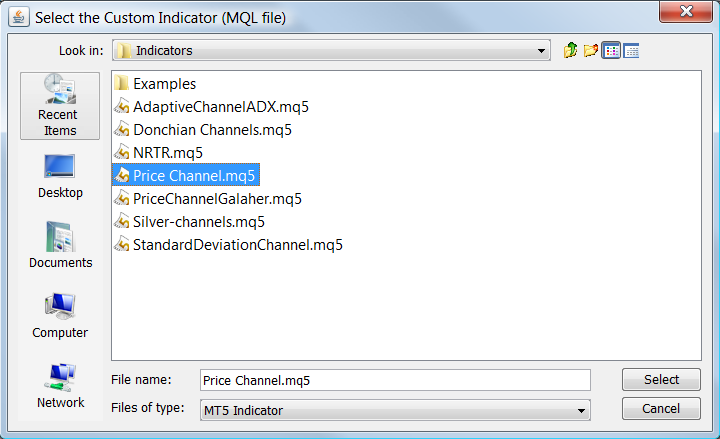
Fig. 15. Importing custom indicator 

Fig. 15. Importing custom indicator

The import custom indicator feature reads the indicator code and based on standard rules of coding gets the number of modes (signals) and the indicator parameters. This feature cannot select the mode or shift for you. It's your job to know the right signal and parameters for your EA.

Fig. 16. Indicator was imported

Fig. 16. Indicator was imported

After you finish importing the custom indicator, you can use it to define trading conditions in your Expert Advisor.

For sell:
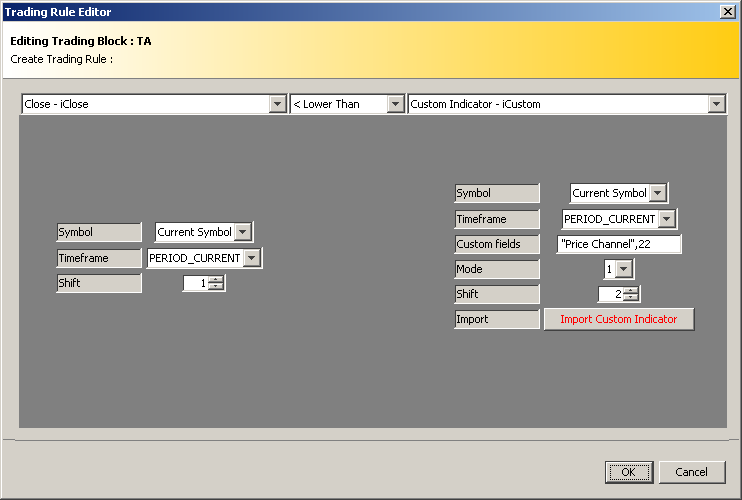
Fig. 17. Trading conditions for sell

Fig. 17. Trading conditions for sell

For buy:
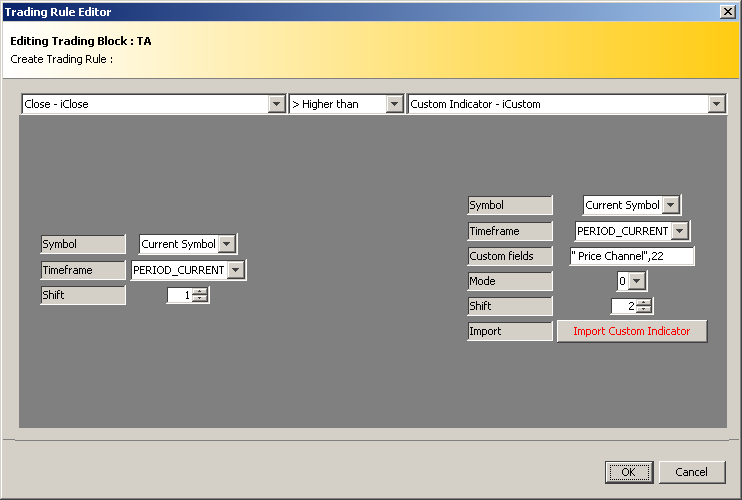

Fig. 18. Trading conditions for buy

Fig. 18. Trading conditions for buy

Now, just create a setup like the one and you are done.
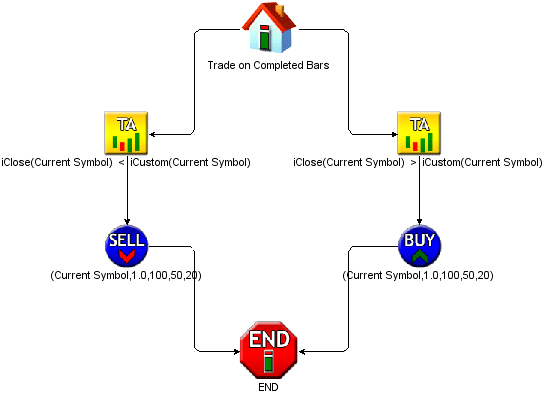

Fig. 19. The Expert Advisor diagram

Fig. 19. The Expert Advisor diagram


Conclusion

The EA Visual Wizard is a great tool to create Expert Advisors in minutes. We have developed 15 examples based on the 20 Trade Signals in article "20 Trade Signals in MQL5". I encourage readers to review them at our examples page.

I am attaching the code for the Example 1 - simple moving average strategy explained in part 1 of this article. Example 7, Breakthrough of the Price Channel Range was used to explain the import process for part 4 of this article.

Read about the 15 examples

  1. Simple moving average;
  2. Multi-Currency Simple moving average;
  3. Multi-timeframe Simple moving average;
  4. Multi-timeframe Advanced Simple moving average;
  5. Moving Average Crossover;
  6. Intersection of the Main and Signal Line of MACD;
  7. Breakthrough of the Price Channel Range;
  8. RSI indicator Overbuying/Overselling strategy;
  9. Exit from the Overbuying/Overselling Zones of CCI;
  10. Exit from the Overbuying/Overselling Zones of Williams Percentage Range;
  11. Bounce from the Borders of the Bollinger Channel;
  12. ADX Adaptive Channel Breakthrough (Uses a custom Indicator);
  13. Bounce from the Borders of the Standard Deviation Channel (Uses a custom Indicator);
  14. NRTR Change of Trend (Uses a custom Indicator);
  15. Detect Change of Trend using the Adaptative Moving Average (AMA) indicator.

Attached files |
Last comments | Go to discussion (1)
surubabs Suresh Kakkattil
surubabs Suresh Kakkattil | 26 Jan 2013 at 04:43
MetaQuotes:

New article Creating Expert Advisors Using Expert Advisor Visual Wizard is published:

Author: molanis

Please Find the Correct Mode for Buy/Sell,I couldint find the correct mods for buy/sell in molanis,

Tryed a lot the problem is with finding the correct mode. 

Thanks. 

//+------------------------------------------------------------------+
//|                                                   SuperTrend.mq5 |
//|                                           Copyright 2011, FxGeek |
//|                                              http://www.mql5.com |
//+------------------------------------------------------------------+
#property copyright "Copyright 2011, FxGeek"
#property link      " http://www.mql5.com"
#property version   "1.00"
#property indicator_chart_window
#property indicator_buffers 9
#property indicator_plots 2

#property indicator_label1  "Filling"
#property indicator_type1   DRAW_FILLING
#property indicator_color1  clrBisque, clrPaleGreen

#property indicator_label2  "SuperTrend"
#property indicator_type2   DRAW_COLOR_LINE
#property indicator_color2  clrGreen, clrRed

input int    Periode=10;
input double Multiplier=3;
input bool   Show_Filling=false; // Show as DRAW_FILLING

double Filled_a[];
double Filled_b[];
double SuperTrend[];
double ColorBuffer[];
double Atr[];
double Up[];
double Down[];
double Middle[];
double trend[];

int atrHandle;
int changeOfTrend;
int flag;
int flagh;
//+------------------------------------------------------------------+
//| Custom indicator initialization function                         |
//+------------------------------------------------------------------+
int OnInit()
  {
//--- indicator buffers mapping
   SetIndexBuffer(0,Filled_a,INDICATOR_DATA);
   SetIndexBuffer(1,Filled_b,INDICATOR_DATA);
   SetIndexBuffer(2,SuperTrend,INDICATOR_DATA);
   SetIndexBuffer(3,ColorBuffer,INDICATOR_COLOR_INDEX);
   SetIndexBuffer(4,Atr,INDICATOR_CALCULATIONS);
   SetIndexBuffer(5,Up,INDICATOR_CALCULATIONS);
   SetIndexBuffer(6,Down,INDICATOR_CALCULATIONS);
   SetIndexBuffer(7,Middle,INDICATOR_CALCULATIONS);
   SetIndexBuffer(8,trend,INDICATOR_CALCULATIONS);

   atrHandle=iATR(_Symbol,_Period,Periode);
//---
   return(0);
  }
//+------------------------------------------------------------------+
//| Custom indicator iteration function                              |
//+------------------------------------------------------------------+
int OnCalculate(const int rates_total,
                const int prev_calculated,
                const datetime &time[],
                const double &open[],
                const double &high[],
                const double &low[],
                const double &close[],
                const long &tick_volume[],
                const long &volume[],
                const int &spread[])
  {
//---
   int to_copy;
   if(prev_calculated>rates_total || prev_calculated<0) to_copy=rates_total;
   else
     {
      to_copy=rates_total-prev_calculated;
      if(prev_calculated>0) to_copy++;
     }

   if(IsStopped()) return(0); //Checking for stop flag
   if(CopyBuffer(atrHandle,0,0,to_copy,Atr)<=0)
     {
      Print("Getting Atr is failed! Error",GetLastError());
      return(0);
     }

   int first;
   if(prev_calculated>rates_total || prev_calculated<=0) // checking for the first start of calculation of an indicator
     {
      first=Periode; // starting index for calculation of all bars
     }
   else
     {
      first=prev_calculated-1; // starting number for calculation of new bars
     }
   for(int i=first; i<rates_total && !IsStopped(); i++)
     {
      Middle[i]=(high[i]+low[i])/2;
      Up[i]  = Middle[i] +(Multiplier*Atr[i]);
      Down[i]= Middle[i] -(Multiplier*Atr[i]);

      if(close[i]>Up[i-1]) 
        {
         trend[i]=1;
         if(trend[i-1]==-1) changeOfTrend=1;

        }
      else if(close[i]<Down[i-1]) 
        {
         trend[i]=-1;
         if(trend[i-1]==1) changeOfTrend=1;
        }
      else if(trend[i-1]==1) 
        {
         trend[i]=1;
         changeOfTrend=0;
        }
      else if(trend[i-1]==-1) 
        {
         trend[i]=-1;
         changeOfTrend=0;
        }

      if(trend[i]<0 && trend[i-1]>0) 
        {
         flag=1;
        }
      else 
        {
         flag=0;
        }

      if(trend[i]>0 && trend[i-1]<0) 
        {
         flagh=1;
        }
      else 
        {
         flagh=0;
        }

      if(trend[i]>0 && Down[i]<Down[i-1])
         Down[i]=Down[i-1];

      if(trend[i]<0 && Up[i]>Up[i-1])
         Up[i]=Up[i-1];

      if(flag==1)
         Up[i]=Middle[i]+(Multiplier*Atr[i]);

      if(flagh==1)
         Down[i]=Middle[i]-(Multiplier*Atr[i]);

      //-- Draw the indicator
      if(trend[i]==1) 
        {
         SuperTrend[i]=Down[i];
         if(changeOfTrend==1) 
           {
            SuperTrend[i-1]=SuperTrend[i-2];
            changeOfTrend=0;
           }
         ColorBuffer[i]=0.0;
        }
      else if(trend[i]==-1) 
        {
         SuperTrend[i]=Up[i];
         if(changeOfTrend==1) 
           {
            SuperTrend[i-1]= SuperTrend[i-2];
            changeOfTrend = 0;
           }
         ColorBuffer[i]=1.0;
        }

      if(Show_Filling)
        {
         Filled_a[i]= SuperTrend[i];
         Filled_b[i]= close[i];
           }else{
         Filled_a[i]= EMPTY_VALUE;
         Filled_b[i]= EMPTY_VALUE;
        }

     }

//--- return value of prev_calculated for next call
   return(rates_total);
  }
//+------------------------------------------------------------------+
Analysis of the Main Characteristics of Time Series Analysis of the Main Characteristics of Time Series
This article introduces a class designed to give a quick preliminary estimate of characteristics of various time series. As this takes place, statistical parameters and autocorrelation function are estimated, a spectral estimation of time series is carried out and a histogram is built.
Universal Regression Model for Market Price Prediction Universal Regression Model for Market Price Prediction
The market price is formed out of a stable balance between demand and supply which, in turn, depend on a variety of economic, political and psychological factors. Differences in nature as well as causes of influence of these factors make it difficult to directly consider all the components. This article sets forth an attempt to predict the market price on the basis of an elaborated regression model.
Interview with Alexander Arashkevich (ATC 2011) Interview with Alexander Arashkevich (ATC 2011)
The Championship fervour has finally subsided and we can take a breath and start rethinking its results again. And we have another winner Alexander Arashkevich (AAA777) from Belarus, who has won a special prize from the major sponsor of Automated Trading Championship 2011 - a 3 day trip to one of the Formula One races of the 2012 season. We could not miss the opportunity to talk with him.
The Role of Statistical Distributions in Trader's Work The Role of Statistical Distributions in Trader's Work
This article is a logical continuation of my article Statistical Probability Distributions in MQL5 which set forth the classes for working with some theoretical statistical distributions. Now that we have a theoretical base, I suggest that we should directly proceed to real data sets and try to make some informational use of this base.