
Random Walk and the Trend Indicator
Introduction
The coin-tossing game has been around for ages. Let us play this game, but with the intentions of trying out and understanding the mechanisms of technical trade on the FOREX market. We are far not the first who took up a coin into the hands. Those who wish to learn more about the probability theory, can refer to the book An Introduction to Probability Theory and Its Applications by William Feller. Our goal is to understand the mechanisms of trade.
Random Walk and Its Properties
To begin with, let's simulate the result of a coin-tossing game, using a generator of random numbers. So, let the heads be a +,1 and tails be -1. The result of the i-th toss of the coin is x (i) = p (1/2), where p (1/2) is a function, taking the values +1 with the probability of 1/2 and the value -1, with the same probability 1/2.
Then the Random Walk will be simply the sum of x(i). For simplicity, we start from zero.
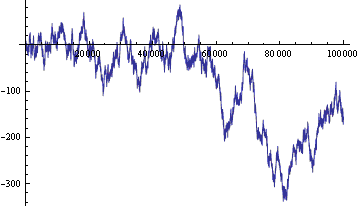
Figure 1. Random walk: (vertical axis - current position on the line, by the horizontal axis - time steps)
The Random Walk has been well studied and has some remarkable properties. Let's summarize those that are useful for us:
- The Arcsine Law. The longer we toss a coin, the less the Random Walk position passes through zero.
- About 90 percent of the time Random Walk located on one side of zero. Actually, these two theorems are useless in real trading. And we basically only need them to emphasize the differences between the real currency rates and Random Walk.
- The Random Walk chart is a fractal, that is, it remains similar to itself with the change of a scale. A fractal is a beautiful word, as well as the images of fractals. It is useful that the statistical parameters of the Random Walk are scale-invariant.
- The drunken sailor theorem. The Random Walk - is the the trace of a drunken sailor, which, after spending the money, leaves the tavern, with the average speed, proportional to the square root of the number of steps (or coin tosses). This is a very useful theorem because it allows us to assess the randomness or non-randomness of events. If we have somehow, miraculously won 65 heads out of 100 tosses, then we were just lucky, or should we share part of the prize with the usefulness of such miracle?
The Random Walk can be used for trading. Well, actually, students have long noticed this and play "heads or eagles" in breaks between classes. The Random Walk can be used to organized a play market. All trading rules as on the current market would apply, but instead of taking the currency rates, we take the Random Walk rates. As always, there will be some intermediary, who will take the spreads, commissions and taxes. But we will kindly ask them not to take anything for now, and not spoil our game.
A few commentaries about trade:
- Using the Random Walk, it is impossible to guess where the RW position will move to in the next moment.
- The position can move away from zero on an arbitrarily distance, as into a plus or a minus, over a sufficiently large number of time steps.
- No trading system can averagely neither win nor lose on the Random Walk rates. Here it is worth to note that while this is a play market, the balance of the trading system can become negative. We trade a finite number of time steps. At the last toss, all of the deals close. The "averagely" key word can be replaced by the phrase "when averaged over the set of all possible values".
If the deposit of the trading system are limited and can not pass into negative, then the following statement will be true: Any trading system that is actively trading on the Random Walk data will keep losing money, until they are all gone. - If we allow intermediary to take a small spread from each deal, then the funds will decrease at a rate proportional to the number of deals. The optimal strategy when trading with intermediary - is not to play at all. If you really want to trade, then your best bet is to put everything into one deal. In this case, the probability of winning is maximal, but is still less than 0.5.
- The majority of indicators and Expert Advisors will work on the Random Walk data. Many of them will give signals to buy or sell. But their signals are absolutely meaningless. In the case of the trade using Random Walk data with presence of intermediary a correct Expert Advisor should give an only one recommendation: "Do not enter the market".
- The values of the Z account for any trading strategy, based on Random Walk data will be normally distributed around zero. The specific value of the Z-account for some RW data does not characterize a trading strategy. When using the Random Walk data, all cats are gray, in the sense that all trading strategies are the same. Trading strategies differ in the ways of guessing the future changes, and the position of Random Walk is impossible to predict.
- In Random Walk data we can observe trends, cycles, reversal patterns, channels, and other technical analysis attributes. These are all imaginary patterns and they do not help in trade. Such is the psychology of a trader - to see oases' in the desert, where not a drop of information can really be found.
- If two people, with a limited number of coins, will play everyone in "heads or tails", then the average winner will be the one that has more coins, since the game will automatically terminate once the other runs out of money. If "heads or tails" is played by the trader and the market, the trader's chances of winning, on average, are proportional to the ratio of the trader's capital to the volume of the market. To put it simpler - the trader has no chance. Even if there is are no moderators.
- A championship can be held on the Random Walk data. The virutal deposit is given to each participant. The sponsors promise real money to those who get the most amount of virtual money. The mathematical expectation of profits become significantly positive. The problem arises of the implementation of the martingale strategy, optimized for the championship. The most aggressive players will drain out all of their deposit well before the end, while the careful ones will not rack up enough funds. Among the middle guys, a Lottery will be played the Random Walk. Interestingly, the strategy should be optimized, not only for the number of coin tosses, and the initial deposit, but also, for the number of aggressive and other types of participants. But we will leave it for another article. The beauty of the Random Walk is that it allows us to solve such optimization problems as numerical during simulation, as well as analytically. And once a problem is solved and understood, it can be used in a real life.
The Differences Between the Real Currency Quotes and the Random Walk data
The statements of 1-8 are rather pessimistic. They predict the unconditional loss of deposit for any trader on the Random Walk market. But the quotes of currency pairs differs from the Random Walk data. These differences - is the key to building a profitable (on average!) trading strategy. Let's list the main differences between the real currency rates and the Random Walk data.
- The real currency rate is limited by fundamental economical factors, and is located within a certain fundamental horizontal channel. Based on this fact, for example, we can construct a trading strategy, based on the "volatility" on large time-frames.
- The changes of a real currency rate sometimes can be predicted, eg, based on the current news.
- There are differences in the statistical distributions of the parameters of the real currency rate and those of Random Walk. This very general statement is the key to the vast majority of trading strategies. The real currency rate or the Random Walk are viewed as a series of numbers. The task is to find statistical regularities in the series, and based on them, to predict the further values.
A number of changes in the Random Walk is a series of randomly taken +1 and -1. So how do we find statistical trends in this series? This issue coincides with the task of verifying the sequence for randomness. There are a lot of randomness tests developed. If any test shows "randomness" in a series, then a trading strategy can be built on its basis.
The Concept of Trends
The easiest test is the following. The numbers of +1 and -1 in a sequence should be approximately the same. By the drunken sailor theorem, the number of +1 may differ from the number of -1, in general, by no more than the square root of the number of data in the sequence. For a real rates, this randomness test is performed simply by virtue of the limitation of the real rates by the fundamental channel. Here we can not construct a trading strategy.
Another test is much more interesting. Let's count the number of "+1,+1", "+1,-1", "-1,+1" and "-1,-1" chains. In a random sequence, their number should be approximately equal (again, similar to the theorem about the drunken sailor). If the number of "++" chains (renamed "+1+1") suddenly greatly exceeds the number of "+-" ("+1,-1") chains, then we construct a strategy: After each "+", we bid on "+". According to the statistics we should win more than in half the cases.
Let's translate the last paragraph to the trader's language. The most popular trading strategies are trend-following strategies. To recognize the trend in time, to jump on and off it in time - is the main goal of these strategies. But there are false trends-mirages, like in Random Walks. The test of the number of chains, described above, will help to distinguish the false trend from a true one. If the number of "++" and "--" chains is greater than the number of "+-" and "-+" then the RW has trend and trend-following strategies will work. If not, then we should not enter the market on signals, based on trend-following strategies.
We can consider not only the binomial chains (++,+-,-+,--), but three-term ones (+++, ++-, +-+, ...), and even longer chains. We can count the number of trending (+++, ---, ++++) and anti-trending (-+-, +-+, +-+-) chains or assign each chain a trend coefficient and calculate the sum using the coefficients. Ultimately, these activities will lead us to the calculation of the Z score. But the Z score here is calculated not in a series of win-lose strategies, as traders are accustomed to, but in the view of the rate changes. A negative Z score will indicate that there is a trend series, and a positive Z score will indicate the trend-free series.
The consideration of long chains and the calculation of the Z score requires a sufficiently long series (starting from 30). Our goal is to construct the trend indicator, and the consideration of long series will lead to delays of the indicator. Consideration of binomial chains can be begun with series of 8 elements. Therefore, to construct the indicator, let's consider the binomial chains. For a serious study of the Random Walk (say, to build a RW-simulator), we will need to use the Z score.
The Illustration of Trends in Random Walk
Let's illustrate the trend concept on the Random Walk.
One definition of a trend is as follows: A trend - a memory of the previous changes. The Random Walk does not remember its history. Well, let's add memory to it, let the result of the i-th coin toss be x (i) = p(1/2 + a*x(i-1)), where a-trending parameter between -1/2 and +1/2. The function P (...) generates +1 with a probability of 1/2+a*x(i-1) and -1 with the probability of 1/2-a* x(i-1).
If а<0, then the Random Walk is anti-trending. If а>0, then it is trending. If а=0, then the Random Walk has no trend.
The Random Walks, which were generated on a same sequence of random numbers, are shown in the picture.
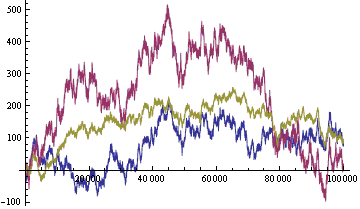
Figure 2. The generated Random Walks: trending (red, a = 0.2), trend-less (blue, a = 0), and anti-trending (yellow, a =- 0.2)
As we see, a trending Random Walk is characterized by a relatively high volatility, the tendency to form inclined channels. The anti-trending Random Walk is relatively low volatility, tends to curl up in a horizontal channel.
On the real market, distinguishing between the trending and anti-trading RWs is not so easy, especially if the trend is weak. An indicator of trend is absolutely essential. As mentioned above, trading on trend-less and anti-trending RWs, using trend-following strategies is a sure way to lose the deposit.
When a trending RW you can trade using the trend-following strategies. The art of trend catching and examining of trend reversal points can be replaced by statistical methods of mathematics. But the question remains open: will there be enough non-random profits to pay the intermediary and still stay in profit? To obtain the approximate answer, we will have to turn to the indicator of trend, which is provided at the end of this article.
When a anti-trending RW, we can trade volatility. An anti-trending RW aims to break down any sloped trend and move into a horizontal channel. You can set the Take Profit at any place in the horizontal channel, regardless of the current trend, and the Stop Loss beyond the channel borders. No matter where on the channel the price wanders, it will eventually come in touch with the Take Profit.
When a trend-less RW, we can not trade with trend-following strategies. We need to use other ideas, such as the idea of cycling.
Proposal for a Random Walk simulator
The Random Walk with a trend is also useful for testing trading strategies. We can create RW simulator on the basis of the function:
Where:
- Amp - amplitude,
- P(...) - the probability function,
- Trend - the trend, the function of the previous changes,
- Cycle - cycle, a function of time,
- Limit - a function of the Random Walk,
- Expect - the expectations, the function of future changes.
The parameters of these functions are fitted to the statistical parameters of the real rates.
The simulation of the real rates by the Random Walk has a much deeper meaning than just an illustration of the weakness of the human perception. The RW simulation of the rates data allows you to test any Expert Advisor on the COMPLETE set of possible rates (or at least on a reasonable sample of the complete set). That, in turn, will allow us to build a probability distribution function of thу means of the given Expert Advisor. This distribution function uniquely characterizes the EA's profitability, aggressiveness, and other parameters.
The Definition of the completeness of the set:
- The set of the complete historical rates data means the following: for the real market quotes, there is a RW pattern, very similar to it. With the increase in the number of rates in a set, the similarity becomes absolute (distance (norm) in the space of rates (functions) between the real and the nearest simulated rates approaches zero)
- The Dummy strategy - a strategy, the deals of which are made arbitrarily, but without the knowledge of the historical and current rates. The results of the previous deals are also unknown. We known only the time from the start or the number of the coin toss. The dummy, as is typical for such a character, never pays the spreads, commissions, and taxes. The dummy can also have negative means.
The set of rates is mathematically complete, - if the probability distribution function of any strategy of the dummy, on the set, approaches a normal distribution. - The set is complete - if it is mathematically and historically complete.
Testing on historical data is certainly better than nothing. But there is a lack of historical data and it has become outdated. In addition, historical data may be included in the design of the EA in the form of optimization - then how could we test on them? And so the Equity curve of the EA, on historical data, is just a section of the probability distribution function of the equity on the historically ocсurred implementation of the rates. And it can not be a sufficiently complete characteristic of an Expert Advisor.
Of course, we will never be able to incorporate all of the subtleties and nuances of the real rates into a simulated rates. The simulation of the real rates- is an inexhaustible topic for separate articles and studies. But to begin with, to test the trend-following systems we can use a fairly simple simulator, based on the Random Walk with a trend.
A simple simulator, with the ability to determine the distribution function, just needs to be attached to the Strategy Tester. Another place where the simulator rates is required is the storefront of the EAs. Otherwise, we would find it hard to see what it is that we are buying. I would have bought a trading EA only after testing it on several fundamentally different simulators and historical data. For each EA being sold, next to the price, there should be an attached probability distribution function of the funds, and a simulator, from which it was obtained.
The probability distribution function of an Expert Advisor - is a technical passport of the EA and its warranty from the producer. The Consumer Rights Protection Law in the Russian Federation applies to EAs just like to any other products. Here, however, we will first need to build a certification system for simulators.
Indicator of Trend
Using the idea of the trend of a rate, we can construct the simplest trend indicator. Unlike the Random Walk, the real rates are represented as bars. Let's replace the real rates with the Random Walk rates. Each bar is replaced by a single average value (high + low)/ 2 (see the question at the end of the article). Let's throw away the amplitude of changes and leave only the signs. We obtain a series of pluses and minuses such as ++-+---+-+-- .... Count the number of "++" and "--" trending-chains and "+-" and "-+" anti-trending chains for the last N bars. As an indicator, we take the value of "++" + "--" - "-+" - "+-".
For convenience, let's draw a line on the indicator, which will evaluation the strength of the trend: + or - square root of N.
The indicator code in MQL5 is given at the end of this article (TrendingHL.mq5).
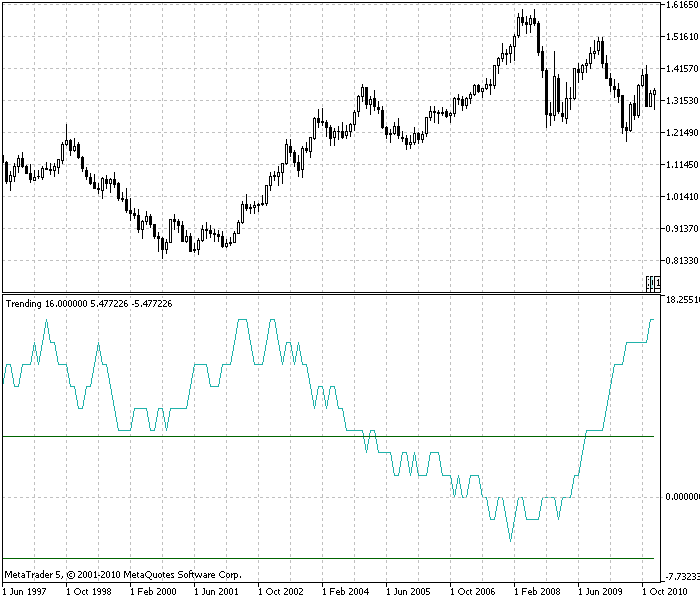
Figure 3. Trend indicator, EURUSD, monthly time-frame. The rates are almost always trending (above zero), and half the time its a strong trend (above the upper green line). The number of bars by which the trend is evaluated N=30
After playing with the trend indicator on the EURUSD rates, we note the following:
-
The most of the time, the indicator is greater than zero. That is, the rates is trending. The weak trend of the rates has already been discussed. But a picture is worth a thousand words.
The real rates is not always trending.
-
The trend indicator is delayed, as all of the other indicators.
-
The indicator of trend allows us to estimate the size of the nonrandom profit, which may be obtained by the trending trading strategy on this chart. The average value of the indicator in the figure is about 7. The average change of the rate for one bar is 0.01 U.S. (approximately). 0.01*7=0.07. And so, from one invested dollar, we can earn about 7 cents of profit every month. This is a rough evaluation, but it gives us an order of magnitude. We have forgotten about the intermediary, margin trading, and entry and exit points into the market.
The good news is that, unlike the Random Walk rates, the real rates is trending and lets us earn money.
The sobering fact is that the interest from the capital is very low, and comparable with other instruments of investment.
-
The fact that the trend, on average over the years is positive, gives the indicator the power of prediction. We can hope that the trending nature of the rates will continue.
-
Trend can best be seen on large time-frames.
-
Anti-trend is seen rarely.
-
Despite the fact that the real rates is a fractal, the concept of trend invariance under a change of the scale (time-frame) can not be spoken of with certainty.
A correct hypothesis will probably be the following: The relative profit is invariant under the changes of the scale.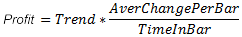
where:
- Trend - trend,
- AverChangePerBar - the average absolute change in the rate for a bar,
- TimeInBar - the duration of the bar in time (the time-frame).
Meanwhile, the profit is preserved, not only in different time-frames, but also on different trade ideas (cyclical, volatility), for various real rates and on various investment instruments. The The profitability is limited from top by an army of speculators and investors. From below, the total profit for all of the instruments is limited by the increase in the total volume of the capital, or, if we generalize, by the development of mankind.
Based on the last paragraph, we can construct an indicator of the trending profit of a rate, and with the involvement of other ideas and an indicator, the total profit. By building similar indicators for other instruments, we will come to researching the movement of capital throughout the market, and then, maybe, we will be able to more accurately predict the rates.
Let me explain the last paragraph in more detail. There are two kinds of predictions of the rates:
- We know that it's impossible to make profit using the Random Walks rates. We explore the real rates and see that the real rates has trends, which exist on it for a long time now. Well, since the trends have been around for years, we can assume they will be there tomorrow as well. And that's all the prediction. One type of non-randomness - trend. The non-randomness of the rates is generated by the growth of the total amount of the capital. The build-up of the capital amounts to several percent per year - well, this percentage of the capital is basically what we will have from our gambling on this non-randomness.
- We know, not only the history of the rates, but the movements on neighboring markets. The sum of the capital on all markets is the an approximately constant value. We research the movements of the capital between the markets, find trends, and use them to predict the rates. The profit here will be proportional to the non-random flow of capital between markets. But the implementation of such predictions on MetaTrader 5 is for now only possible within the limits of the currency market.
Those 7 percent of the trending profitability (see "non-random trends"), which we counted by the indicator, is the sum of the two non-randomness, considered above, and some other non-randomness, which I don't even know about.
The markets here are viewed as non-closed (open) systems with an inflow and outflow. Increase = inflow - outflow. If the inflow is greater than the outflow, then the market (market rates) is trending. If the inflow is equal to the outflow, then the market is trend-less. If the inflow is less than the outflow, then the market is anti-trending.
This article contains one serious contradiction. On the one hand, we have established, using the indicator of trend, that the real rates is trending. But on the other hand, we argue that the real rates fluctuates within the limits of a horizontal fundamental channel. And a horizontal channel - is a very strong indication of anti-trend.
So after all, is the real rates trending or anti-trending? A sense of harmony suggests to me that the rates is trending, and no fundamental horizontal channel exists. And this means that the historical maximums and minimums will be constantly updated. And the corresponding to them crises will become stronger and stronger, until the next crisis destroys the system. In general, this is understandable, a trend - is a sign that in the system, some parameter (equity) is being accumulated, increases. If we continue to load a system, it will eventually break down. A resets of the accumulated parameter will occur, and a new cycle of development will begin.
Conclusions
Here is another article written about the FOREX market. These articles can be found in hundreds on the Internet, with an average price of a dollar per piece. And the number of free articles can't even be counted. So what's new in this particular article?
- For the convenience of the traders, the properties of the Random Walks are presented, and an indicator is created, which allows us to distinguish the real rates with trend from the Random Walk data.
- Using the indicator, we able to assess the profits that can be obtained by a trend-following strategy.
- We proposed to add to the MetaTrader 5 trading platform a simulator of rates. We proposed the idea of this simulator.
Question
Question: Why are the average taken for the indicator (High + Low)/2? Considering that we can not trade by this price. And taking the average is dangerous - the average (smoothed) Random Walk rates will have trend. Moreover, the more averaging (smoothing) is given, the greater will be the trend.
Answer: Let's check. To check this we can take the prices without any averaging, for example, simply the opening or closing price - the trend will still remain, but it can't be seen as well.
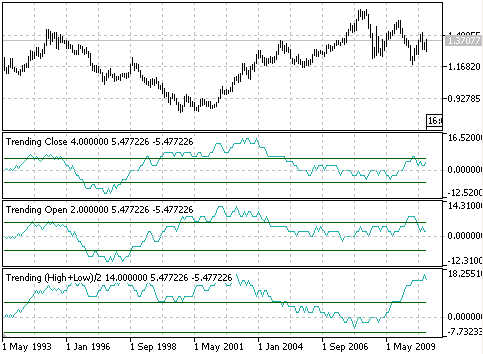
Let's consider the effect of averaging of the trend indicator (EURUSD, monthly time-frame). The lower Indicator is calculated on the averages (High + Low)/2 (trendinghl.mq5). The middle indicator is calculated by the price of Open (trendingopen.mq5). The upper indicator is calculated by the price of Close (Trendingclose.mq5). It is evident that all of the indicators are positive, and the rates have trend. But the average value of the indicator, for Open and Close is not 7, as it is for (High + Low)/2, and is approximately 2. For the precisions, with which estimates are given in this article, the difference is not significant. I must admit that the averaging has artificially increased the trend of the rates.
More compelling, accurate, authoritative, and challenging evidence (measurements) of the trend of the rates can be easily found in a search, using the keyword: trend, persistence, Hurst exponent, ... .
The part of the question, "After all, we can not trade at this price" is an unrealistic know-how. The opponent expects (and subconsciously looks for) the indicator, though which he will be able to see the signals wit his eyes and knowingly trade with his hands. I am forced to disappoint you. Computers kill manual trading.
As evaluated in the article, non-randomness on the rates last for 10 percent of the capital per year (accurate to the order). Such values on the rates can not be seen by the eyes and grasped by the hands. A automated Expert Advisor is required. The EA will fight for a few percent of the capital in a year, and in the near future, over the tenth-hundredth of a percent. This is why we need a simulator, to track and optimize the fractions of the percent of the profit.
When testing on real rates, it is impossible to detect a portion of a percent, or even a whole percent of profit per year.
This is why there are very high requirements of the mathematical engine of the simulator.
//+------------------------------------------------------------------+
//|                                                     Trending.mq5 |
//|                                      Copyright 2010, Grebenev V. |
//|                                              https://www.mql5.com |
//+------------------------------------------------------------------+
#property copyright "Copyright 2010, Grebenev V."
#property description "Trending Indicator"
#property version   "1.00"
#property indicator_separate_window
#property indicator_separate_window
#property indicator_buffers 3
#property indicator_plots   3
#property indicator_type1   DRAW_LINE
#property indicator_type2   DRAW_SECTION
#property indicator_type3   DRAW_SECTION
#property indicator_color1  LightSeaGreen
#property indicator_color2  DarkGreen
#property indicator_color3  DarkGreen
#property indicator_label1  "Trending"

//--- input parameters N – number of bars, by which the trend is calculated
input int      N=30;

double ExtTRbuffer[];   // array for the indicator
double ExtTRbufferP[];  // array for the upper estimation of the trend
double ExtTRbufferM[];  // array for the lower estimation of the trend
double average[150000];  // array for the average values of the rates

//+------------------------------------------------------------------+
//| Custom indicator initialization function                         |
//+------------------------------------------------------------------+
int OnInit()
  {
//--- indicator digits
//   IndicatorSetInteger(INDICATOR_DIGITS,0);
//--- indicator short name
   IndicatorSetString(INDICATOR_SHORTNAME,"Trending");
//---- index buffer
   SetIndexBuffer(0,ExtTRbuffer);
   SetIndexBuffer(1,ExtTRbufferP);
   SetIndexBuffer(2,ExtTRbufferM);
//--- set index draw begin
   PlotIndexSetInteger(0,PLOT_DRAW_BEGIN,1);
   PlotIndexSetInteger(1,PLOT_DRAW_BEGIN,1);
   PlotIndexSetInteger(2,PLOT_DRAW_BEGIN,1);
//---- Array Initialization
   ArrayInitialize(ExtTRbuffer,0);
   ArrayInitialize(ExtTRbufferP,0);
   ArrayInitialize(ExtTRbufferM,0);
   ArrayInitialize(average,0);
   return(0);
  }


//+------------------------------------------------------------------+
//| Custom indicator iteration function                              |
//+------------------------------------------------------------------+
int OnCalculate(const int rates_total,
                const int prev_calculated,
                const datetime &time[],
                const double &open[],
                const double &high[],
                const double &low[],
                const double &close[],
                const long &tick_volume[],
                const long &volume[],
                const int &spread[])
  {

   double pp=0,pm=0,mp=0,mm=0; // pp - number of «++» chains, pm  - number of «+-», mp – «-+», mm – «- -»

   / Fill the array of the average values of the rate with average values (high+low) /2
   for(int i=prev_calculated;i<rates_total;i++) average[i]=(high[i]+low[i])/2;

   for(int i=prev_calculated;i<rates_total;i++)
     {
      pp=0; pm=0; mp=0; mm=0;

      for(int j=0;j<N;j++)
        {
         if(i-j-2>=0) // check that the index of the array did not exceed the border 0
           {
            if((average[i-j-1]-average[i-j-2])>0 && (average[i-j]-average[i-j-1])>0) pp++;
            if((average[i-j-1]-average[i-j-2])>0 && (average[i-j]-average[i-j-1])<0) pm++;
            if((average[i-j-1]-average[i-j-2])<0 && (average[i-j]-average[i-j-1])>0) mp++;
            if((average[i-j-1]-average[i-j-2])<0 && (average[i-j]-average[i-j-1])<0) mm++;
            // chain containing "0" omitted
           }
        }
      // fill indicator arrays
      ExtTRbuffer[i]=pp+mm-pm-mp;
      ExtTRbufferP[i]=sqrt(N);
      ExtTRbufferM[i]=-sqrt(N);
     }
   return(rates_total);
  }
Translated from Russian by MetaQuotes Ltd.
Original article: https://www.mql5.com/ru/articles/248
 Using Pseudo-Templates as Alternative to C++ Templates
 Use of Resources in MQL5
 Electronic Tables in MQL5
 Econometric Approach to Analysis of Charts
- Free trading apps
- Over 8,000 signals for copying
- Economic news for exploring financial markets
You agree to website policy and terms of use
Forum on trading, automated trading systems and testing trading strategies
Discussion of article "Several Ways of Finding a Trend in MQL5"
newdigital, 2014.06.25 20:45
How to detect forex trends
Detecting a trend is an important part of predicting direction in a currency pair. Tomorrow’s prices usually follow or continue today’s trend. There will, of course, be reversals and ranging behavior within the trend but it is easier to trade with a known trend than to predict when it changes. The task of the forex trader is to detect variations or waves of sentiment. The trader needs to ask: is there a shape to changes in sentiment and can it be detected? To answer this question, we can turn to price break charts (also called three-line break charts). In recent months, Bloomberg Professional stations added these charts. They also are available in many retail charting programs such as eSignal and ProRealTime.
Price break charts show only a new high close or a new low close. For example, if a trader using a candlestick chart of a daytime interval converts it to a three-line price break chart, he would see the price action from a different vantage point. The price break chart would only show consecutive new day high closes, or consecutive new day low closes. If no new high or new low is reached, then no additional bar would appear. But when the price reverses, it shows a new column only if the price reverses three previous highs (downward reversal) or three previous lows. This is why it is called a three-line break chart. The conditions for a bullish and bearish reversal are easily identified.
Three-line break charts enable significant insights into the shape of sentiment in the price action. A trader can detect the prevailing sentiment, how strong it is, whether a change in sentiment has occurred and project where the next trend reversal will occur. Several examples of using the three-line break as an indicator occurred in the GBP/USD pair in 2009 (see “Show me the move”).
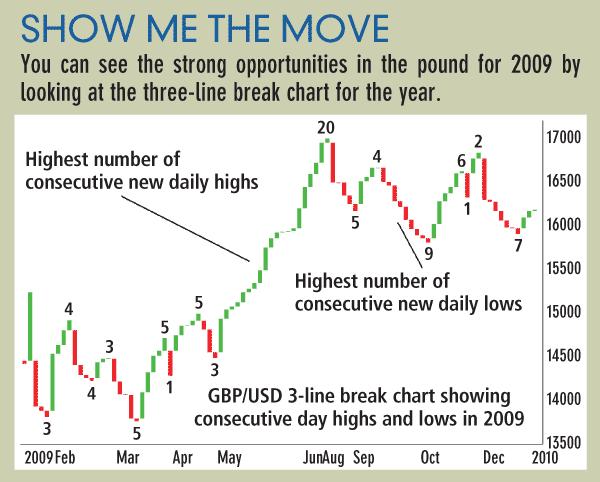
The year started with a series of three consecutive new lows. It then reversed to a distance of four new consecutive highs. The sequence reversed back to four new consecutive lows followed by three consecutive new highs. In April, we see a very significant sentiment event, a flip-flop. This is a new downward reversal followed immediately by an upward reversal. In other words, market sentiment did not continue into a series. When a flip-flop occurs, it is rarely followed by another immediate reversal and therefore is a signal that the trend direction after the flip-flop will continue for a longer distance. This is exactly what occurred. The GBP/USD flipped from a low of 1.4252 on March 30 to a high of 1.5002 on April 15.
Also in the pound, we see a long sequence of 20 new consecutive day highs that occurred between May 1 and June 11, taking it from 1.4490 to 1.6598. While the ultimate length of the sequence is not predicable, what was clear to the trader was that the previous highest uptrend sequence before the long run up was five new consecutive highs. When a previous sequence of highs or lows is broken by a new sequence, this is an alert that the sentiment is becoming stronger than ever.
After the 20 new consecutive highs were achieved, GBP/USD no longer had the energy to repeat this sequence. It entered into a series of smaller consecutive new daily highs, and reversals into consecutive new lows. GBP/USD ended with a reversal up with two consecutive new daily highs.
Price break charts can be used for any time frame. Scalpers could use a one-minute price break to spot what is the intra-hour prevailing sentiment. While price break charts do not predict the duration, or the distance of a new trend, they reveal the strength of the prevailing sentiment. That can be enough to get an edge for the scalper or the long-term trader.