The Simple Example of Creating an Indicator Using Fuzzy Logic
Максим Востров | 3 May, 2012
Introduction
The use of various methods for financial markets analysis becomes more and more popular among traders in recent years. I would like to make my contribution and show how to make a good indicator by writing a couple of dozen code lines. Also, I will briefly reveal you the basics of fuzzy logic.
Anyone who is interested in this issue and wants to explore it more deeply can read the following works:
2. Bocharnikov V."Fuzzy Technology: Mathematical Background. Simulation Practice in Economics" (in Russian).
3. S.N. Sivanandam, S. Sumathi, S.N. Deepa. Introduction to Fuzzy Logic using MATLAB.
4. C. Kahraman. Fuzzy Engineering Economics with Applications (Studies in Fuzziness and Soft Computing).
1. Fuzzy Logic Basics
How can we explain to our computing machines the meanings of such simple expressions as "...a little more...", "...too fast...", "...almost nothing..."? In fact, it is quite possible by using the fuzzy sets theory elements, or rather the so-called "membership functions". Here is an example from А. Leonenkov's book:
Let's describe the membership function for the phrase "hot coffee": coffee temperature should be deemed to be in the range from 0 to 100 degrees Celsius for the simple reason that at temperatures below 0 degrees, it will turn into ice, while at temperatures above 100 degrees it will evaporate. It is quite obvious that a cup of coffee with a temperature of 20 degrees cannot be called hot, i.e. the membership function in the "hot" category is equal to 0, while a cup of coffee with a temperature of 70 degrees definitely belongs to the "hot" category and, therefore, the function value equals to 1 in this case.
As for the temperature values that are between these two extreme values, the situation is not so definite. Some people may consider a cup of coffee with a temperature of 55 degrees to be "hot", while others may consider it "not so hot". This is the "fuzziness".
Nevertheless, we can imagine the approximate look of the membership function: it is "monotonically increasing":
The figure above shows the "piecewise linear" membership function.
Thus, the function can be defined by the following analytical expression:
We will use such functions for our indicator.
2. Membership Function
In one way or another, the task of any technical indicator is the determining of the current market state (flat, upward trend, downward trend), as well as generation of market entry/exit signals. How can this be done with the help of membership functions? Easy enough.
First of all, we need to define the boundary conditions. Let us have the following boundary conditions: for «100% upward trend» it will be the crossing of EMA having period 2, based on typical price (H+L+C)/3 with Envelopes upper border having parameters 8, 0.08, SMA, Close, while for «100% downward trend» it will be the crossing of the same EMA with Envelopes lower border. Everything that is located between these conditions will be assumed to be flat. Let's add one more envelope having the parameters 32, 0.15, SMA, Close.
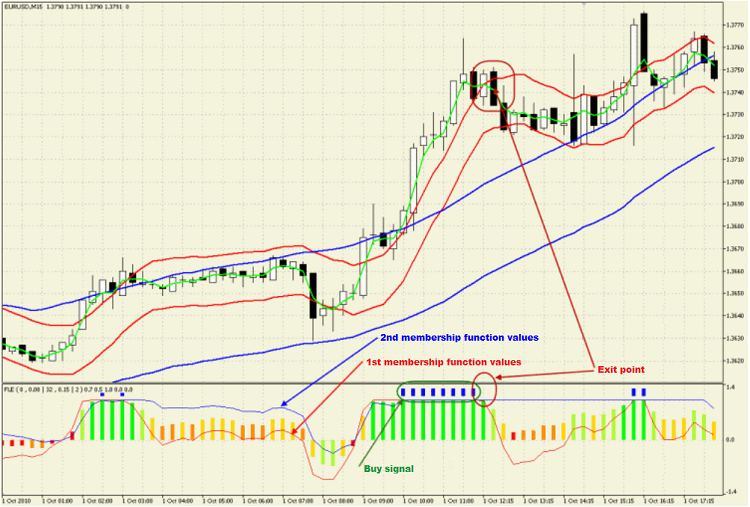
As a result, we will get two identical membership functions. The buy signal will be activated when both functions are equal to 1, while the sell signal will be activated when both functions are equal to -1, respectively. Since it is convenient to build charts with the range from -1 to 1, the resulting chart will be obtained as the arithmetic mean of two functions F(x)= (f1(x)+f2(x))/2.
That is how it looks on the chart:
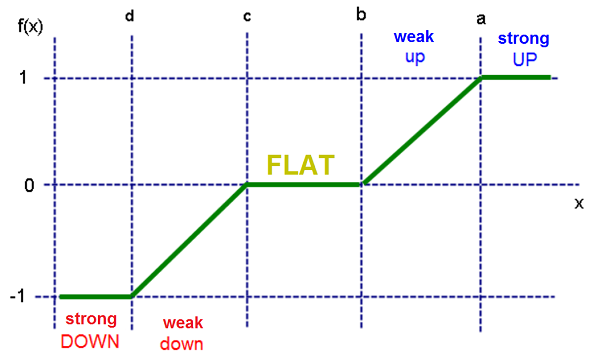
In this case the membership function will have the following graphical representation:
Analytically, it can be written as follows:
 ,
,
where a and b are upper and lower envelope lines, respectively, while х is a value of EMA(2).
With the function defined, we can now move further to writing the indicator code.
3. Creating the Program Code
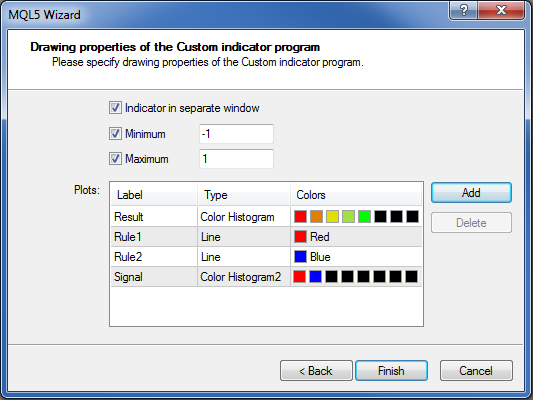
First of all, we should define what and how we are going to draw.
Membership function calculations results will be displayed as the line - red and blue, respectively.
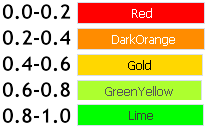
The arithmetic mean will be displayed as a histogram from the zero line and painted in one of the five colors depending on the resulting function value:
DRAW_COLOR_HISTOGRAM drawing style will be used for that.
Let's draw blue and red rectangles as buy/exit signals over the histogram bars, the values of which are equal to 1 or -1.
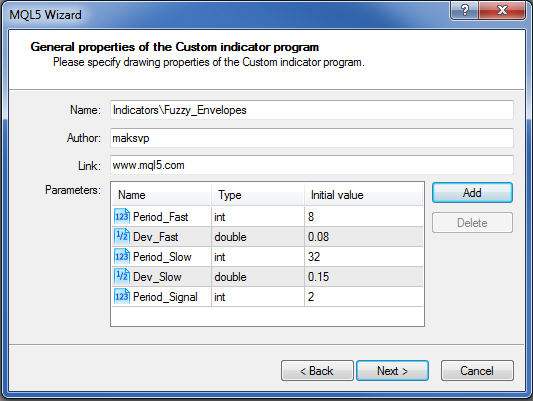
Now, it's time to run MetaEditor and start. New->Custom Indicator->Next... Fill in the "Parameters" field:
Create the buffers:
After clicking "Finish" button we receive a source code and start improving it.
First of all, let's define the number of buffers. Seven of them have already been created by the Wizard (5 for data, 2 for color). We need 5 more.
#property indicator_minimum -1.4 // Setting fractional values
#property indicator_maximum 1.4  // Expert Advisors wizard ignores fractional parts for some reason
#property indicator_buffers 12   // Changing the value from 7 to 12 (5 more buffers have been added)
Let's edit the input parameters:
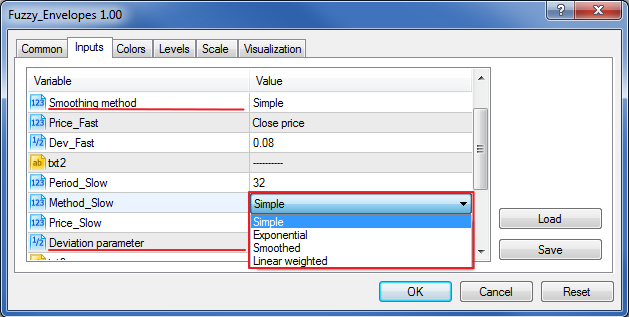
input string txt1="----------";
input int                  Period_Fast=8;
input ENUM_MA_METHOD        Method_Fast = MODE_SMA; /*Smoothing method*/ //moving average smoothing method
input ENUM_APPLIED_PRICE    Price_Fast  = PRICE_CLOSE;
input double               Dev_Fast=0.08;
input string txt2="----------";
input int                  Period_Slow=32;
input ENUM_MA_METHOD        Method_Slow = MODE_SMA;
input ENUM_APPLIED_PRICE    Price_Slow  = PRICE_CLOSE;
input double               Dev_Slow=0.15;  /*Deviation parameter*/
input string txt3="----------";
input int                  Period_Signal=2;
input ENUM_MA_METHOD        Method_Signal = MODE_EMA;
input ENUM_APPLIED_PRICE    Price_Signal  = PRICE_TYPICAL;
input string txt4="----------";
Comments following the declared variable are very handy. The text of the comments is inserted into the indicator parameters window.
The possibility to create lists is also very useful:
Reserving the variables for the indicator handles and buffers:
int Envelopes_Fast;     // Fast envelope
int Envelopes_Slow;     // Slow envelope
int MA_Signal;          // Signal line

double Env_Fast_Up[];   // Fast envelope upper border
double Env_Fast_Dn[];   // Fast envelope lower border

double Env_Slow_Up[];   // Slow envelope upper border
double Env_Slow_Dn[];   // Slow envelope lower border

double Mov_Sign[];      // Signal line
Now, move to OnInit() function.
Let's add some beauty: specify the indicator name and remove extra decimal zeros:
IndicatorSetInteger(INDICATOR_DIGITS,1); // setting display accuracy, we do not need some outstanding accuracy values
string name;                           // indicator name
StringConcatenate(name, "FLE ( ", Period_Fast, " , ", Dev_Fast, " | ", Period_Slow, " , ", Dev_Slow, " | ", Period_Signal, " )");
IndicatorSetString(INDICATOR_SHORTNAME,name);
and add the missing buffers:
SetIndexBuffer(7,Env_Fast_Up,INDICATOR_CALCULATIONS);
SetIndexBuffer(8,Env_Fast_Dn,INDICATOR_CALCULATIONS);
SetIndexBuffer(9,Env_Slow_Up,INDICATOR_CALCULATIONS);
SetIndexBuffer(10,Env_Slow_Dn,INDICATOR_CALCULATIONS);
SetIndexBuffer(11,Mov_Sign,INDICATOR_CALCULATIONS);
INDICATOR_CALCULATIONS parameter means that the buffer data is needed only for intermediate calculations. It will not be displayed on the chart.
Note how the indicators with color buffers are declared:
SetIndexBuffer(4,SignalBuffer1,INDICATOR_DATA);      // All indicator buffers at first
SetIndexBuffer(5,SignalBuffer2,INDICATOR_DATA);      // as this is Color Histogram2, then it has 2 data buffers
SetIndexBuffer(6,SignalColors,INDICATOR_COLOR_INDEX);// the color buffer comes next.
Filling the handles:
Envelopes_Fast = iEnvelopes(NULL,0,Period_Fast,0,Method_Fast,Price_Fast,Dev_Fast);
Envelopes_Slow = iEnvelopes(NULL,0,Period_Slow,0,Method_Slow,Price_Slow,Dev_Slow);
MA_Signal      = iMA(NULL,0,Period_Signal,0,Method_Signal,Price_Signal);
All works with OnInit() function are over.
Now let's create the function that will calculate the membership function value:
double Fuzzy(double x,double a, double c)
{
double F;
     if (a<x)          F=1;                 // 100% uptrend
else if (x<=a && x>=c)  F=(1-2*(a-x)/(a-c));// Flat
else if (x<c)           F=-1;               // 100% downtrend
return (F);
}
Preparations are over. Variables and buffers are declared, handles are assigned.
Now it is time to proceed with OnCalculate() basic function.
First of all, let's write the values of the necessary indicators into the intermediate buffers. Use CopyBuffer() function:
CopyBuffer(Envelopes_Fast,  // Indicator handle
           UPPER_LINE,      // Indicator buffer
           0,              // The point to start 0 - from the very beginning
           rates_total,    // How many to be copied - All
           Env_Fast_Up);   // The buffer the values are written in
// - the rest are done in a similar way
CopyBuffer(Envelopes_Fast,LOWER_LINE,0,rates_total,Env_Fast_Dn);
CopyBuffer(Envelopes_Slow,UPPER_LINE,0,rates_total,Env_Slow_Up);
CopyBuffer(Envelopes_Slow,LOWER_LINE,0,rates_total,Env_Slow_Dn);
CopyBuffer(MA_Signal,0,0,rates_total,Mov_Sign);
Here we must add the code for the calculations optimization (recalculation of only the last bar is performed):
// declaring start variable for storing the index of the bar, recalculation of the indicator buffers will be
// carried out from.

int start;
if (prev_calculated==0)  // in case no bars have been calculated
    {
    start = Period_Slow; // not all indicators have been calculated up to this value, therefore, there is no point in executing the code
    }
else start=prev_calculated-1;

for (int i=start;i<rates_total;i++)
      {
      // All remaining code will be written here
      }
Not much of the code has left.
Setting x, a, b parameters, performing the calculation of the membership function value and writing it into the appropriate buffer:double x = Mov_Sign[i]; // Signal // Setting the first membership function parameters: double a1 = Env_Fast_Up[i]; // Upper border double b1 = Env_Fast_Dn[i]; // setting the first membership function value and writing it to the buffer Rule1Buffer[i] = Fuzzy(x,a1,b1); // Setting the second membership function parameters: double a2 = Env_Slow_Up[i]; // Upper border double b2 = Env_Slow_Dn[i]; // setting the second membership function value and writing it to the buffer Rule2Buffer[i] = Fuzzy(x,a2,b2);
Two indicator lines are built.
Now let's calculate the resulting value.
ResultBuffer[i] = (Rule1Buffer[i]+Rule2Buffer[i])/2;
Then we should paint the histogram bars in appropriate colors: as we have five colors, then ResultColors[i] can have any value from 0 to 4.
Generally, the number of possible colors is 64. Therefore, it is a great opportunity for applying one's creative abilities.
for (int ColorIndex=0;ColorIndex<=4;ColorIndex++)
    {
    if (MathAbs(ResultBuffer[i])>0.2*ColorIndex && MathAbs(ResultBuffer[i])<=0.2*(ColorIndex+1))
        {
        ResultColors[i] = ColorIndex;
        break;
        }
    }
Then we should draw the signal rectangles. We will use DRAW_COLOR_HISTOGRAM2 drawing style.
It has two data buffers with a histogram bar and one color buffer being built between them.
Data buffers values will always be the same: 1.1 and 1.3 for a buy signal, -1.1 and -1.3 for a sell signal, respectively.
EMPTY_VALUE will mean the signal absence.
      if (ResultBuffer[i]==1)
        {
        SignalBuffer1[i]=1.1;
        SignalBuffer2[i]=1.3;
        SignalColors[i]=1;
        }
      else if (ResultBuffer[i]==-1)
        {
        SignalBuffer1[i]=-1.1;
        SignalBuffer2[i]=-1.3;
        SignalColors[i]=0;
        }
      else
        {
        SignalBuffer1[i]=EMPTY_VALUE;
        SignalBuffer2[i]=EMPTY_VALUE;
        SignalColors[i]=EMPTY_VALUE;
        }
Click "Compile" and voila!
Conclusion
What else can be added? In this article I touched on the most basic approach to fuzzy logic.
There is enough space here for various experiments. For example, we can use the following function:
I think, it will not be difficult for you to write the analytical expression for it and find suitable conditions.
Good luck!