
Several Ways of Finding a Trend in MQL5
Introduction
Any trader knows the rule "Trend is your friend, follow the trend", but almost everyone has his own idea about what a trend is. Almost every trader has heard or read horrible stories, which tell how traders, who traded against the trend, ruined themselves.
Any trader would give a lot for opportunity to accurately detect a trend at any given time. Perhaps, this is the Holy Grail that everyone is looking for. In this article we will consider several ways to detect a trend. To be more precise - how to program several classical ways to detect a trend by means of MQL5.
1. What Is a Trend and Why To Know It
First of all, let's formulate the general concept of a trend.
Trend - is a long-term tendency (direction) of price change in the market. From this general definition of trend come the consequences:
- Direction of price change depends on timeframe, on which price timeseries is considered.
- The direction of price change depends on the reference point, from which starts the analysis of timeseries to identify a trend.
Let's illustrate this concept:
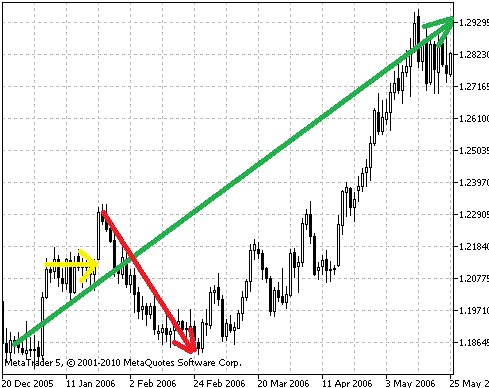
Figure 1. Trend Analysis
Looking at the figure, you can see that the overall trend since the end of 2005 till May 2006 is growing (green arrow on the chart). But if we consider smaller pieces of price chart, you'll find that in February 2006 the trend was clearly downward (red arrow on the chart), and almost the whole January the price was in the side corridor (yellow arrow).
So, before you identify a trend you have to determine what timeframe you are interested in. For trade, the timeframe first of all determines the time of holding position in the market, from its opening until closing. In addition to that, dependent are levels of protective stops and expected closures, as well as the frequency of trade operations.
The purpose of this article is to help new traders to competently use tools of trend detection, provided by MetaTrader 5 platform. This article also aims to give basic knowledge of writing simple indicators, that automate this process. The ultimate goal is to write simple experts, that use these indicators for automated trading.
For definiteness, we'll consider the daily price chart (D1 timeframe in terminal) of the most liquid instrument in the Forex market - EURUSD. The time of holding position on such timeframe can vary from several days to several months. Accordingly, the aim - is to take hundreds and even thousands of points, and protective stop losses are located at a distance of several hundred points.
In general, all described below can be used on any timeframe. However, keep in mind that the smaller is the chart timeframe, the greater impact on trade has the noise component, caused by news, market speculations of major participants and other factors, affecting the market volatility.
If we take into account, that the longer is the trend, the less likely it shifts, then, when trading with the trend, it's more likely to earn than to lose money. Now you have to understand how to detect a trend on the price chart. This will be discussed in this article.
2. How to Detect a Trend
Here are some known ways of trend detection:
- By Moving Averages
- By peaks of zigzag
- By ADX indications
- By NRTR
- By color of Heiken Ashi candlesticks
We'll consistently consider all these methods, their advantages and disadvantages. Then we'll compare them on the same period of history.
2.1. Trend Detection Using Moving Average
Perhaps, the easiest way to detect a trend and its direction - using moving averages. One of the first tools of technical analysis - moving average - is still used in different variations and is the basis of most indicators. Traders use both one moving average and a whole set of them, which sometimes is called as "fan".
Let's formulate a simple rule for one moving average:-
Trend goes up if at a given timeframe the closing price of bar is above moving average.
-
Trend goes down if at a given timeframe the closing price of bar is below moving average.
In this case we'll use the closing price of bar to reduce the number of "false" trend changes, when the price fluctuates up and down near the moving average (the so-called "bounce").
Let's illustrate this method:

Figure 2. Identifying a Trend Using Moving Average
Here we use the EURUSD D1 chart and a simple moving average with period 200, built on the closing prices (red line on the chart). In the figure bottom you can see specially developed trend indicator - MATrendDetector. The trend direction is indicated by position of the indicator histogram, relative to the zero axis. +1 corresponds to the up trend. -1 - down trend. Further we will discuss this and other indicators, used in this article.
You can see, that when the bar closes above/below the moving average, the price then often turns into opposite direction. I.e. this method gives a lot of false signals. That's why its use in experts and indicators is very limited, only as a very "rough" filter of trend.
2.2. Trend Detection Using Three Moving Averages
What can be done to improve the quality of trend detection using moving averages? For example, you can use two or more moving averages with different periods. Then the rule of trend detection for any number (more than one) of moving averages with different periods will look as follows:
- Trend goes up if at a given timeframe all moving averages are plotted in correct rising order on bar closure.
- Trend goes down if at a given timeframe all moving averages are plotted in correct falling order on bar closure.
Here we use the following terms:
- Correct rising order - every moving average must be higher than all other moving averages with higher period.
- Correct falling order - every moving average must be lower than all other moving averages with higher period.
Such "correct order of averages" is also called as the up/down opening of averages fan, because of the visual resemblance.
Let's illustrate this method:

Figure 3. Trend Detection Using Several Moving Averages
Here we use the EURUSD D1 chart and simple moving averages with periods 200 (thick red line), 50 (yellow line of medium thickness) and 21 (thin purple line), built on the closing prices.
In the figure bottom you can see specially developed trend indicator - FanTrendDetector. The trend direction is indicated by position of the indicator histogram, relative to the zero axis. +1 corresponds to the up trend. -1 - down trend. If histogram value is equal to zero, this means that the trend can't be detected. There is also the MATrendDetector indicator for comparison.
It's evident that the number of false alarms of trend change has been decreased. But delay of trend detection has been increased. This makes sense - until all moving averages will line up in the "correct" order, it may take some time. What's better and what's not - depends on the trading system, which uses these methods.
In this case, the period values of averages are not selected anyhow, but they are most widely used by traders and by author of the article. By selecting a set of averages and their number, you can try to improve the characteristics of this trend detection method for a particular currency pair.
2.3. Trend Detection Using Maximums and Minimums of ZigZag Indicator
Now let's approach to trend detection from the perspective of technical analysis classics. Namely, we'll use the following rule of Charles Dow:
- Trend goes up if every next local maximum of price chart is higher than previous local maximum and each subsequent local minimum of price chart is also higher than previous local minimum.
- Trend goes down if each subsequent local minimum of price chart is lower than previous local minimum, and each subsequent local maximum of price chart is also lower than previous local maximum.
We will find local maxima/minima by the tops of the Zigzag indicator.
Let's illustrate this method:

Figure 4. Trend Detection Using ZigZag Indicator
Here we use the EURUSD D1 chart and Zigzag with the following parameters: ExtDepth = 5, ExtDeviation = 5, ExtBackstep = 3.
In the figure bottom you can see specially developed trend indicator - ZigZagTrendDetector.
The main drawback of this method of trend detection - in real-time it's impossible to understand whether the extremum is already formed or not. On the history the extrema can be seen very well, and you can understand where they were formed. However, when price changes real-time, the formed extremum may suddenly disappear or appear again. To see this, just look at Zigzag' lines plotting in visual testing mode of any expert.
This drawback makes this method worthless for practical use in trade. But it is very useful for technical analysis of historical data to find patterns and to assess the quality of various trading systems.
2.4. Trend Detection Using ADX Indicator
The following considered way - is trend detection using the ADX indicator (Average Directional Movement Index). This indicator is used not only to detect trend direction, but also to assess its strength. This is a very valuable feature of ADX indicator. The strength of trend is determined by the main ADX line - if the value is greater than 20 (the generally accepted level, but not necessarily the best at the moment), then the trend is strong enough.
The direction of trend is determined by the +DI and -DI lines to each other. This indicator uses the smoothing of all three lines with exponential averaging, and therefore has a delay of response to trend change.
Let's formulate the rule of trend detection:
- Trend goes up, if the +DI line is higher than the -DI line.
- Trend goes down, if the +DI line is lower than the -DI line.
In this case, the ADX trend line is not used to detect a trend. It is needed to reduce the number of false signals of this indicator. If trend is weak (ADX is less than 20), it is best to wait until it becomes stronger, and only then to start trade with the trend.
Let's illustrate this method:

Figure 5. Identifying a Trend Using ADX Indicator
Here we use the EURUSD D1 chart and the ADX indicator with following parameters: PeriodADX = 21 (thick blue line - value of ADX trend strength, thin green line - value of +DI, thin red line - value of -DI).
In the figure bottom you can see specially developed trend indicator - ADXTrendDetector. For comparison, in the upper chart (crimson) of the ADXTrendDetector indicator the trend strength filter has been disabled (ADXTrendLevel = 0), and in the lower chart (blue) - it has been enabled (ADXTrendLevel = 20).
Notice, that part of the so-called "bounce" in detecting trend direction has been dropped out, when we turned on the trend strength filter. It is desirable to use this filter in real work. Further improvement of indicator quality can be achieved by the skillful selection of external parameters in accordance with current situation in the market (flat/range/trend) and depending on the nature of currency pair movement.
In general, this indicator provides a good opportunity to build trend tracing trading systems as the inputs filter.
2.5. Trend Detection Using NRTR Indicator
The following method of detecting a trend - using the NRTR (Nick Rypock Trailing Reverse) indicator. This indicator is always located at constant distance from the reached price extrema - lower prices on uptrends and higher prices on downtrends. The main idea of this indicator - small corrective movements against the main trend should be ignored, and movement against the main trend, exceeding a certain level, signals about trend direction change.
From this statement comes the rule of detecting trend direction:
- Trend goes up - if indicator line corresponds the uptrend on bar closing.
- Trend goes down - if indicator line corresponds the downtrend on bar closing.
To reduce the influence of false trend reverses on price fluctuations, we'll use the closing prices to check the NRTR line position.
Let's illustrate this method:

Figure 6. Identifying a Trend Using NRTR Indicator
This large blue dots correspond to the upward trend, while the large red dots - to the downward trend. At the bottom of the chart displayed our trend indicator NRTRTrendDetector, described below.
2.6. Trend Detection Using Three Heiken Ashi Candlesticks
Another popular way to detect a trend - is using the Heiken Ashi candlesticks. Heiken Ashi charts are the modified Japanese candlesticks charts. Their values are partly averaged with the previous candle.
Let's illustrate this method:
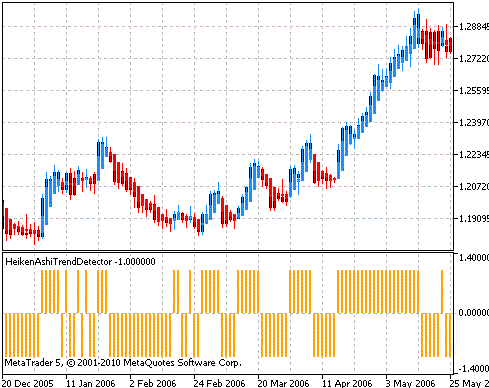
Figure 7. Trend Detection by Color of Heiken Ashi Candlesticks
As you can see, this method is also not free from "false" signals, when price fluctuates in a side corridor. But worse is that this indicator can redraw not only the last bar, but also the penultimate. I.e. the signal on which we've entered, may be reversed on the next bar. This is due to the fact that when the color of candlesticks is determined, two bars are analyzed, so it is recommended to use this method in conjunction with other supporting signals.
3. Trend Indicators
Now let's create trend indicators.
3.1. Trend Indicator Based on Moving Average
The easiest indicator, as the easiest way to determine a trend, based on the moving average. Let's consider, from what parts it consists. Full source code of the indicator is in the MATrendDetector.MQ5 file, attached to the article.
In the beginning of the indicator program comes the line, that connects the library to calculate the various moving averages. This library ships with Client Terminal and is ready to use immediately after installation. Here is this line:
#include <MovingAverages.mqh>
We will use one function from it, that calculates a simple moving average:
double SimpleMA(const int position, const int period, const double &price[])
Here you define the input parameters:
- position - initial index in the price[] array, from which begins calculation.
- period - period of moving average, must be greater than zero.
- price[] - array, that contains the price range specified during indicator placement on chart. By default the Close[] bar closing prices are used.
The function returns the calculated value of moving average.
The next part of text contains the initial settings to display indicator on the screen:
//---------------------------------------------------------------------
#property indicator_separate_window
//---------------------------------------------------------------------
#property indicator_applied_price       PRICE_CLOSE
#property indicator_minimum             -1.4
#property indicator_maximum             +1.4
//---------------------------------------------------------------------
#property indicator_buffers             1
#property indicator_plots               1
//---------------------------------------------------------------------
#property indicator_type1               DRAW_HISTOGRAM
#property indicator_color1              Black
#property indicator_width1              2
//---------------------------------------------------------------------
The following parameters are set:
- #property indicator_separate_window tells MetaTrader 5 terminal to display indicator chart in a separate window.
- #property indicator_applied_price PRICE_CLOSE - type of prices used by default.
- #property indicator_minimum -1.4 - minimal value of vertical axis, displayed in indicator window.
- #property indicator_maximum +1.4 - maximal value of vertical axis, displayed in indicator window.
The last two parameters allow you to set a fixed scale to display indicator chart. This is possible because we know minimum and maximum values of our indicator - from -1 to +1 inclusive. This is done for chart to look nice, not to overlap window borders and indicator title in the window.
- #property indicator_buffers 1 - number of buffers for indicator calculation. We use only one buffer.
- #property indicator_plots 1 - number of graphical series in indicator. We display only one chart on the screen.
- #property indicator_type1 DRAW_HISTOGRAM - display indicator chart as histogram.
- #property indicator_color1 Black - default color of indicator chart.
- #property indicator_width1 2 - line width of indicator chart, in this case it is the width of histogram columns.
Next comes the part to enter the external parameters of indicator, which can be changed during placing indicator on the chart and later on, when it is working:
input int MAPeriod = 200;
There is only one parameter - the value of moving average period.
The next essential part of the indicator - functions, that process various events, that occur when indicator works on the chart.
The first comes the initialization function - OnInit(). It is called immediately after loading the indicator. In our indicator, it looks as follows:
void OnInit()
{
  SetIndexBuffer( 0, TrendBuffer, INDICATOR_DATA );
  PlotIndexSetInteger( 0, PLOT_DRAW_BEGIN, MAPeriod );
}
The SetIndexBuffer() function binds previously declared array, in which we will store the values of trend TrendBuffer[], with one of the indicator buffers. We have only one indicator buffer and its index is equal to zero.
The PlotIndexSetInteger() function sets the number of initial bars without drawing them in indicator window.
Since it's mathematically impossible to calculate a simple moving average on the number of bars smaller than its period, let's specify the number of bars, equal to the moving average period.
Next comes the function, that processes events about the need to recalculate an indicator - OnCalculate():
int OnCalculate(const int _rates_total,
                const int _prev_calculated,
                const int _begin,
                const double& _price[ ] )
{
  int  start, i;

//   If number of bars on the screen is less than averaging period, calculations can't be made:
  if( _rates_total < MAPeriod )
  {
    return( 0 );
  }

//  Determine the initial bar for indicator buffer calculation:
  if( _prev_calculated == 0 )
  {
    start = MAPeriod;
  }
  else
  {
    start = _prev_calculated - 1;
  }

//      Loop of calculating the indicator buffer values:
  for( i = start; i < _rates_total; i++ )
  {
    TrendBuffer[ i ] = TrendDetector( i, _price );
  }

  return( _rates_total );
}
This function is called for the first time after indicator initialization and further each time when price data changes. For example, when comes a new tick on the symbol for which the indicator is calculated. Let's consider it in details.
First, check if there is sufficient number of bars on a chart - if it is less than the moving average period, then there is nothing to calculate and this function ends with the return operator. If the number of bars is sufficient for calculations, determine the initial bar, from which the indicator will be calculated. This is done in order to not recalculate all indicator values on every price tick.
Here we use the mechanism, provided by the terminal. Every time you call a handler function, checks the value of the _prev_calculated function argument - this is the number of bars, processed on previous call of the OnCalculate() function. If it is zero, then recalculate all values of indicator. Otherwise recalculate only the last bar with the index _prev_calculated - 1.
The loop of calculating the indicator buffer values is performed by the for operator - in his body we call the function of trend detection TrendDetector for each value of recalculated indicator buffer. Thus, overriding only this function, we can implement different algorithms for calculating trend direction. In this case, the rest of the indicator parts in fact remain unchanged (its possible, that external parameters will be changing).
Now let's consider the function of trend detection itself - TrendDetector.
int TrendDetector(int _shift, const double& _price[])
{
  double  current_ma;
  int     trend_direction = 0;

  current_ma = SimpleMA(_shift, MAPeriod, _price);

  if(_price[_shift] > current_ma)
  {
    trend_direction = 1;
  }
  else if(_price[_shift] < current_ma)
  {
    trend_direction = -1;
  }

  return(trend_direction);
}
The function performs the following tasks:
- Calculates the simple moving average, starting from bar, set by the _shift argument. It uses the library function SimpleMA.
- Compares the price values on this bar with the moving average value.
- If the price value is more than moving average value, it returns 1, else if the price value is less than moving average value, it returns -1, otherwise it returns zero.
If the function returned zero, it means that the trend could not be detected.
The result of indicator work can be seen on Figure 2 and Figure 3.
3.2. Trend Indicator Based on "Fan" of Moving Averages
Now let's see, how on the basis of this indicator you can create a little more complex indicator, that uses the "fan" of moving averages to detect a trend.
Full source code of the indicator is in the FanTrendDetector.MQ5 file, attached to the article.
The differences of this indicator from the previous one are the following:
- Periods of three moving averages are set in the external parameters:
input int MA1Period = 200; // period value of senior moving average
input int MA2Period = 50;  // period value of medium moving average
input int MA3Period = 21;  // period value of junior moving average
- Another TrendDetector function:
int TrendDetector(int _shift, const double& _price[])
{
  double  current_ma1, current_ma2, current_ma3;
  int     trend_direction = 0;

  current_ma1 = SimpleMA(_shift, MA1Period, _price);
  current_ma2 = SimpleMA(_shift, MA2Period, _price);
  current_ma3 = SimpleMA(_shift, MA3Period, _price);

  if(current_ma3 > current_ma2 && current_ma2 > current_ma1)
  {
    trend_direction = 1;
  }
  else if(current_ma3 < current_ma2 && current_ma2 < current_ma1)
  {
    trend_direction = -1;
  }

  return(trend_direction);
}
The function checks if moving averages are located in correct order, by comparing them with each other using the if...else operators and their order. If the averages are arranged in increasing order, then it returns 1 - uptrend. If the averages are arranged in decreasing order, then it returns -1 - downtrend. If both conditions, checked in if block, are false, it returns zero (trend could not be detected). The function has two input arguments - the shift in the buffer of analyzed bar and the buffer itself with a price series.
The rest of indicator parts are the same as in the previous one.
3.3. Trend Indicator Based on ZigZag Indicator
Now let's consider the indicator, that uses fractures of Zigzag to determine the extrema and detect the trend direction according to Charles Dow. Full source code of the indicator is in the ZigZagTrendDetector.MQ5 file, attached to the article.
The external variables are assigned with parameters values of external indicator ZigZag:
//---------------------------------------------------------------------
//  External parameters:
//---------------------------------------------------------------------
input int   ExtDepth = 5;
input int   ExtDeviation = 5;
input int   ExtBackstep = 3;
//---------------------------------------------------------------------
An important difference of this indicator - the number of indicator buffers. Here besides the display buffer we use two more calculation buffers. Therefore, we changed the appropriate setting in the indicator code:
#property indicator_buffers 3
Add two additional buffers. They will store extrema, obtained from external indicator ZigZag:
double ZigZagHighs[];  // zigzag's upper turnarounds
double ZigZagLows[];   // zigzag's lower turnarounds
It is also necessary to make changes to indicator initialization event handler - set these two additional buffers as calculation buffers:
//  Buffers to store zigzag's turnarounds
SetIndexBuffer(1, ZigZagHighs, INDICATOR_CALCULATIONS);
SetIndexBuffer(2, ZigZagLows, INDICATOR_CALCULATIONS);
In the calculation code of the OnCalculate function we also have to provide reading zigzag fractures into our buffers. This is done as follows:
//  Copy upper and lower zigzag's turnarounds to buffers:
  CopyBuffer(indicator_handle, 1, 0, _rates_total - _prev_calculated, ZigZagHighs);
  CopyBuffer(indicator_handle, 2, 0, _rates_total - _prev_calculated, ZigZagLows);

//  Loop of calculating the indicator buffer values:
  for(i = start; i < _rates_total; i++)
  {
    TrendBuffer[i] = TrendDetector(i);
  }
The TrendDetector function looks like this:
//---------------------------------------------------------------------
//  Determine the current trend direction:
//---------------------------------------------------------------------
//  Returns:
//    -1 - Down trend
//    +1 - Up trend
//     0 - trend is not defined
//---------------------------------------------------------------------
double    ZigZagExtHigh[2];
double    ZigZagExtLow[2];
//---------------------------------------------------------------------
int TrendDetector(int _shift)
{
  int    trend_direction = 0;

//  Find last four zigzag's turnarounds:
  int    ext_high_count = 0;
  int    ext_low_count = 0;
  for(int i = _shift; i >= 0; i--)
  {
    if(ZigZagHighs[i] > 0.1)
    {
      if(ext_high_count < 2)
      {
        ZigZagExtHigh[ext_high_count] = ZigZagHighs[i];
        ext_high_count++;
      }
    }
    else if(ZigZagLows[i] > 0.1)
    {
      if(ext_low_count < 2)
      {
        ZigZagExtLow[ext_low_count] = ZigZagLows[i];
        ext_low_count++;
      }
    }

//  If two pairs of extrema are found, break the loop:
    if(ext_low_count == 2 && ext_high_count == 2)
    {
      break;
    }
  }

//  If required number of extrema is not found, the trend can't be determined:
  if(ext_low_count != 2 || ext_high_count != 2)
  {
    return(trend_direction);
  }

//  Check Dow's condition fulfillment:
  if(ZigZagExtHigh[0] > ZigZagExtHigh[1] && ZigZagExtLow[0] > ZigZagExtLow[1])
  {
    trend_direction = 1;
  }
  else if(ZigZagExtHigh[0] < ZigZagExtHigh[1] && ZigZagExtLow[0] < ZigZagExtLow[1])
  {
    trend_direction = -1;
  }

  return(trend_direction);
}
Here we search the last four zigzag's extrema. Notice that searching goes back in history. That's why, the index in the for loop decreases on each search iteration down to zero. If the extrema are found, they are compared with each other for consistency of trend definition according to Dow. There are two possible extrema locations - for uptrend and for downtrend. These variants are checked by the if...else operators.
3.4. Trend Indicator Based on ADX Indicator
Consider the ADXTrendDetector trend indicator, that uses the ADX indicator. Full source code of the indicator is in the ADXTrendDetector.MQ5 file, attached to the article. The external parameters are assigned with values of external indicator ADX:
//---------------------------------------------------------------------
//      External parameters
//---------------------------------------------------------------------
input int  PeriodADX     = 14;
input int  ADXTrendLevel = 20;
The TrendDetector function looks like this:
//---------------------------------------------------------------------
//  Determine the current trend direction:
//---------------------------------------------------------------------
//  Returns:
//    -1 - Down trend
//    +1 - Up trend
//     0 - trend is not defined
//---------------------------------------------------------------------
int TrendDetector(int _shift)
{
  int     trend_direction = 0;
  double  ADXBuffer[ 1 ];
  double  PlusDIBuffer[ 1 ];
  double  MinusDIBuffer[ 1 ];

//  Copy ADX indicator values to buffers:
  CopyBuffer(indicator_handle, 0, _shift, 1, ADXBuffer);
  CopyBuffer(indicator_handle, 1, _shift, 1, PlusDIBuffer);
  CopyBuffer(indicator_handle, 2, _shift, 1, MinusDIBuffer);

//  If ADX value is considered (trend strength):
  if(ADXTrendLevel > 0)
  {
    if(ADXBuffer[0] < ADXTrendLevel)
    {
      return(trend_direction);
    }
  }

//  Check +DI and -DI positions relative to each other:
  if(PlusDIBuffer[0] > MinusDIBuffer[0])
  {
    trend_direction = 1;
  }
  else if(PlusDIBuffer[0] < MinusDIBuffer[0])
  {
    trend_direction = -1;
  }

  return( trend_direction );
}
Using the CopyBuffer() get the needed values of indicator buffers from external indicator ADX for number of bar, given by the _shift argument. Next, analyze the positions of the +DI and -DI lines relative to each other. If necessary, consider the trend strength - if it is less than defined, then trend is not detected.
3.5. Trend Indicator Based on NTRT Indicator
The structure of the NRTRTrendDetector trend indicator, based on NRTR, is similar to the previous one. Full source code of the indicator is in the NRTRTrendDetector.MQ5 file, attached to the article.
The first difference - in the block of external parameters:
//---------------------------------------------------------------------
//      External parameters:
//---------------------------------------------------------------------
input int     ATRPeriod =  40;    // ATR period, in bars
input double  Koeff     = 2.0;    // Coefficient of ATR value change
//---------------------------------------------------------------------
The second difference - in the TrendDetector function of detecting trend direction:
//---------------------------------------------------------------------
//      Determine the current trend direction:
//---------------------------------------------------------------------
//  Returns:
//    -1 - Down trend
//    +1 - Up trend
//     0 - trend is not defined
//---------------------------------------------------------------------
int TrendDetector(int _shift)
{
  int     trend_direction = 0;
  double  Support[1];
  double  Resistance[1];

//      Copy NRTR indicator values to buffers::
  CopyBuffer(indicator_handle, 0, _shift, 1, Support);
  CopyBuffer(indicator_handle, 1, _shift, 1, Resistance);

//  Check values of indicator lines:
  if(Support[0] > 0.0 && Resistance[0] == 0.0)
  {
    trend_direction = 1;
  }
  else if(Resistance[0] > 0.0 && Support[0] == 0.0)
  {
    trend_direction = -1;
  }

  return( trend_direction );
}
Here we read the values from two buffers of the external indicator NRTR with indexes 0 and 1. The values in the Support buffer are different from zero when there is uptrend, and the values in the Resistance buffer are different from zero when there is the downtrend.
3.6. Trend Indicator Based on Heiken Ashi Candlesticks
Now let's consider the the trend indicator, that uses Heiken Ashi candlesticks.
In this case, we won't call the external indicator, but will calculate candles by ourselves. This will improve indicator performance and free CPU for more important tasks. Full source code of the indicator is in the HeikenAshiTrendDetector.MQ5 file, attached to the article.
Since the Heiken Ashi indicator does not assume setting of external parameters, we can remove block with the input operators. Major changes await us in the handler of indicator recalculation event. Here we will use an alternative variant of handler, that provides access to all price arrays of current chart.
The OnCalculate() function now looks like this:
int OnCalculate(const int _rates_total,
                const int _prev_calculated,
              const datetime& Time[],
              const double& Open[],
              const double& High[],
              const double& Low[],
              const double& Close[],
              const long& TickVolume[],
              const long& Volume[],
              const int& Spread[])
{
  int     start, i;
  double  open, close, ha_open, ha_close;

//  Determine the initial bar for indicator buffer calculation:
  if(_prev_calculated == 0)
  {
    open = Open[0];
    close = Close[0];
    start = 1;
  }
  else
  {
    start = _prev_calculated - 1;
  }

//  Loop of calculating the indicator buffer values:
  for(i = start; i < _rates_total; i++)
  {
//  Heiken Ashi candlestick open price:
    ha_open = (open + close) / 2.0;

//  Heiken Ashi candlestick close price:
    ha_close = (Open[i] + High[i] + Low[i] + Close[i]) / 4.0;

    TrendBuffer[i] = TrendDetector(ha_open, ha_close);

    open = ha_open;
    close = ha_close;
  }

  return(_rates_total);
}
As for determining the color of Heiken Ashi candles we need only two prices - the open and close, then count only them.
After detecting trend direction through the TrendDetector function call, save the current price values of Heiken Ashi candlesticks into intermediate variables open and close. The TrendDetector function looks very simple. You can insert it into OnCalculate, but for greater versatility in case of algorithm further development and complexity we leave this function. Here is this function:
int TrendDetector(double _open, double _close)
{
  int    trend_direction = 0;

  if(_close > _open)         // if candlestick is growing, then it is the up trend
  {
    trend_direction = 1;
  }
  else if(_close < _open)     // if candlestick is falling, then it is the down trend
  {
    trend_direction = -1;
  }

  return(trend_direction);
}
The function arguments are two prices for Heiken Ashi candlestick - open and close, by which its direction is determined.
4. Example of Using Trend Detection Indicator in Expert
Let's create an Expert Advisor, that uses different indicators. It will be interesting to compare the results of experts, that use different ways of trend detection. First, check the results with the default parameters, then try to adjust them to find the best ones.
In this case, the purpose of creating Expert Advisors - is to compare methods of trend detection by accuracy and speed. Therefore, let's formulate the general principles of creating all the Expert Advisors:
- Buy position opens when trend changes from the down to the up or from the undefined to the up.
- Sell position opens when trend changes from the up to the down or from the undefined to the down.
-
Position closes when trend changes its direction to reverse or undefined.
- Expert Advisor must open/close a position when new bar opens (when there is a corresponding signal).
All trend indicators that we've created contain indicator buffer with zero index, which stores the required data about trend direction. We'll use it in Expert Advisors to get a signal to open/close position.
Because we need trading functions, we've included the corresponding library, that is installed along with MetaTrader 5. This library contains the CTrade class and several methods of working with positions and orders. This simplifies the routine work with trading functions. The library is included in the following line:
#include <Trade\Trade.mqh>
We will use two methods from it: position opening and closing. The first method allows you to open a position of given direction and volume:
PositionOpen(const string symbol,
             ENUM_ORDER_TYPE order_type,
             double volume, double price,
             double sl, double tp, const string comment )
The input arguments are as follows:
- symbol - name of instrument for trade, for example, "EURUSD".
- order_type - direction of position opening, short or long.
- volume - volume of opened position in lots, for example, 0.10.
- price - opening price.
- sl - price of Stop Loss.
- tp - price of Take Profit.
- comment - comment, shown when position is displayed in trade terminal.
The second method allows you to close a position:
PositionClose( const string symbol, ulong deviation )
The input arguments are as follows:
- symbol - name of instrument for trade, for example, "EURUSD".
- deviation - maximal allowed deviation from current price (in points) when closing a position.
Let's consider in details the structure of Expert Advisor, that uses the MATrendDetector indicator. Full source code of Expert Advisor is in the MATrendExpert.MQ5 file, attached to the article. The first major block of the expert - is block of setting external parameters.
input double Lots = 0.1;
input int    MAPeriod = 200;
The Lots parameter of Expert Advisor - is the size of the lot, used when position is opened. To get comparative results of different methods of trend detection, we use the permanent lot without money management. All the other external parameters are used by trend indicators, discussed above. The list and purpose are exactly the same as the corresponding indicator.
The second important block of Expert Advisor - event handler of Expert Advisor initialization.
//---------------------------------------------------------------------
//      Initialization event handler:
//---------------------------------------------------------------------
int OnInit()
{
//  Create external indicator handle for future reference to it:
  ResetLastError();
  indicator_handle = iCustom(Symbol(), PERIOD_CURRENT, "Examples\\MATrendDetector", MAPeriod);

// If initialization was unsuccessful, return nonzero code:
  if(indicator_handle == INVALID_HANDLE)
  {
    Print("MATrendDetector initialization error, Code = ", GetLastError());
    return(-1);
  }
  return(0);
}
Here create handle to refer to the trend indicator, and, if creation was successful, return zero code. If failed to create indicator handle (for example, the indicator was not compiled into EX5 format), we print the message about this and return nonzero code. In this case, Expert Advisor stops its further work and it is unloaded from terminal, with corresponding message in the Journal.
The next block of Expert Advisor - event handler of Expert Advisor deinitialization.
//---------------------------------------------------------------------
//      Indicator deinitialization event handler:
//---------------------------------------------------------------------
void OnDeinit(const int _reason)
{
//  Delete indicator handle:
  if(indicator_handle != INVALID_HANDLE)
  {
    IndicatorRelease(indicator_handle);
  }
}
Here the indicator handle is deleted and its allocated memory is released.
You don't need to do any other actions to deinitialize Expert Advisor.
Next goes the main block of Expert Advisor - handler of event about new teak by the current symbol.
//---------------------------------------------------------------------
//  Handler of event about new tick by the current symbol:
//---------------------------------------------------------------------
int    current_signal = 0;
int    prev_signal = 0;
bool   is_first_signal = true;
//---------------------------------------------------------------------
void OnTick()
{
//  Wait for beginning of a new bar:
  if(CheckNewBar() != 1)
  {
    return;
  }

//  Get signal to open/close position:
  current_signal = GetSignal();
  if(is_first_signal == true)
  {
    prev_signal = current_signal;
    is_first_signal = false;
  }

//  Select position by current symbol:
  if(PositionSelect(Symbol()) == true)
  {
//  Check if we need to close a reverse position:
    if(CheckPositionClose(current_signal) == 1)
    {
      return;
    }
  }

//  Check if there is the BUY signal:
  if(CheckBuySignal(current_signal, prev_signal) == 1)
  {
    CTrade  trade;
    trade.PositionOpen(Symbol(), ORDER_TYPE_BUY, Lots, SymbolInfoDouble(Symbol(), SYMBOL_ASK ), 0, 0);
  }

//  Check if there is the SELL signal:
  if(CheckSellSignal(current_signal, prev_signal) == 1)
  {
    CTrade  trade;
    trade.PositionOpen(Symbol(), ORDER_TYPE_SELL, Lots, SymbolInfoDouble(Symbol(), SYMBOL_BID ), 0, 0);
  }

//  Save current signal:
  prev_signal = current_signal;
}
Let's consider the auxiliary functions, that are used by Expert Advisor.
First of all, our Expert Advisor has to check the signal to open another new bar on the chart. For this the CheckNewBar function is used:
//---------------------------------------------------------------------
//  Returns flag of a new bar:
//---------------------------------------------------------------------
//  - if it returns 1, there is a new bar
//---------------------------------------------------------------------
int CheckNewBar()
{
  MqlRates  current_rates[1];

  ResetLastError();
  if(CopyRates(Symbol(), Period(), 0, 1, current_rates)!= 1)
  {
    Print("CopyRates copy error, Code = ", GetLastError());
    return(0);
  }

  if(current_rates[0].tick_volume>1)
  {
    return(0);
  }

  return(1);
}
Presence of a new bar is determined by value of tick volume. When opening a new bar, the volume for it is initially equal to zero (since there were no quotes). With new tick coming the size becomes equal to 1.
In this function we will create the current_rates[] array of MqlRates structures, consisting of one element, copy the current prices and volumes information into it, and then check the value of tick volume.
In our event handler about new tick by the current symbol, we will use this function the following way:
//  Wait for beginning of a new bar:
if(CheckNewBar()!= 1)
{
  return;
}
So, new bar opens, and you can get a signal about the current trend direction. This is done as follows:
//  Get signal to open/close position:
  current_signal = GetSignal();
  if(is_first_signal == true)
  {
    prev_signal = current_signal;
    is_first_signal = false;
  }
Since we need to track changes in the trend, it is necessary to remember the value of trend on the previous bar. In the piece of code above, for this we use the prev_signal variable. Also, you should use the flag, signaling that this is the first signal (there is no previous one yet). This is the is_first_signal variable. If the flag has value true, we initialize the prev_signal variable with initial value.
Here we use the GetSignal function, that returns the current trend direction, obtained from our indicator. It looks like this:
//---------------------------------------------------------------------
//      Get signal to open/close position:
//---------------------------------------------------------------------
int GetSignal()
{
  double    trend_direction[1];

//  Get signal from trend indicator:
  ResetLastError();
  if(CopyBuffer(indicator_handle, 0, 0, 1, trend_direction) != 1)
  {
    Print("CopyBuffer copy error, Code = ", GetLastError());
    return(0);
  }

  return((int)trend_direction[0]);
}
The data of trend indicator are copied from the zero buffer to our array trend_direction, consisting of one element. And the value of array element is returned from the function. Also the double type is casted to the int type to avoid compiler warning.
Before opening new position, you should check if it's necessary to close the opposite position, opened earlier. You should also check if there is already an opened position in the same direction. All this is done by the following piece of code:
//  Select position by current symbol:
  if(PositionSelect(Symbol()) == true)
  {
//  Check if we need to close a reverse position:
    if(CheckPositionClose(current_signal) == 1)
    {
      return;
    }
  }
In order to get access to position, first it must be selected - this is done using the PositionSelect() function for the current symbol. If the function returns true, then position exists and it was successfully selected, so you can manipulate it.
To close the opposite position the CheckPositionClose function is used:
//---------------------------------------------------------------------
//  Check if we need to close position:
//---------------------------------------------------------------------
//  Returns:
//    0 - no open position
//    1 - position already opened in signal's direction
//---------------------------------------------------------------------
int CheckPositionClose(int _signal)
{
  long    position_type = PositionGetInteger(POSITION_TYPE);

  if(_signal == 1)
  {
//  If there is the BUY position already opened, then return:
    if(position_type == (long)POSITION_TYPE_BUY)
    {
      return(1);
    }
  }

  if(_signal==-1)
  {
//  If there is the SELL position already opened, then return:
    if( position_type == ( long )POSITION_TYPE_SELL )
    {
      return(1);
    }
  }

//  Close position:
  CTrade  trade;
  trade.PositionClose(Symbol(), 10);

  return(0);
}
First, check whether the position is open in the trend direction. If so, the function returns 1 and current position is not closed. If position is open in the opposite trend direction, then you must close it. This is done by the PositionClose method described above. Since the open position is no more, it returns zero.
Once all the necessary checks and actions for existing positions are made, you have to check the presence of a new signal. This is done by the following piece of code:
//  Check if there is the BUY signal:
if(CheckBuySignal(current_signal, prev_signal)==1)
{
  CTrade  trade;
  trade.PositionOpen(Symbol(), ORDER_TYPE_BUY, Lots, SymbolInfoDouble(Symbol(), SYMBOL_ASK), 0, 0);
}
If there is the Buy signal, then open long position with given volume by current price SYMBOL_ASK . Since all positions are closed by the opposite signal, then Take Profit and Stop Loss are not used. The Expert Advisor is "always in the market".
In real trade it's recommended to use a protective Stop Loss in case of unforeseen circumstances, such as loss of connection with DC server and other force majeure conditions.
For the Sell signals everything is similar:
//  Check if there is the SELL signal:
if(CheckSellSignal(current_signal, prev_signal) == 1)
{
  CTrade  trade;
  trade.PositionOpen(Symbol(), ORDER_TYPE_SELL, Lots, SymbolInfoDouble(Symbol(), SYMBOL_BID), 0, 0);
}
The only difference is in the sell price - SYMBOL_BID.
The presence of a signal is checked by the CheckBuySignal function - to buy and by the CheckSellSignal function - to sell. These functions are very simple and clear:
//---------------------------------------------------------------------
//  Check if signal has changed to BUY:
//---------------------------------------------------------------------
//  Returns:
//    0 - no signal
//    1 - there is the BUY signal
//---------------------------------------------------------------------
int CheckBuySignal(int _curr_signal, int _prev_signal)
{
//  Check if signal has changed to BUY:
  if((_curr_signal==1 && _prev_signal==0) || (_curr_signal==1 && _prev_signal==-1))
  {
    return(1);
  }

  return(0);
}

//---------------------------------------------------------------------
//  Check if there is the SELL signal:
//---------------------------------------------------------------------
//  Returns:
//    0 - no signal
//    1 - there is the SELL signal
//---------------------------------------------------------------------
int CheckSellSignal(int _curr_signal, int _prev_signal)
{
//  Check if signal has changed to SELL:
  if((_curr_signal==-1 && _prev_signal==0) || (_curr_signal==-1 && _prev_signal==1))
  {
    return(1);
  }

  return(0);
}
Here we check if trend has changed to the opposite direction or if trend direction has appeared. If any of these conditions is satisfied, the function returns signal presence.
In general, such scheme of Expert Advisor gives quite universal structure, that can be easily upgraded and expanded to fit more complex algorithms.
Other Expert Advisor are built exactly the same. There are significant differences only in the block of external parameters - they must correspond to the used trend indicator and must be passed as arguments when creating indicator handle.
Let's consider the results of our first Expert Advisor on history data. We will use the EURUSD history, in the range from 01.04.2004 to 06.08.2010 on daily bars. After running Expert Advisor in Strategy Tester with default parameters, we get the following results:
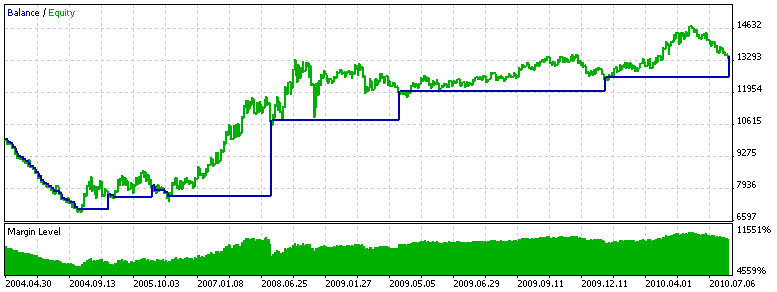
Figure 8. Test Results of Expert Advisor Using the MATrendDetector Indicator
|
Strategy Tester Report
|
||||||||||||
|
MetaQuotes-Demo (Build 302)
|
||||||||||||
|
|
||||||||||||
|
Settings
|
||||||||||||
| Expert: | MATrendExpert | |||||||||||
| Symbol: | EURUSD | |||||||||||
| Period: | Daily (2004.04.01 - 2010.08.06) | |||||||||||
| Inputs: | Lots=0.100000 | |||||||||||
|
|
MAPeriod=200 | |||||||||||
| Broker: | MetaQuotes Software Corp. | |||||||||||
| Currency: | USD | |||||||||||
| Initial Deposit: | 10 000.00 | |||||||||||
|
|
||||||||||||
|
Results
|
||||||||||||
| Bars: | 1649 | Ticks: | 8462551 | |||||||||
| Total Net Profit: | 3 624.59 | Gross Profit: | 7 029.16 | Gross Loss: | -3 404.57 | |||||||
| Profit Factor: | 2.06 | Expected Payoff: | 92.94 | |||||||||
| Recovery factor: | 1.21 | Sharpe Ratio: | 0.14 | |||||||||
|
|
||||||||||||
| Balance Drawdown: | ||||||||||||
| Balance Drawdown Absolute: | 2 822.83 | Balance Drawdown Maximal: | 2 822.83 (28.23%) | Balance Drawdown Relative: | 28.23% (2 822.83) | |||||||
| Equity Drawdown: | ||||||||||||
| Equity Drawdown Absolute: | 2 903.68 | Equity Drawdown Maximal: | 2 989.93 (29.64%) | Equity Drawdown Relative: | 29.64% (2 989.93) | |||||||
|
|
||||||||||||
| Total Trades: | 39 | Short Trades (won %): | 20 (20.00%) | Long Trades (won %): | 19 (15.79%) | |||||||
| Total Deals: | 78 | Profit Trades (% of total): | 7 (17.95%) | Loss Trades (% of total): | 32 (82.05%) | |||||||
|
|
Largest profit trade: | 3 184.14 | Largest loss trade (% of total): | -226.65 | ||||||||
|
|
Average profit trade: | 1 004.17 | Average loss trade (% of total): | -106.39 | ||||||||
|
|
Maximum consecutive wins ($): | 4 (5 892.18) | Maximum consecutive losses ($): | 27 (-2 822.83) | ||||||||
|
|
Maximum consecutive profit (count): | 5 892.18 (4) | Maximum consecutive loss (count): | -2 822.83 (27) | ||||||||
|
|
Average consecutive wins: | 2 | Average consecutive losses: | 8 | ||||||||
|
|
||||||||||||
|
|
||||||||||||
|---|---|---|---|---|---|---|---|---|---|---|---|---|
In general it looks good, except the section from the beginning of testing until 22.09.2004. There is no guarantee that this section will not be repeated in the future. If you look on the chart of this period, you can see that there was predominant lateral movement in limited range. Under these conditions, our simple trend expert was not so good. Here is the picture of this period with deals placed on it:
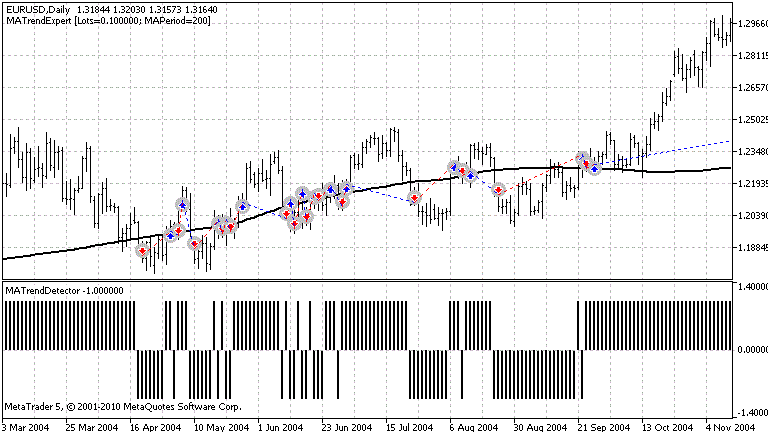
Figure 9. Section with Lateral Movement
Also there is the SMA200 moving average on the chart.
Now let's see what will show more "advanced" Expert Advisor using indicator with several moving averages - on the same interval and with default parameters:
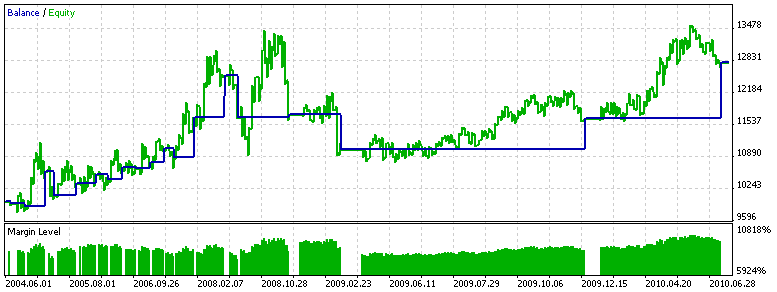
Figure 10. Test Results of Expert Advisor Using the FanTrendDetector Indicator
|
Strategy Tester Report
|
||||||||||||
|
MetaQuotes-Demo (Build 302)
|
||||||||||||
|
|
||||||||||||
|
Settings
|
||||||||||||
| Expert: | FanTrendExpert | |||||||||||
| Symbol: | EURUSD | |||||||||||
| Period: | Daily (2004.04.01 - 2010.08.06) | |||||||||||
| Inputs: | Lots=0.100000 | |||||||||||
|
|
MA1Period=200 | |||||||||||
|
|
MA2Period=50 | |||||||||||
|
|
MA3Period=21 | |||||||||||
| Broker: | MetaQuotes Software Corp. | |||||||||||
| Currency: | USD | |||||||||||
| Initial Deposit: | 10 000.00 | |||||||||||
|
|
||||||||||||
|
Results
|
||||||||||||
| Bars: | 1649 | Ticks: | 8462551 | |||||||||
| Total Net Profit: | 2 839.63 | Gross Profit: | 5 242.93 | Gross Loss: | -2 403.30 | |||||||
| Profit Factor: | 2.18 | Expected Payoff: | 149.45 | |||||||||
| Recovery factor: | 1.06 | Sharpe Ratio: | 0.32 | |||||||||
|
|
||||||||||||
| Balance Drawdown: | ||||||||||||
| Balance Drawdown Absolute: | 105.20 | Balance Drawdown Maximal: | 1 473.65 (11.73%) | Balance Drawdown Relative: | 11.73% (1 473.65) | |||||||
| Equity Drawdown: | ||||||||||||
| Equity Drawdown Absolute: | 207.05 | Equity Drawdown Maximal: | 2 671.98 (19.78%) | Equity Drawdown Relative: | 19.78% (2 671.98) | |||||||
|
|
||||||||||||
| Total Trades: | 19 | Short Trades (won %): | 8 (50.00%) | Long Trades (won %): | 11 (63.64%) | |||||||
| Total Deals: | 38 | Profit Trades (% of total): | 11 (57.89%) | Loss Trades (% of total): | 8 (42.11%) | |||||||
|
|
Largest profit trade: | 1 128.30 | Largest loss trade (% of total): | -830.20 | ||||||||
|
|
Average profit trade: | 476.63 | Average loss trade (% of total): | -300.41 | ||||||||
|
|
Maximum consecutive wins ($): | 2 (1 747.78) | Maximum consecutive losses ($): | 2 (-105.20) | ||||||||
|
|
Maximum consecutive profit (count): | 1 747.78 (2) | Maximum consecutive loss (count): | -830.20 (1) | ||||||||
|
|
Average consecutive wins: | 2 | Average consecutive losses: | 1 | ||||||||
|
|
||||||||||||
Much better! If you look at our "problem" section, which the previous expert gave up before, the picture will be the following:
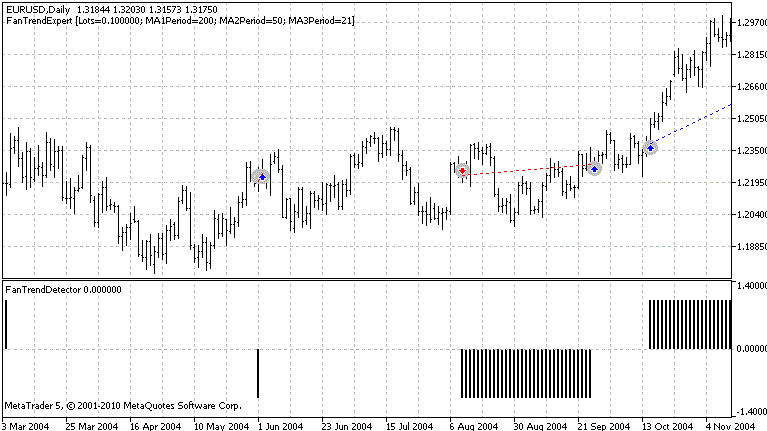
Figure 11. FanTrendExpert Results on Section with Lateral Movement
Compare it with Figure 9 - it's obvious, that the number of false alarms of trend change has been decreased. But the number of deals has been reduces by half, which is quite logical. When analyzing the curve of balance/equity of both Expert Advisors, you can see that many deals were closed less than optimal in terms of getting the maximum profit. Therefore, the next upgrade of Expert Advisor - is improvement of the deal closing algorithm. But this is beyond the scope of this article. The readers may do this by themselves.
5. Testing Results of Expert Advisors
Let's test all our experts. The results on all available history range since 1993 till 2010 on pair EURUSD and timeframe D1 are presented below.
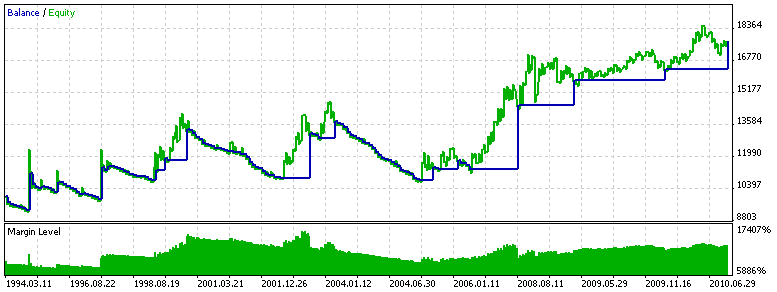
Figure 12. Testing MATrendExpert
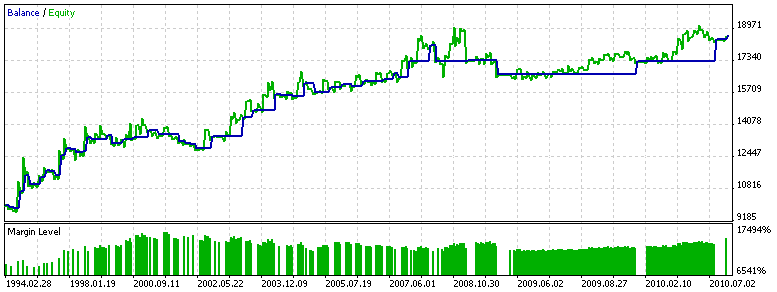
Figure 13. Testing FanTrendExpert
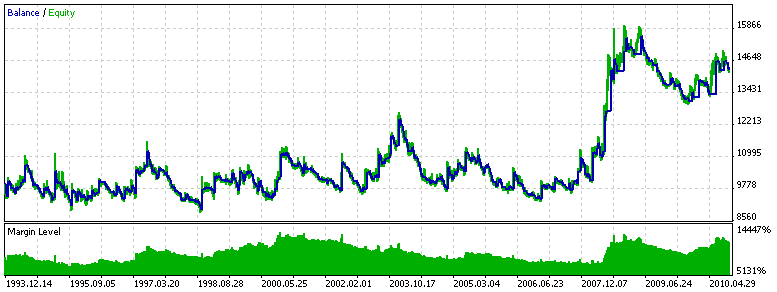
Figure 14. Testing ADXTrendExpert (ADXTrendLevel = 0)
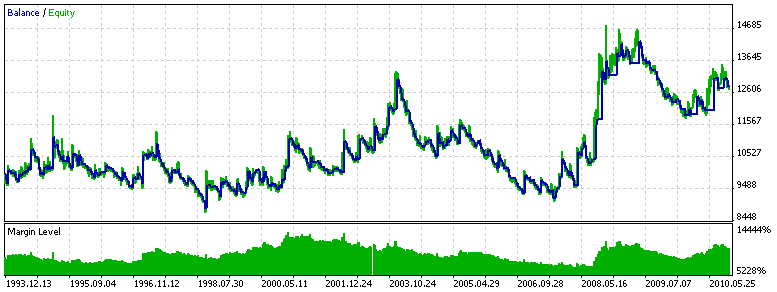
Figure 15. Testing ADXTrendExpert (ADXTrendLevel = 20)
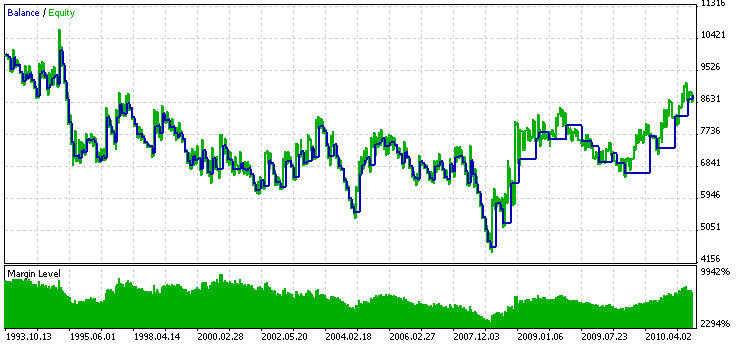
Figure 16. Testing NRTRTrendExpert
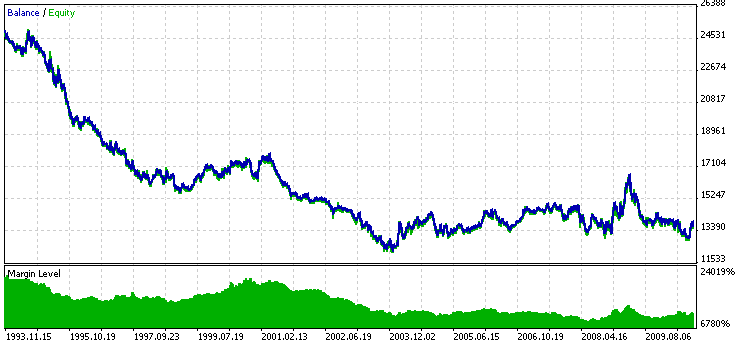
Figure 17. Testing Heiken Ashi
Let's consider testing results.
As leaders there are two most common Expert Advisors - on one moving average and the "fan" of moving averages. Indeed, these experts are the closest to the rule of following the trend (and, hence, the price), simply by using a smoothed series of prices for the last period of time. Because we use rather "heavy" moving average with period of 200, the impact of market volatility seems to be diminishing.
Low number of deals from these Expert Advisor is not disadvantage, since time of position retention may last up to several months - following the 200-day trend. Interestingly, how MATrendExpert alternate trend areas, where balance is growing, flat (in the context of the expert), where money are being lost.
Trend detection method on the ADX indicator also gave good results. There the PeriodADX was changed a little to the value of 17, which gives more uniform results throughout history. Filter effect by trend strength is not significant. May be you need to adjust the ADXTrendLevel parameter, or even dynamically set it depending on the current market volatility. There are several drawdown periods, and therefore additional measures to equalize the balance curve are required.
NRTR indicator showed practically zero profitability using the default settings, both on the whole range of testing and on long randomly chosen interval. To some extent this is a sign of stability of this trend detection method. Perhaps, adjusting parameters will make this Expert Advisor profitable, i.e. optimization is required.
Heiken Ashi based Expert Advisor was obviously unprofitable. Although it looks nice on the history, probably because of the redraw in real time test results are far from ideal. Perhaps better results will be achieved using a smoothed version of this indicator - Smoothed Heiken Ashi, which is not so prone to redraw.
Definitely, all Expert Advisor will benefit from system of conducting an open position with dynamic pulling of stop level and with creating a target level. Also it would be great to have system of capital management, allowing to minimize the drawdown and may be to increase profit on the long interval.
Conclusion
Thereby, it's not so difficult to write code that detects a trend. The main thing here - working and a sensible idea, exploiting some laws of the market. And the more fundamental these laws will be, the more confident you'll be in trading system based on these laws - it will not break after a short period of working.
Translated from Russian by MetaQuotes Ltd.
Original article: https://www.mql5.com/ru/articles/136
 Adaptive Trading Systems and Their Use in the MetaTrader 5 Client Terminal
 Interview with Alexander Topchylo (ATC 2010)
 Contest of Expert Advisors inside an Expert Advisor
 Using the TesterWithdrawal() Function for Modeling the Withdrawals of Profit
- Free trading apps
- Over 8,000 signals for copying
- Economic news for exploring financial markets
You agree to website policy and terms of use
How to detect forex trends
Detecting a trend is an important part of predicting direction in a currency pair. Tomorrow’s prices usually follow or continue today’s trend. There will, of course, be reversals and ranging behavior within the trend but it is easier to trade with a known trend than to predict when it changes. The task of the forex trader is to detect variations or waves of sentiment. The trader needs to ask: is there a shape to changes in sentiment and can it be detected? To answer this question, we can turn to price break charts (also called three-line break charts). In recent months, Bloomberg Professional stations added these charts. They also are available in many retail charting programs such as eSignal and ProRealTime.
Price break charts show only a new high close or a new low close. For example, if a trader using a candlestick chart of a daytime interval converts it to a three-line price break chart, he would see the price action from a different vantage point. The price break chart would only show consecutive new day high closes, or consecutive new day low closes. If no new high or new low is reached, then no additional bar would appear. But when the price reverses, it shows a new column only if the price reverses three previous highs (downward reversal) or three previous lows. This is why it is called a three-line break chart. The conditions for a bullish and bearish reversal are easily identified.
Three-line break charts enable significant insights into the shape of sentiment in the price action. A trader can detect the prevailing sentiment, how strong it is, whether a change in sentiment has occurred and project where the next trend reversal will occur. Several examples of using the three-line break as an indicator occurred in the GBP/USD pair in 2009 (see “Show me the move”).
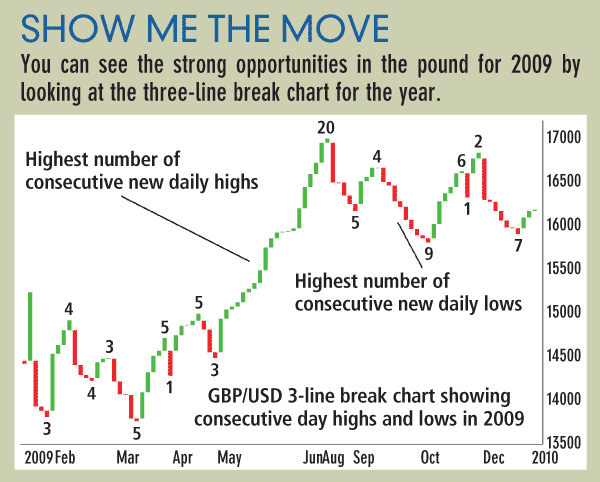
The year started with a series of three consecutive new lows. It then reversed to a distance of four new consecutive highs. The sequence reversed back to four new consecutive lows followed by three consecutive new highs. In April, we see a very significant sentiment event, a flip-flop. This is a new downward reversal followed immediately by an upward reversal. In other words, market sentiment did not continue into a series. When a flip-flop occurs, it is rarely followed by another immediate reversal and therefore is a signal that the trend direction after the flip-flop will continue for a longer distance. This is exactly what occurred. The GBP/USD flipped from a low of 1.4252 on March 30 to a high of 1.5002 on April 15.
Also in the pound, we see a long sequence of 20 new consecutive day highs that occurred between May 1 and June 11, taking it from 1.4490 to 1.6598. While the ultimate length of the sequence is not predicable, what was clear to the trader was that the previous highest uptrend sequence before the long run up was five new consecutive highs. When a previous sequence of highs or lows is broken by a new sequence, this is an alert that the sentiment is becoming stronger than ever.
After the 20 new consecutive highs were achieved, GBP/USD no longer had the energy to repeat this sequence. It entered into a series of smaller consecutive new daily highs, and reversals into consecutive new lows. GBP/USD ended with a reversal up with two consecutive new daily highs.
Price break charts can be used for any time frame. Scalpers could use a one-minute price break to spot what is the intra-hour prevailing sentiment. While price break charts do not predict the duration, or the distance of a new trend, they reveal the strength of the prevailing sentiment. That can be enough to get an edge for the scalper or the long-term trader.