
Creating Information Boards Using Standard Library Classes and Google Chart API
Introduction
To make life easier for programmers of the MQL5 language, designers have created a Standard Library, which covers almost all of the API MQL5 functions, and makes working with them much easier and convenient. This article will attempt to create an information board, with a maximum number of classes used by the standard library.
1. Overview of the Standard Library classes
So, what exactly is this library? The Documentation section of the website states that it is composed of:
- Basic class CObject
- Classes of data
- Classes for Graphic Objects
- Class for working with chart
- Classes for file operations
- Class for string operations
- Classes for working with indicators and Timeseries
- Trade Classes
The files, containing the codes of all classes, are located in the MQL5/Include folder. When viewing the library code, you will notice, that it provides only the classes, but not the functions. Consequently, to use it, you must have some knowledge of object-oriented programming (OOP).
All of the library classes (except trading ones) stem from CObject base class. To show it, we'll try to construct a Class diagram, since we have everything that this requires - the base class and its heirs. Since the MQL5 language is basically a subset of C++, let us use the IBM Rational Rose instrument, which provides tools for reverse -engineering of C++ projects, for the automatic construction of the diagram.
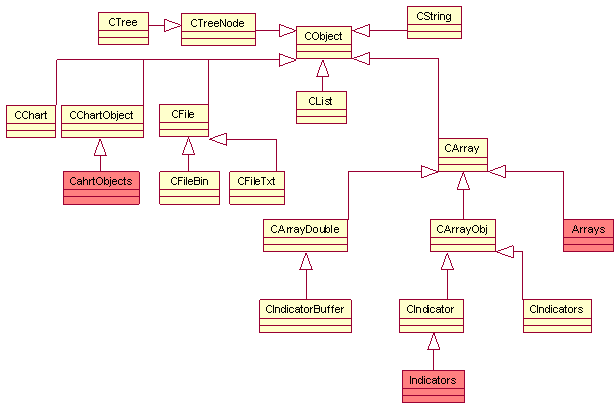
Figure 1. Diagram of the Standard Library classes
We will not be showing the class properties and methods, due to the cumbersome diagrams that we would obtain. We will also omit aggregations, since they are of no importance to us. As a result, we are left only with generalizations (inheritances), which allow us to find out what properties and methods the classes obtain.
As can be seen from the diagram, each library component that works with lines, files, charts, graphic objects, and arrays, has its own base class (CString, CFile, CChart, CChartObject and CArray, Respectively), inherited from the CObject. The base class for working with indicators CIndicator and his auxiliary CIndicators class are inherited from the CArrayObj, while the access to indicator buffer class CIndicatorBuffer is inherited from the CArrayDouble.
Crimson color in the diagram marks the non-existent in actuality classes, indicators, arrays, and ChartObjects - they are sets, which include classes for working with indicators, arrays, and graphic objects. Since there is a large number of them, and they are inherited from a single parent, I allowed for some simplification, so as not to clutter the diagram. For example, the Indicator includes CiDEMA, CiStdDev, etc.
It is also worth noting that the class diagram can also be constructed using the automatic creation of Doxygen documentation system. It is somewhat easier to do this in this system rather than in Rational Rose. More about Doxygen can be found in the article Auto-Generated Documentation for MQL5 Code.
2. The problem
Let's try to create an information table with the maximum number of the Standard Library classes.
What will the board display? Something like a detailed report of MetaTrader 5, ie:

Figure 2. The appearance of the detailed report
As we can see, the report displays a balance chart and some trading figures. More information about the methods for calculating these indicators can be found in the article What the Numbers in the Expert Testing Report Mean.
Since the board is used purely for informational purposes, and does not perform any trading operations, it will be best to implement it as an indicator, in a separate window, in order to avoid closing the actual chart. Moreover, placing it in a sub-window allows for easy scaling, and even closing the board with a single motion of your mouse.
You may also want to complement the report with a pie chart, which will display the number of transactions made on the instrument, relative to the total number of transactions.
3. Designing the interface
We have defined our objectives - we need a detailed report in the sub-window of the main chart.
We implement our information board as a class. Let's begin:
//+------------------------------------------------------------------+
///The Board class
//+------------------------------------------------------------------+
class Board
  {
//protected data
protected:
///number of the sub-window where the board will be stored
   int               wnd;
///array with the deals data
   CArrayObj        *Data;
///array with the balance data
   CArrayDouble      ChartData;
///array with elements of the interface
   CChartObjectEdit  cells[10][6];
///object for working with the chart
   CChart            Chart;
///object for working with the balance chart
   CChartObjectBmpLabel BalanceChart;
///object for working with the pie chart
   CChartObjectBmpLabel PieChart;
///data for the pie chart
   PieData          *pie_data;
//private data and methods
private:
   double            net_profit;      //these variables will store the calculated characteristics
   double            gross_profit;
   double            gross_loss;
   double            profit_factor;
   double            expected_payoff;
   double            absolute_drawdown;
   double            maximal_drawdown;
   double            maximal_drawdown_pp;
   double            relative_drawdown;
   double            relative_drawdown_pp;
   int               total;
   int               short_positions;
   double            short_positions_won;
   int               long_positions;
   double            long_positions_won;
   int               profit_trades;
   double            profit_trades_pp;
   int               loss_trades;
   double            loss_trades_pp;
   double            largest_profit_trade;
   double            largest_loss_trade;
   double            average_profit_trade;
   double            average_loss_trade;
   int               maximum_consecutive_wins;
   double            maximum_consecutive_wins_usd;
   int               maximum_consecutive_losses;
   double            maximum_consecutive_losses_usd;
   int               maximum_consecutive_profit;
   double            maximum_consecutive_profit_usd;
   int               maximum_consecutive_loss;
   double            maximum_consecutive_loss_usd;
   int               average_consecutive_wins;
   int               average_consecutive_losses;

   ///method of obtaining data about the deals and the balance
   void              GetData();

   ///method of calculating the characteristics
   void              Calculate();

   ///method of chart construction
   void              GetChart(int X_size,int Y_size,string request,string file_name);

   ///method of request to Google Charts API
   string            CreateGoogleRequest(int X_size,int Y_size,bool type);

  ///method of obtaining the optimum font size
   int               GetFontSize(int x,int y);
   string            colors[12];  //array with text presentation of colors
//public methods
public:
///constructor
   void              Board();
///destructor
   void             ~Board();
///method for board update
   void              Refresh();
///method for creating interface elements
   void              CreateInterface();
  };
The protected class data are the interface elements and deal, balance, and pie chart data (the class PieData will be discussed below). Trading indicators and some methods are private. They are private because the user should not have direct access to them, they are calculated within the class, and they can be counted only through calling the appropriate public method.
Also the methods of the interface creation and the calculation of indicators are private, since here you need to endure a rigorous sequence of method calls. For example, it is impossible to calculate the indicators without having the data for calculation, or to update the interface, without having to create it beforehand. Thus, we will not allow the user to "shoot himself in the foot".
Let us immediately deal with constructors and destructors of a class, so we don't have to return to them later:
//+------------------------------------------------------------------+
///Constructor
//+------------------------------------------------------------------+
void Board::Board()
  {
   Chart.Attach();                               //attach the current chart to the class instance
   wnd=ChartWindowFind(Chart.ChartId(),"IT");    //find the indicator window
   Data = new CArrayObj;                         //creating the CArrayObj class instance
   pie_data=new PieData;                         //creating the PieData class instance
   //fill colors array
   colors[0]="003366"; colors[1]="00FF66"; colors[2]="990066";
   colors[3]="FFFF33"; colors[4]="FF0099"; colors[5]="CC00FF";
   colors[6]="990000"; colors[7]="3300CC"; colors[8]="000033";
   colors[9]="FFCCFF"; colors[10]="CC6633"; colors[11]="FF0000";
  }
//+------------------------------------------------------------------+
///Destructor
//+------------------------------------------------------------------+
void Board::~Board()
  {
   if(CheckPointer(Data)!=POINTER_INVALID) delete Data;   //delete the deals data
   if(CheckPointer(pie_data)!=POINTER_INVALID) delete pie_data;
   ChartData.Shutdown();    //and balance data
   Chart.Detach();          //detach from the chart
   for(int i=0;i<10;i++)    //delete all interface elements
      for(int j=0;j<6;j++)
         cells[i][j].Delete();
   BalanceChart.Delete();   //delete the balance chart
   PieChart.Delete();       //and pie chart
  }
In the constructor, we will tie an object of type CChart to the current chart with the help of its Attach() method. The Detach() method, called in the destructor, will untie the chart from the object. Data object, which is a pointer to an object of CArrayObj type, received the object's address, created dynamically using the new operation and removed in destructor using delete operato. Do not forget to check for the object presence usingg the CheckPointer() before deleting, otherwise an error will occur.
More information about the CArrayObj class will be provided further. The Shutdown() method of CArrayDouble class just like any other class is inherited from CArray class (see diagram of classes) will clear and free up the memory, occupied by the object. The Delete() method of CChartObject class heirs removes the object from the chart.
Thus, the constructor allocates the memory and the destructor frees it, and removes the graphical objects, created by the class.
Let's now deal with the interface. As stated above, the CreateInterface() method creates an interface of the board:
//+------------------------------------------------------------------+
///CreateInterface function
//+------------------------------------------------------------------+
void Board::CreateInterface()
  {
   //retrieve the width
   int x_size=Chart.WidthInPixels();
   //and the height of the indicator window
   int y_size=Chart.GetInteger(CHART_HEIGHT_IN_PIXELS,wnd);

    //calculate, how much space will the balance chart take up
   double chart_border=y_size*(1.0-(Chart_ratio/100.0));

   if(Chart_ratio<100)//if the balance chart is taking up the entire table
     {
      for(int i=0;i<10;i++)//create columns
        {
         for(int j=0;j<6;j++)//and rows
           {
            cells[i][j].Create(Chart.ChartId(),"InfBoard "+IntegerToString(i)+" "+IntegerToString(j),
                               wnd,j*(x_size/6.0),i*(chart_border/10.0),x_size/6.0,chart_border/10.0);
            //set selectable property to false
            cells[i][j].Selectable(false);
            //set text as read only
            cells[i][j].ReadOnly(true);
            //set font size
            cells[i][j].FontSize(GetFontSize(x_size/6.0, chart_border/10.0));
            cells[i][j].Font("Arial");    //font name
            cells[i][j].Color(text_color);//font color
           }
        }
     }

   if(Chart_ratio>0)//if the balance chart is required
     {
      //create a balance chart
      BalanceChart.Create(Chart.ChartId(), "InfBoard chart", wnd, 0, chart_border);
      //set selectable property to false
      BalanceChart.Selectable(false);
      //create a pie chart
      PieChart.Create(Chart.ChartId(), "InfBoard pie_chart", wnd, x_size*0.75, chart_border);
      PieChart.Selectable(false);//set selectable property to false
     }

   Refresh();//refresh the board
  }
For a compact arrangement of all the elements, first, using the WidthInPixels() and GetInteger() methods of the class CChart, find out the length and width of the indicator subwindow, in which the board will be located. Then we create the cells, which will include the values of the indicators, using the Create() method of the CChartObjectEdit class (creates the "input field"), all heirs have this method of CChartObject.
Note how convenient it is to use the Standard Library for operations of this type. Without it we would have to create each object, using the function ObjectCreate, and set the properties of objects, using such functions as ObjectSet, which would lead to code redundancy. And when later we would want to change the properties of the objects, it would be necessary to carefully control the objects' names in order to avoid confusion. Now we can simply create an array of graphic objects, and look through it as we desire.
In addition, we can get/set properties of objects using one function, if it was overloaded creators of the class, such as Color() method of CChartObject class. When called with the parameters it sets thems, without parameters - it returns the object color. Place the pie chart next to the balance chart, it will take up a quarter of the total width of the screen.
Refresh method() updates the board. What does this update consist of? We need to count up the indicators, enter them into the graphic objects, and rescale the board, if the size of the window in which it is located had been altered. The board should take up the entire free space of the window.
//+------------------------------------------------------------------+
///Function of the board updating
//+------------------------------------------------------------------+
void Board::Refresh()
  {
   //check the server connection status
   if(!TerminalInfoInteger(TERMINAL_CONNECTED)) {Alert("No connection with the trading server!"); return;}
   //check the permission for importing functions from DLL
   if(!TerminalInfoInteger(TERMINAL_DLLS_ALLOWED)) {Alert("DLLs are prohibited!"); return;}
   //calculate the characteristics
   Calculate();
   //retrieve the width
   int x_size=Chart.WidthInPixels();
   //and the height of the indicator window
   int y_size=Chart.GetInteger(CHART_HEIGHT_IN_PIXELS,wnd);
   //calculate how much space the balance chart will take up
   double chart_border=y_size*(1.0-(Chart_ratio/100.0));

   string captions[10][6]= //array with signatures of interface elements
     {
        {"Total Net Profit:"," ","Gross Profit:"," ","Gross Loss:"," "},
        {"Profit Factor:"," ","Expected Payoff:"," ","",""},
        {"Absolute Drawdown:"," ","Maximal Drawdown:"," ","Relative Drawdown:"," "},
        {"Total Trades:"," ","Short Positions (won %):"," ","Long Positions (won %):"," "},
        {"","","Profit Trades (% of total):"," ","Loss trades (% of total):"," "},
        {"Largest","","profit trade:"," ","loss trade:"," "},
        {"Average","","profit trade:"," ","loss trade:"," "},
        {"Maximum","","consecutive wins ($):"," ","consecutive losses ($):"," "},
        {"Maximal","","consecutive profit (count):"," ","consecutive loss (count):"," "},
        {"Average","","consecutive wins:"," ","consecutive losses:"," "}
     };

   //put the calculated characteristics into the array
   captions[0][1]=DoubleToString(net_profit, 2);
   captions[0][3]=DoubleToString(gross_profit, 2);
   captions[0][5]=DoubleToString(gross_loss, 2);

   captions[1][1]=DoubleToString(profit_factor, 2);
   captions[1][3]=DoubleToString(expected_payoff, 2);

   captions[2][1]=DoubleToString(absolute_drawdown, 2);
   captions[2][3]=DoubleToString(maximal_drawdown, 2)+"("+DoubleToString(maximal_drawdown_pp, 2)+"%)";
   captions[2][5]=DoubleToString(relative_drawdown_pp, 2)+"%("+DoubleToString(relative_drawdown, 2)+")";

   captions[3][1]=IntegerToString(total);
   captions[3][3]=IntegerToString(short_positions)+"("+DoubleToString(short_positions_won, 2)+"%)";
   captions[3][5]=IntegerToString(long_positions)+"("+DoubleToString(long_positions_won, 2)+"%)";

   captions[4][3]=IntegerToString(profit_trades)+"("+DoubleToString(profit_trades_pp, 2)+"%)";
   captions[4][5]=IntegerToString(loss_trades)+"("+DoubleToString(loss_trades_pp, 2)+"%)";

   captions[5][3]=DoubleToString(largest_profit_trade, 2);
   captions[5][5]=DoubleToString(largest_loss_trade, 2);

   captions[6][3]=DoubleToString(average_profit_trade, 2);
   captions[6][5]=DoubleToString(average_loss_trade, 2);

   captions[7][3]=IntegerToString(maximum_consecutive_wins)+"("+DoubleToString(maximum_consecutive_wins_usd, 2)+")";
   captions[7][5]=IntegerToString(maximum_consecutive_losses)+"("+DoubleToString(maximum_consecutive_losses_usd, 2)+")";

   captions[8][3]=DoubleToString(maximum_consecutive_profit_usd, 2)+"("+IntegerToString(maximum_consecutive_profit)+")";
   captions[8][5]=DoubleToString(maximum_consecutive_loss_usd, 2)+"("+IntegerToString(maximum_consecutive_loss)+")";

   captions[9][3]=IntegerToString(average_consecutive_wins);
   captions[9][5]=IntegerToString(average_consecutive_losses);

   if(Chart_ratio<100) //if the balance chart doesn't take up the entire table
     {
      for(int i=0;i<10;i++) //go through the interface elements
        {
         for(int j=0;j<6;j++)
           {
            //specify the position
            cells[i][j].X_Distance(j*(x_size/6.0));
            cells[i][j].Y_Distance(i*(chart_border/10.0));
            //the size
            cells[i][j].X_Size(x_size/6.0);
            cells[i][j].Y_Size(chart_border/10.0);
            //the text
            cells[i][j].SetString(OBJPROP_TEXT,captions[i][j]);
            //and font size
            cells[i][j].FontSize(GetFontSize(x_size/6.0,chart_border/10.0));
           }
        }
     }

   if(Chart_ratio>0)//if the balance chart is required
     {
      //refresh the balance chart
      int X=x_size*0.75,Y=y_size-chart_border;
      //get the chart
      GetChart(X,Y,CreateGoogleRequest(X,Y,true),"board_balance_chart");
      //set its position
      BalanceChart.Y_Distance(chart_border);
      //specify file names
      BalanceChart.BmpFileOn("board_balance_chart.bmp");
      BalanceChart.BmpFileOff("board_balance_chart.bmp");
      //refresh the pie chart
      X=x_size*0.25;
      //get the chart
      GetChart(X,Y,CreateGoogleRequest(X,Y,false),"pie_chart");
      //set its new position
      PieChart.Y_Distance(chart_border);
      PieChart.X_Distance(x_size*0.75);
      //specify file names
      PieChart.BmpFileOn("pie_chart.bmp");
      PieChart.BmpFileOff("pie_chart.bmp");
     }

   ChartRedraw(); //redraw the chart
  }
There are lots of codes, analogous to the CreateInterface() method, first the Calculate() function calculates the indicators, then they are entered into the graphic objects, and simultaneously the object sizes are tuned to the sizes of the windows, using X_Size() and Y_Size() methods. X_Distance and Y_Distance methods change the position of the object.
Pay attention to the function GetFontSize(), it selects a font size, which will not cause the text to "overflow" the borders of the container after being rescaled, and, conversely, will not become too small.
Let's consider this function more closely:
//import DLL function for string metrics
#import "String_Metrics.dll"
void GetStringMetrics(int font_size,int &X,int &Y);
#import

//+------------------------------------------------------------------+
///Function of determining the optimum font size
//+------------------------------------------------------------------+
int Board::GetFontSize(int x,int y)
  {
   int res=8;
   for(int i=15;i>=1;i--)//go through the different font sizes
     {
      int X,Y; //here we input the line metrics
      //determine the metrics
      GetStringMetrics(i,X,Y);
      //if the line fits the set borders - return the font size
      if(X<=x && Y<=y) return i;
     }
   return res;
  }
The GetStringMetrics() function is imported from the DLL, described above, the code of which can be found in the archive DLL_Sources.zip and can be modified if necessary. I think it might come in handy if you chose to design your own interface in the project.
We have finished with the user interface, let us turn to the calculation of trading indicators.
4. Calculation of trading indicators
The Calculate() method performs the calculations.
But we also need the GetData() method, which receives the necessary data:
//+------------------------------------------------------------------+
///Function of receiving the deals and balance data
//+------------------------------------------------------------------+
void Board::GetData()
  {
   //delete old data
   Data.Shutdown();
   ChartData.Shutdown();
   pie_data.Shutdown();
   //prepare all the deals history
   HistorySelect(0,TimeCurrent());
   CAccountInfo acc_inf;   //object for work with account
   //calculate the balance
   double balance=acc_inf.Balance();
   double store=0; //balance
   long_positions=0;
   short_positions=0;
   long_positions_won=0;
   short_positions_won=0;
   for(int i=0;i<HistoryDealsTotal();i++) //go through all of the deals in the history

     {
      CDealInfo deal;  //the information about the deals will be stored here
      deal.Ticket(HistoryDealGetTicket(i));//get deal ticket
      //if the trade had a financial result (exit of the market)
      if(deal.Ticket()>=0 && deal.Entry()==DEAL_ENTRY_OUT)
        {
         pie_data.Add(deal.Symbol()); //add data for the pie chart
         //check for the symbol
         if(!For_all_symbols && deal.Symbol()!=Symbol()) continue;
         double profit=deal.Profit(); //retrieve the trade profit
         profit+=deal.Swap();         //swap
         profit+=deal.Commission();   //commission
         store+=profit;               //cumulative profit
         Data.Add(new CArrayDouble);  //add new element to the array
         ((CArrayDouble *)Data.At(Data.Total()-1)).Add(profit);  //and data
         ((CArrayDouble *)Data.At(Data.Total()-1)).Add(deal.Type());
        }
     }

   //calculate the initial deposit
   double initial_deposit=(balance-store);
   for(int i=0;i<Data.Total();i++) //go through the prepared trades
     {
      //calculate the balance value
      initial_deposit+=((CArrayDouble *)Data.At(i)).At(0);
      ChartData.Add(initial_deposit); //and put it to the array
     }
  }
First, let's consider the method of storing data. The standard library provides the classes of data structures, which allow you to refrain from using arrays. We need a two-dimensional array, in which we will store data on profits and the types of transactions in history. But the Standard Library does not provide explicit classes for organizing two-dimensional arrays, however there are CArrayDouble (array of double data type) and CArrayObj classes (dynamic array of pointers to CObject class instances and its heirs). I.e we can create an array of arrays of type double, which is exactly what is done.
Of course, the statements like ((CArrayDouble *) Data.At (Data.Total () - 1 )). Add (profit) doesn't look as neat as data [i] [j] = profit , but this is only at first glance. After all, by simply declaring an array, without using the standard library classes, we are deprived of such benefits as a built-in memory manager, the ability to insert a different array, comparing arrays, finding items, etc. Thus, the use of classes of memory organization frees us from the need to control the overflow of the array, and provides us with many useful instruments.
The Total() method of CArray (see Fig. 1.) class returns the number of elements in the array, the Add() method adds them, the At() method returns the elements.
Since we decided to build a pie chart, in order to display the number of deals for symbols, we need to collect the necessary data.
We will write an auxiliary class, intended for collecting this data:
//+------------------------------------------------------------------+
///The Pie chart class
//+------------------------------------------------------------------+
class PieData
  {
protected:
///number of deals per symbol
   CArrayInt         val;
///symbols
   CArrayString      symb;
public:
///delete the data
   bool Shutdown()
     {
      bool res=true;
      res&=val.Shutdown();
      res&=symb.Shutdown();
      return res;
     }
///search for a sting in the array
   int Search(string str)
     {  //check all array elements
      for(int i=0;i<symb.Total();i++)
         if(symb.At(i)==str) return i;
      return -1;
     }
///add new data
   void Add(string str)
     {
      int symb_pos=Search(str);//determine symbol position in the array
      if(symb_pos>-1)
         val.Update(symb_pos,val.At(symb_pos)+1);//update the deals data
      else //if there isn't such a symbol yet
        {
         symb.Add(str); //add it
         val.Add(1);
        }
     }

   int Total() const {return symb.Total();}
   int Get_val(int pos) const {return val.At(pos);}
   string Get_symb(int pos) const {return symb.At(pos);}
  };
It is not always that the standard library classes will be able to provide us with the necessary methods for work. In this example, the Search() method of CArrayString class is not suitable, because in order to apply it, we must first sort out the array, which violates the data structure. Therefore we had to write our own method.
The calculation of trade characteristics is implemented in Calculate() method:
//+------------------------------------------------------------------+
///Calculation of characteristics
//+------------------------------------------------------------------+
void Board::Calculate()
  {
   //get the data
   GetData();
   //zero all characteristics
   gross_profit=0;
   gross_loss=0;
   net_profit=0;
   profit_factor=0;
   expected_payoff=0;
   absolute_drawdown=0;
   maximal_drawdown_pp=0;
   maximal_drawdown=0;
   relative_drawdown=0;
   relative_drawdown_pp=0;
   total=Data.Total();
   long_positions=0;
   long_positions_won=0;
   short_positions=0;
   short_positions_won=0;
   profit_trades=0;
   profit_trades_pp=0;
   loss_trades=0;
   loss_trades_pp=0;
   largest_profit_trade=0;
   largest_loss_trade=0;
   average_profit_trade=0;
   average_loss_trade=0;
   maximum_consecutive_wins=0;
   maximum_consecutive_wins_usd=0;
   maximum_consecutive_losses=0;
   maximum_consecutive_losses_usd=0;
   maximum_consecutive_profit=0;
   maximum_consecutive_profit_usd=0;
   maximum_consecutive_loss=0;
   maximum_consecutive_loss_usd=0;
   average_consecutive_wins=0;
   average_consecutive_losses=0;

   if(total==0) return; //there isn't deals - return from the function
   double max_peak=0,min_peak=0,tmp_balance=0;
   int max_peak_pos=0,min_peak_pos=0;
   int max_cons_wins=0,max_cons_losses=0;
   double max_cons_wins_usd=0,max_cons_losses_usd=0;
   int avg_win=0,avg_loss=0,avg_win_cnt=0,avg_loss_cnt=0;

   for(int i=0; i<total; i++)
     {
      double profit=((CArrayDouble *)Data.At(i)).At(0); //get profit
      int deal_type=((CArrayDouble *)Data.At(i)).At(1); //and deal type
      switch(deal_type) //check deal type
        {
         //and calculate number of long and short positions
         case DEAL_TYPE_BUY: {long_positions++; if(profit>=0) long_positions_won++; break;}
         case DEAL_TYPE_SELL: {short_positions++; if(profit>=0) short_positions_won++; break;}
        }

      if(profit>=0)//the deal is profitable
        {
         gross_profit+=profit; //gross profit
         profit_trades++;      //number of profit deals
         //the largest profitable trade and the largest profitable series
         if(profit>largest_profit_trade) largest_profit_trade=profit;

         if(maximum_consecutive_losses<max_cons_losses ||
            (maximum_consecutive_losses==max_cons_losses && maximum_consecutive_losses_usd>max_cons_losses_usd))
           {
            maximum_consecutive_losses=max_cons_losses;
            maximum_consecutive_losses_usd=max_cons_losses_usd;
           }
         if(maximum_consecutive_loss_usd>max_cons_losses_usd ||
            (maximum_consecutive_loss_usd==max_cons_losses_usd && maximum_consecutive_losses<max_cons_losses))
           {
            maximum_consecutive_loss=max_cons_losses;
            maximum_consecutive_loss_usd=max_cons_losses_usd;
           }
         //average profit per deal
         if(max_cons_losses>0) {avg_loss+=max_cons_losses; avg_loss_cnt++;}
         max_cons_losses=0;
         max_cons_losses_usd=0;
         max_cons_wins++;
         max_cons_wins_usd+=profit;
        }
      else //deal is losing
        {
         gross_loss-=profit; //cumulative profit
         loss_trades++;      //number of losing deals
         //the most unprofitable deal and the most unprofitable series
         if(profit<largest_loss_trade) largest_loss_trade=profit;
         if(maximum_consecutive_wins<max_cons_wins ||
            (maximum_consecutive_wins==max_cons_wins && maximum_consecutive_wins_usd<max_cons_wins_usd))
           {
            maximum_consecutive_wins=max_cons_wins;
            maximum_consecutive_wins_usd=max_cons_wins_usd;
           }
         if(maximum_consecutive_profit_usd<max_cons_wins_usd ||
            (maximum_consecutive_profit_usd==max_cons_wins_usd && maximum_consecutive_profit<max_cons_wins))
           {
            maximum_consecutive_profit=max_cons_wins;
            maximum_consecutive_profit_usd=max_cons_wins_usd;
           }
         //average lose per deal
         if(max_cons_wins>0) {avg_win+=max_cons_wins; avg_win_cnt++;}
         max_cons_wins=0;
         max_cons_wins_usd=0;
         max_cons_losses++;
         max_cons_losses_usd+=profit;
        }

      tmp_balance+=profit; //absolute drawdown calculation
      if(tmp_balance>max_peak) {max_peak=tmp_balance; max_peak_pos=i;}
      if(tmp_balance<min_peak) {min_peak=tmp_balance; min_peak_pos=i;}
      if((max_peak-min_peak)>maximal_drawdown && min_peak_pos>max_peak_pos) maximal_drawdown=max_peak-min_peak;
     }
   //maximal drawdown calculation
   double min_peak_rel=max_peak;
   tmp_balance=0;
   for(int i=max_peak_pos;i<total;i++)
     {
      double profit=((CArrayDouble *)Data.At(i)).At(0);
      tmp_balance+=profit;
      if(tmp_balance<min_peak_rel) min_peak_rel=tmp_balance;
     }
   //relative drawdown calculation
   relative_drawdown=max_peak-min_peak_rel;
   //net profit
   net_profit=gross_profit-gross_loss;
   //profit factor
   profit_factor=(gross_loss!=0) ?  gross_profit/gross_loss : gross_profit;
   //expected payoff
   expected_payoff=net_profit/total;
   double initial_deposit=AccountInfoDouble(ACCOUNT_BALANCE)-net_profit;
   absolute_drawdown=MathAbs(min_peak);
   //drawdowns
   maximal_drawdown_pp=(initial_deposit!=0) ?(maximal_drawdown/initial_deposit)*100.0 : 0;
   relative_drawdown_pp=((max_peak+initial_deposit)!=0) ?(relative_drawdown/(max_peak+initial_deposit))*100.0 : 0;

   //profit and losing trade percentage
   profit_trades_pp=((double)profit_trades/total)*100.0;
   loss_trades_pp=((double)loss_trades/total)*100.0;

   //average profitable and losing deals
   average_profit_trade=(profit_trades>0) ? gross_profit/profit_trades : 0;
   average_loss_trade=(loss_trades>0) ? gross_loss/loss_trades : 0;

   //maximum consecutive losses
   if(maximum_consecutive_losses<max_cons_losses ||
      (maximum_consecutive_losses==max_cons_losses && maximum_consecutive_losses_usd>max_cons_losses_usd))
     {
      maximum_consecutive_losses=max_cons_losses;
      maximum_consecutive_losses_usd=max_cons_losses_usd;
     }
   if(maximum_consecutive_loss_usd>max_cons_losses_usd ||
      (maximum_consecutive_loss_usd==max_cons_losses_usd && maximum_consecutive_losses<max_cons_losses))
     {
      maximum_consecutive_loss=max_cons_losses;
      maximum_consecutive_loss_usd=max_cons_losses_usd;
     }

   if(maximum_consecutive_wins<max_cons_wins ||
      (maximum_consecutive_wins==max_cons_wins && maximum_consecutive_wins_usd<max_cons_wins_usd))
     {
      maximum_consecutive_wins=max_cons_wins;
      maximum_consecutive_wins_usd=max_cons_wins_usd;
     }
   if(maximum_consecutive_profit_usd<max_cons_wins_usd ||
      (maximum_consecutive_profit_usd==max_cons_wins_usd && maximum_consecutive_profit<max_cons_wins))
     {
      maximum_consecutive_profit=max_cons_wins;
      maximum_consecutive_profit_usd=max_cons_wins_usd;
     }
   //average loss and profit
   if(max_cons_losses>0) {avg_loss+=max_cons_losses; avg_loss_cnt++;}
   if(max_cons_wins>0) {avg_win+=max_cons_wins; avg_win_cnt++;}
   average_consecutive_wins=(avg_win_cnt>0) ? round((double)avg_win/avg_win_cnt) : 0;
   average_consecutive_losses=(avg_loss_cnt>0) ? round((double)avg_loss/avg_loss_cnt) : 0;

   //number of profitable long and short positions
   long_positions_won=(long_positions>0) ?((double)long_positions_won/long_positions)*100.0 : 0;
   short_positions_won=(short_positions>0) ?((double)short_positions_won/short_positions)*100.0 : 0;
  }
5. Using Google Chart API to create a balance chart
Google Chart API allows developers to instantly create diagrams of various types. Google Chart API is stored at the link to the resource (URL) on the web servers of Google and when receiving a correctly formatted link (URL), returns the diagram as an image.
Diagram characteristics (colors, headers, axis, points on the chart, etc.) are specified by the link (URL). The resulting image can be stored in a file system or database. The most pleasing aspect is that Google Chart API is free of charge and does not require having an account or going through the registration process.
GetChart() method receives the chart from Google and saves it to the disk:
#import "PNG_to_BMP.dll"//import of DLL with the function of conversion of PNG images to BMP
bool Convert_PNG(string src,string dst);
#import

#import "wininet.dll"//import DLL with the function for working with the internet
int InternetAttemptConnect(int x);
int InternetOpenW(string sAgent,int lAccessType,
                  string sProxyName="",string sProxyBypass="",
                  int lFlags=0);
int InternetOpenUrlW(int hInternetSession,string sUrl,
                     string sHeaders="",int lHeadersLength=0,
                     int lFlags=0,int lContext=0);
int InternetReadFile(int hFile,char &sBuffer[],int lNumBytesToRead,
                     int &lNumberOfBytesRead[]);
int InternetCloseHandle(int hInet);
#import

//+------------------------------------------------------------------+
///Function of creating a balance chart
//+------------------------------------------------------------------+
void Board::GetChart(int X_size,int Y_size,string request,string file_name)
  {
   if(X_size<1 || Y_size<1) return; //too small
   //try to create connection
   int rv=InternetAttemptConnect(0);
   if(rv!=0) {Alert("Error in call of the InternetAttemptConnect()"); return;}
   //initialize the structures
   int hInternetSession=InternetOpenW("Microsoft Internet Explorer", 0, "", "", 0);
   if(hInternetSession<=0) {Alert("Error in call of the InternetOpenW()"); return;}
   //send request
   int hURL=InternetOpenUrlW(hInternetSession, request, "", 0, 0, 0);
   if(hURL<=0) Alert("Error in call of the InternetOpenUrlW()");
   //file with the result
   CFileBin chart_file;
   //let's create it
   chart_file.Open(file_name+".png",FILE_BIN|FILE_WRITE);
   int dwBytesRead[1]; //number of data read
   char readed[1000];  //the data
   //read the data, returned by server after the request
   while(InternetReadFile(hURL,readed,1000,dwBytesRead))
     {
      if(dwBytesRead[0]<=0) break; //no data - exit
      chart_file.WriteCharArray(readed,0,dwBytesRead[0]); //write data to file
     }
   InternetCloseHandle(hInternetSession);//close connection
   chart_file.Close();//close file
   //******************************
   //prepare the paths for the converter
   CString src;
   src.Assign(TerminalInfoString(TERMINAL_PATH));
   src.Append("\MQL5\Files\\"+file_name+".png");
   src.Replace("\\","\\\\");
   CString dst;
   dst.Assign(TerminalInfoString(TERMINAL_PATH));
   dst.Append("\MQL5\Images\\"+file_name+".bmp");
   dst.Replace("\\","\\\\");
   //convert the file
   if(!Convert_PNG(src.Str(),dst.Str())) Alert("Error in call of the Convert_PNG()");
  }
You can get the details for working with online tools of API Windows and MQL5 from the article Using WinInet.dll for exchange data between terminals via the Internet. Therefore I will not spend time on this. The imported function Convert_PNG() was written by me for a converting PNG images to BMP.
It is necessary because Google Chart returns charts in PNG or GIF format, and the "graphic label" object only accepts BMP images. The code of the corresponding PNG_to_BMP.dll library functions can be found in the archive DLL_Sources.zip.
This function also shows some examples of working with lines and files, using the standard library. CString class methods allow the performance of the same operations as String Functions . Class CFile is the base for CFileBin and CFileTxt classes. With their help, we can produce the reading and recording of binary and text files, respectively. The methods are similar to functions for working with files.
Finally, we'll describe the function CreateGoogleRequest () - it creates queries from the data on the balance:
//+------------------------------------------------------------------+
///Function for creating a request for the Google Charts server
//+------------------------------------------------------------------+
string Board::CreateGoogleRequest(int X_size,int Y_size,bool type)
  {
   if(X_size>1000) X_size=1000; //check the chart size
   if(Y_size>1000) Y_size=300;  //to make sure it is not too large
   if(X_size<1) X_size=1;       //and small//s18>
   if(Y_size<1) Y_size=1;
   if(X_size*Y_size>300000) {X_size=1000; Y_size=300;}//and fit the area
   CString res; //string with results
   if(type) //create request for the balance chart
     {
      //prepare the request
      res.Assign("http://chart.apis.google.com/chart?cht=lc&chs=");
      res.Append(IntegerToString(X_size));
      res.Append("x");
      res.Append(IntegerToString(Y_size));
      res.Append("&chd=t:");
      for(int i=0;i<ChartData.Total();i++)
         res.Append(DoubleToString(ChartData.At(i),2)+",");
      res.TrimRight(",");
      //sort array
      ChartData.Sort();
      res.Append("&chxt=x,r&chxr=0,0,");
      res.Append(IntegerToString(ChartData.Total()));
      res.Append("|1,");
      res.Append(DoubleToString(ChartData.At(0),2)+",");
      res.Append(DoubleToString(ChartData.At(ChartData.Total()-1),2));
      res.Append("&chg=10,10&chds=");
      res.Append(DoubleToString(ChartData.At(0),2)+",");
      res.Append(DoubleToString(ChartData.At(ChartData.Total()-1),2));
     }
   else //create request for the pie chart
     {
      //prepare the request
      res.Assign("http://chart.apis.google.com/chart?cht=p3&chs=");
      res.Append(IntegerToString(X_size));
      res.Append("x");
      res.Append(IntegerToString(Y_size));
      res.Append("&chd=t:");
      for(int i=0;i<pie_data.Total();i++)
         res.Append(IntegerToString(pie_data.Get_val(i))+",");
      res.TrimRight(",");
      res.Append("&chdl=");
      for(int i=0;i<pie_data.Total();i++)
         res.Append(pie_data.Get_symb(i)+"|");
      res.TrimRight("|");
      res.Append("&chco=");
      int cnt=0;
      for(int i=0;i<pie_data.Total();i++)
        {
         if(cnt>11) cnt=0;
         res.Append(colors[cnt]+"|");
         cnt++;
        }
      res.TrimRight("|");
     }
   return res.Str(); //return the result
  }
Note that requests for the balance chart and pie chart are collected separately. Append() method adds another row to the end of the existing row, and the TrimRight() method allows you to remove extra characters, displayed at the end of the line.
6. Final assembly and testing
The class is ready, let's test it. We begin with the OnInit () indicator:
Board *tablo;   //pointer to the board object
int prev_x_size=0,prev_y_size=0,prev_deals=0;
//+------------------------------------------------------------------+
//| Custom indicator initialization function                         |
//+------------------------------------------------------------------+
int OnInit()
  {
//--- indicator buffers mapping
   //set indicator short name
   IndicatorSetString(INDICATOR_SHORTNAME,"IT");
   //launch the timer
   EventSetTimer(1);
   //create object instance
   tablo=new Board;
   //and the interface
   tablo.CreateInterface();
   prev_deals=HistoryDealsTotal(); //number of deals
   //current sizes of the window
   prev_x_size=ChartGetInteger(0,CHART_WIDTH_IN_PIXELS);
   prev_y_size=ChartGetInteger(0, CHART_HEIGHT_IN_PIXELS);
//---
   return(0);
  }
Here we dynamically create the Board class instance, launch the timer, initialize the auxiliary variables.
Right away we place the OnDeinit() function, there we'll remove the object (which automatically invokes the destructor), and stop the timer:
void OnDeinit(const int reason)
{
   EventKillTimer(); //stop the timer
   delete table;    //and board
}
Function OnCalculate() will monitor the flow of new deals, tick by tick, and update the display, if this occurs:
int OnCalculate(const int rates_total,
                const int prev_calculated,
                const datetime &time[],
                const double &open[],
                const double &high[],
                const double &low[],
                const double &close[],
                const long &tick_volume[],
                const long &volume[],
                const int &spread[])
  {
//---
   //prepare the history
   HistorySelect(0,TimeCurrent());
   int deals=HistoryDealsTotal();
   //update the board if number of deals has changed
   if(deals!=prev_deals) tablo.Refresh();
   prev_deals=deals;
//--- return value of prev_calculated for next call
   return(rates_total);
  }
OnTimer() function monitors the changes in the size of the window, and, if necessary, customizes the display size, it also monitors the deals just like OnCalculate(), in case the ticks come rarer than 1 per second.
void OnTimer()
  {
   int x_size=ChartGetInteger(0, CHART_WIDTH_IN_PIXELS);
   int y_size=ChartGetInteger(0, CHART_HEIGHT_IN_PIXELS);
   //update the board if window size has changed
   if(x_size!=prev_x_size || y_size!=prev_y_size) tablo.Refresh();
   prev_x_size=x_size;
   prev_y_size=y_size;
   //update the board if number of deals has changed
   HistorySelect(0,TimeCurrent());
   int deals=HistoryDealsTotal();
   if(deals!=prev_deals) tablo.Refresh();
   prev_deals=deals;
  }
Compile and run the indicator:

Figure 3. The final view of the table
Conclusion
Dear reader, I hope that in reading this article, you will find something new for yourselves. I have tried to open before you all of the potentialities of such a wonderful instrument as the Standard Library, because it is provides convenience, speed, and high quality of performance. Of course, you need to have some knowledge of OOP.
Good luck.
To get started, unzip the archive MQL5.rar into the terminal folder, and permit the use of DLL. The archive DLL_Sources.zip contains the source codes of the libraries String_Metrics.dll PNG_to_BMP.dll, they were written by me in the Borland C++ Builder environment with an installed GDI.
Translated from Russian by MetaQuotes Ltd.
Original article: https://www.mql5.com/ru/articles/102
 Creating an Expert Advisor, which Trades on a Number of Instruments
 Genetic Algorithms - It's Easy!
 Functions for Money Management in an Expert Advisor
 A DLL-free solution to communicate between MetaTrader 5 terminals using Named Pipes
- Free trading apps
- Over 8,000 signals for copying
- Economic news for exploring financial markets
You agree to website policy and terms of use
Евгений
Very interesting and potentially very very useful.
Thank you for you effort.
Hi,
thanks for the good example. the problem I have is that after the last MT5 update the winnet functions are not working. is showing an access violation error. please let me know if you have overcome this error.
<vcl.h> is specifity of Borland ? i dont compile because i don t have this file!